
Table 1
Distribution of college income (N=42)
| Student numbers | Total | |||
|---|---|---|---|---|
| 5,000 or less | 5,001 or more | |||
| Total Relevant Income | £35,211,000 or above | 3 | 18 | 21 |
| £35,210,000 or below | 18 | 3 | 21 | |
| Total | 21 | 21 | 42 | |
Table 2
Q9. How would you define the problem the library is trying to address? (N=42)
| Responses | Percent of Cases | |
|---|---|---|
| N | ||
| Academic Pressures | 34 | 83% |
| Exam Stress | 32 | 78% |
| Lack of Study Space | 30 | 73% |
| Mental Ill Health | 28 | 68% |
| Social Isolation | 21 | 51% |
| Digital Well‑being | 17 | 41% |
| Financial Pressures | 11 | 27% |
Table 3
Q8a. What kinds of activities are currently offered by the library to support well‑being? (N=42)
| Responses | Percent of Cases | |
|---|---|---|
| N | ||
| Recommending the leisure reading/reading for pleasure collection | 39 | 93% |
| Recommending self‑help books, e.g Bibliotherapy | 36 | 86% |
| Mindfulness activities | 32 | 76% |
| Exam stress relief activity | 24 | 57% |
| Digital well‑being advice on VLE | 18 | 43% |
| Offering a specially designated space for well‑being | 16 | 38% |
| Improved spatial design | 14 | 33% |
| Bookclub | 13 | 31% |
| Pet therapy | 6 | 14% |
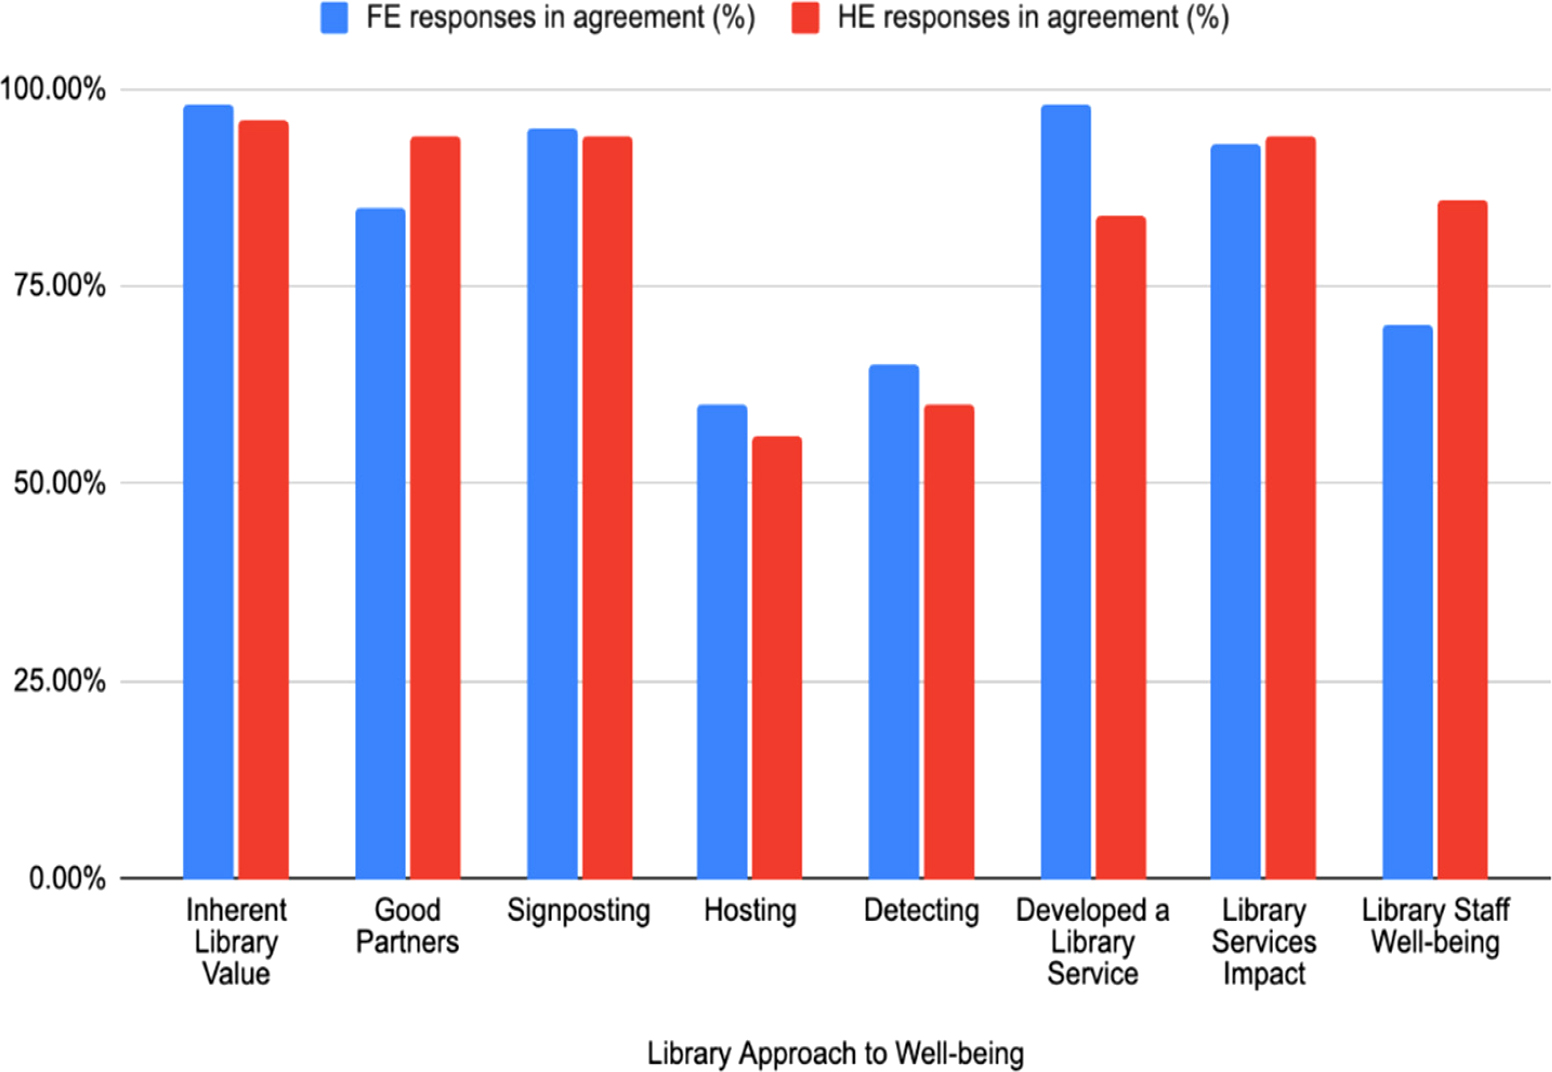
Figure 1
Percentage levels of agreement with the eight aspects of Cox and Brewster’s holistic model (2020) FE v HE
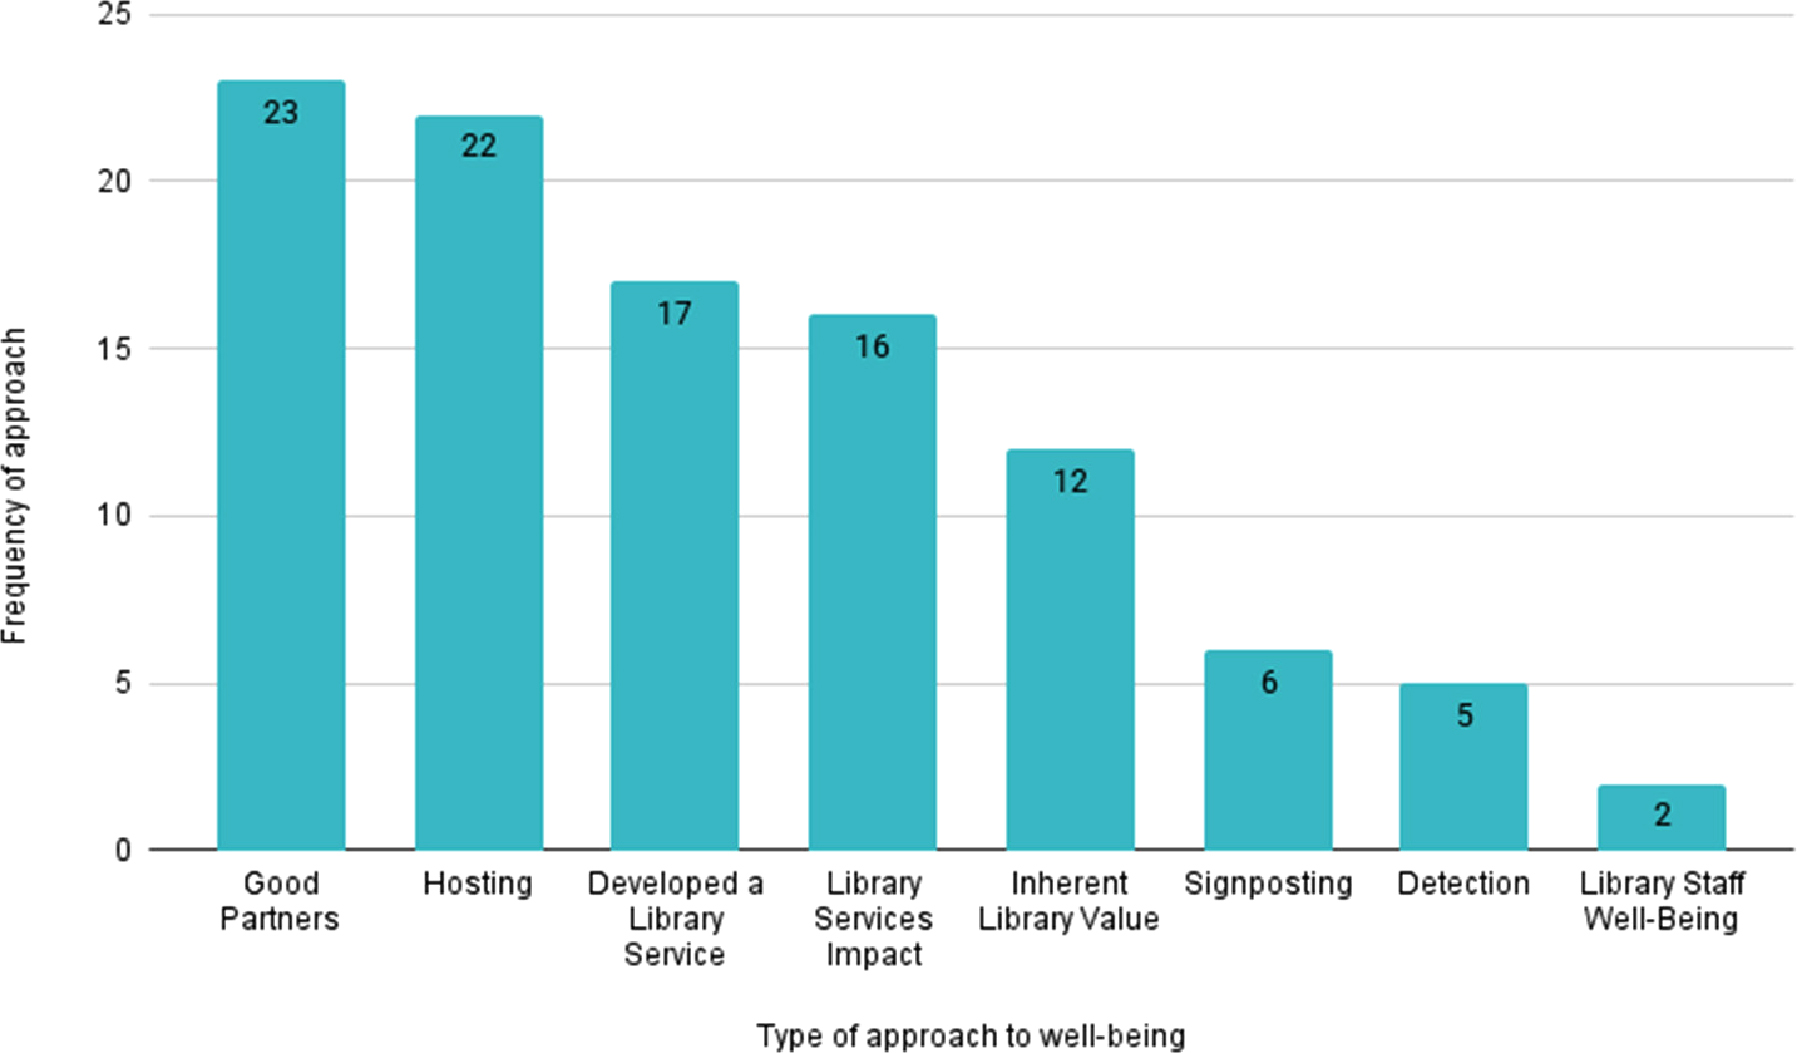
Figure 2
Coded open responses to aspects of Cox and Brewster’s Holistic Model (2020)
Table 4
Q18. Who did you partner with? (N=42)
| Responses | Percent of Cases | |
|---|---|---|
| N | ||
| Partnered with well‑being team | 15 | 38% |
| We did not partner | 15 | 38% |
| Partnered with Student Support | 9 | 23% |
| Partnered with Safeguarding | 9 | 23% |
| Partnered with Student Services | 8 | 20% |
| Partnered with Teaching Staff | 8 | 20% |
| Partnered with Senior Leaders | 4 | 10% |
| Partnered with Enrichment Team | 3 | 8% |
Table 5
Q15. How is the success of this activity being evaluated? (N=42)
| Responses | Percent of Cases | |
|---|---|---|
| N | ||
| Number of people accessing recommended resources | 19 | 46% |
| Stories of positive experiences with our activities | 16 | 39% |
| Number of people attending sessions | 13 | 32% |
| Thank‑you messages received from students/staff | 12 | 29% |
| We do not evaluate our well‑being activities | 10 | 24% |
| Satisfaction survey | 9 | 22% |
| Number of messages distributed/broadcast | 1 | 2% |