

Figure 1
Open access books show more usage and attention through average numbers of downloads, citations and web domains
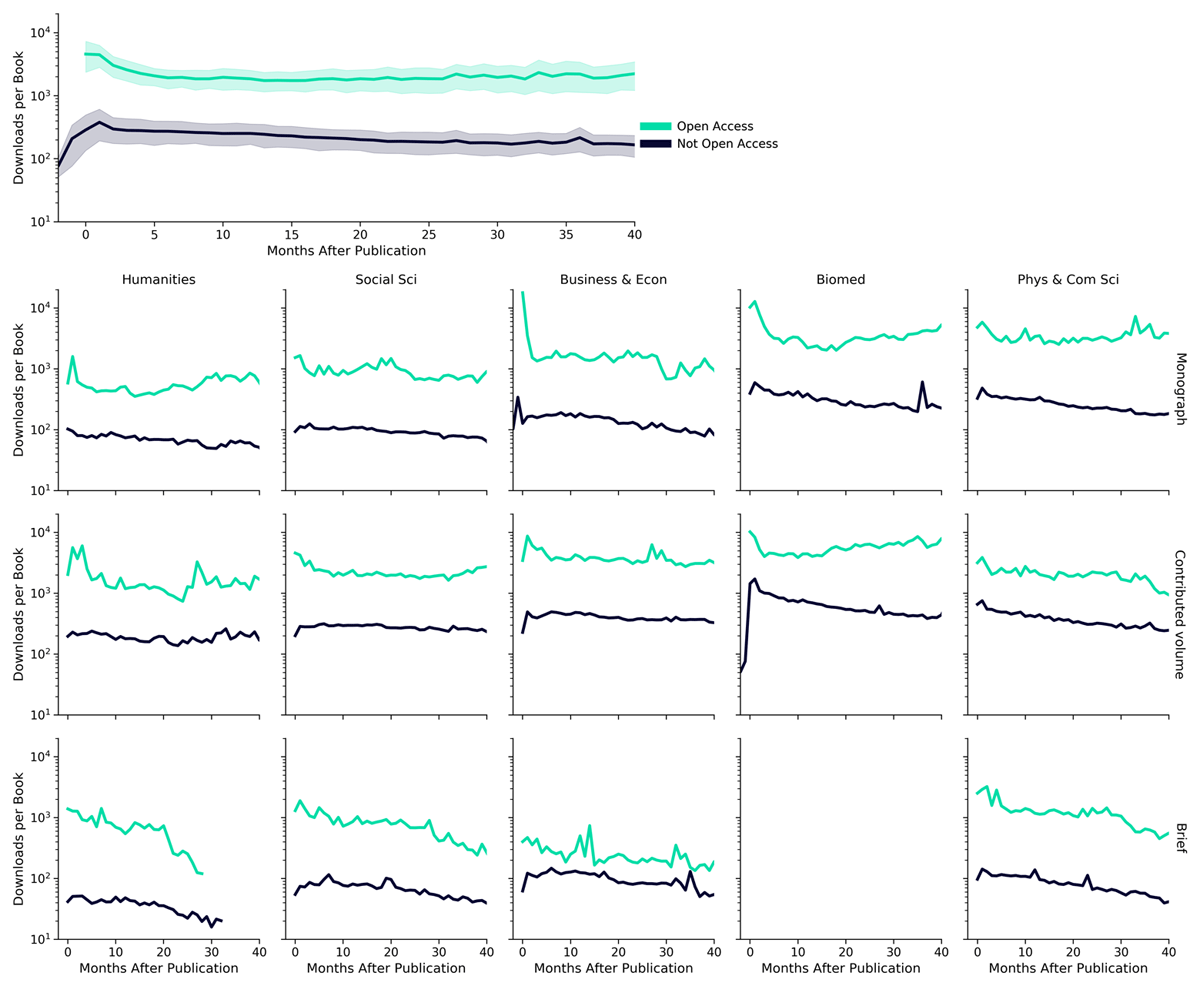
Figure 2
Open access books depicts more downloads per book for every month since date of publication

Figure 3
The geographic distribution of downloads for OA and non-OA books

Figure 4
Anonymous usage from countries with no logged usage

Figure 5
Diversity of book usage amongst countries as measured by the Gini coefficient

Figure 6
Increases in usage for books with ‘Africa’ in the title