
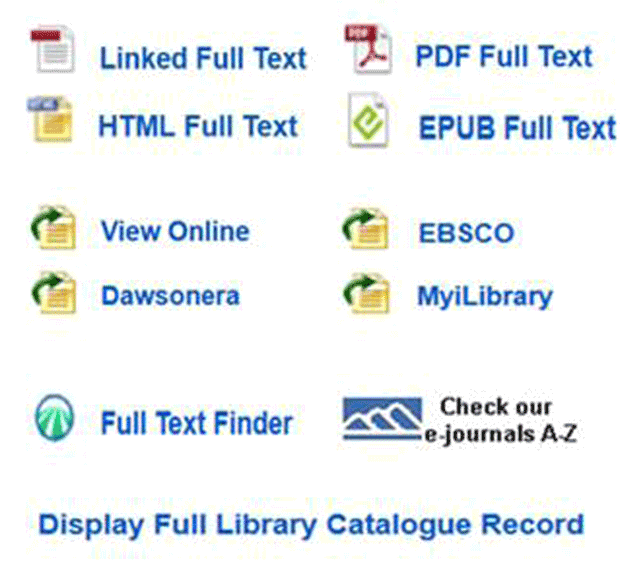
Figure 1
Non-customized icons
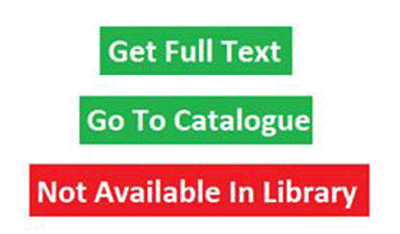
Figure 2
Customized icons
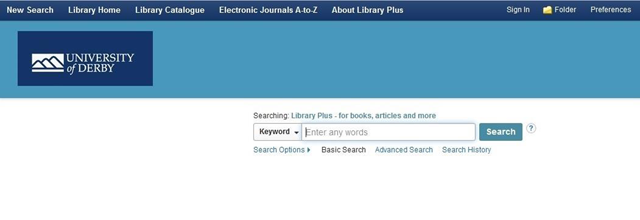
Figure 3
Basic Search homepage and search box pre-customization
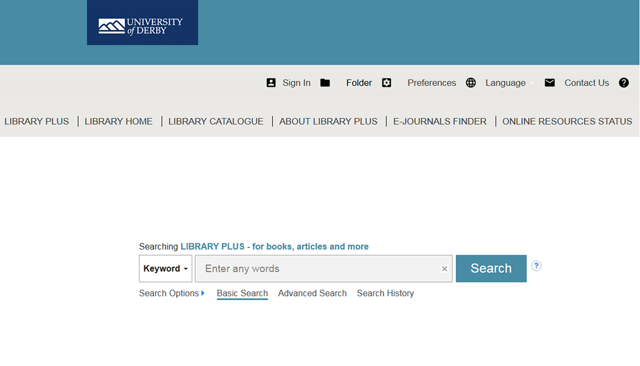
Figure 4
Basic Search homepage and search box following customization
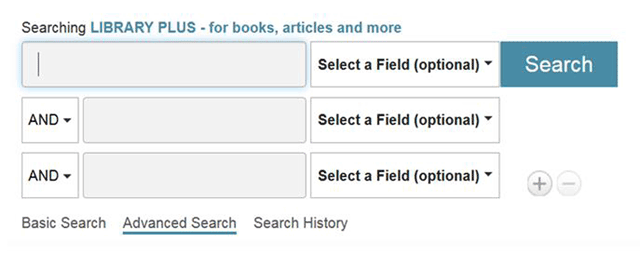
Figure 5
Advanced Search box with ‘blue line’ indicator
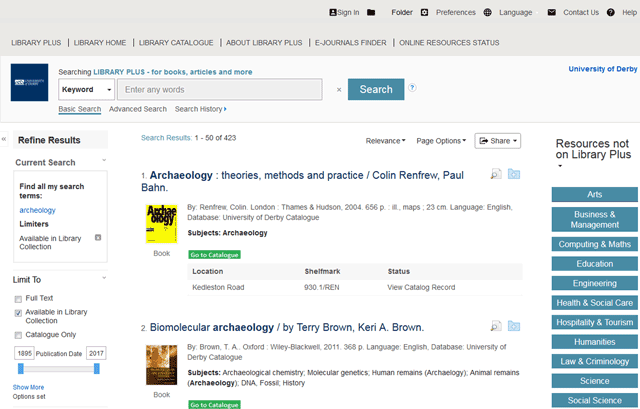
Figure 6
Basic Search results page
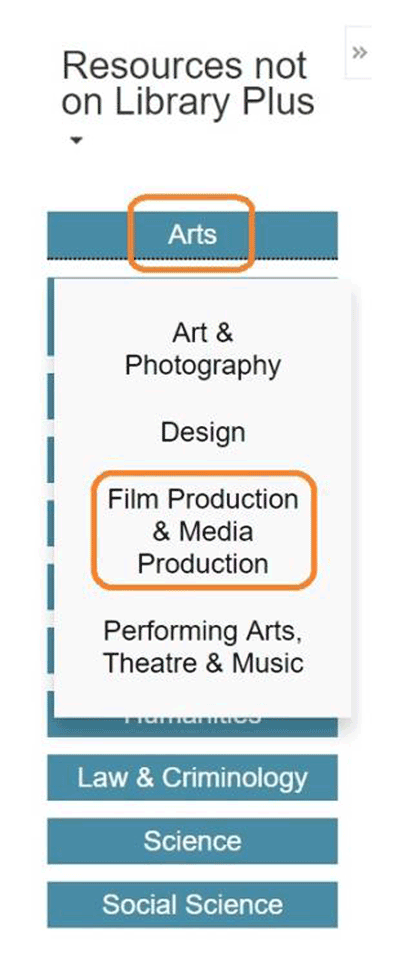
Figure 7
‘Resources not on Library Plus’ apps
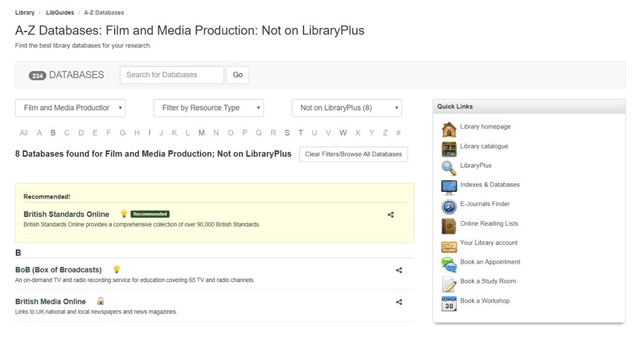
Figure 8
Film and Media Production resources ‘Not on Library Plus’

Figure 9
‘View Abstract’ icon in Advanced Search
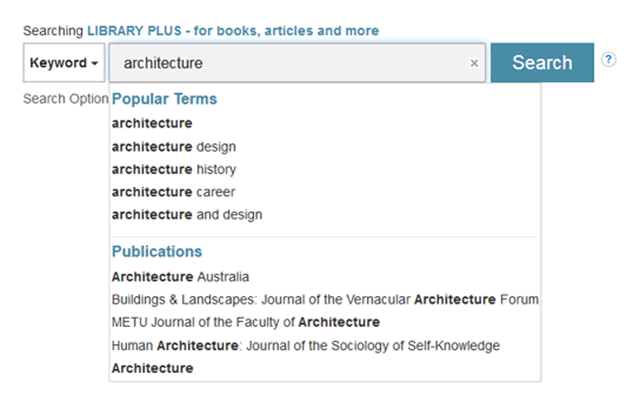
Figure 10
‘Popular Terms’ and ‘Publications’
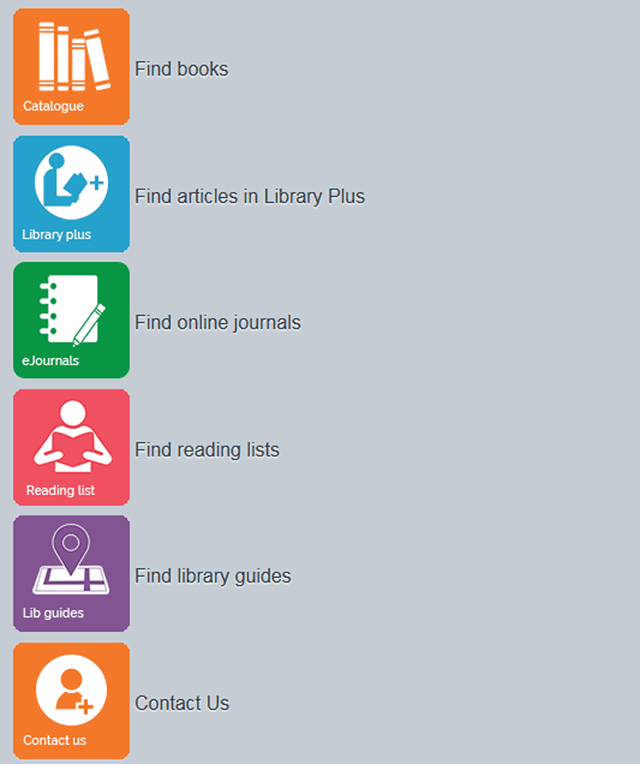
Figure 11
Library ‘tiles’ used within the UDO app
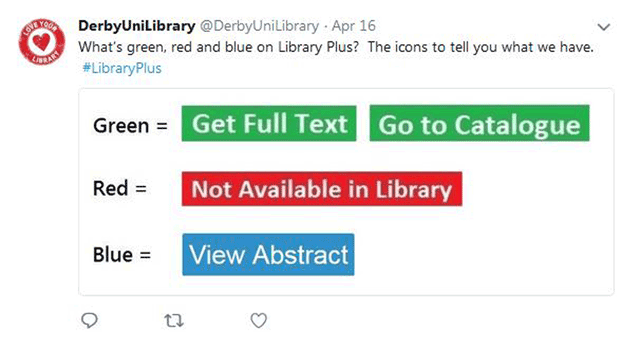
Figure 12
Twitter promotion using the coloured icons

Figure 13
Twitter promotion for the Library Plus 2.0 launch day
Table 1
Monthly Sessions usage in Library Plus (snap-shot taken between March–August 2018)
| Sessions | March | April | May | June | July | August | Total |
|---|---|---|---|---|---|---|---|
| 2018 | 76,498 | 82,425 | 65,749 | 33,769 | 29,377 | 18,852 | 306,670 |
| 2017 | 71,688 | 69,415 | 38,963 | 30,533 | 22,242 | 17,770 | 250,611 |
| Approximate difference (in %) | 7% | 19% | 69% | 11% | 32% | 6% | 22% |
Table 2
Monthly Search Clicks in Library Plus (snap-shot taken between March–August 2018)
| Search clicks | March | April | May | June | July | August | Total |
|---|---|---|---|---|---|---|---|
| 2018 | 200,115 | 217,169 | 175,373 | 89,973 | 81,307 | 49,762 | 813,699 |
| 2017 | 191,413 | 180,744 | 110,099 | 79,244 | 58,488 | 47,492 | 667,480 |
| Approximate difference (in %) | 5% | 20% | 59% | 14% | 39% | 5% | 22% |
Table 3
Monthly Total Full Text Clicks in Library Plus (snap-shot taken between March–August 2018)
| Total full text clicks | March | April | May | June | July | August | Total |
|---|---|---|---|---|---|---|---|
| 2018 | 22,957 | 25,276 | 20,188 | 9,333 | 9,381 | 5,246 | 92,381 |
| 2017 | 20,804 | 21,852 | 10,801 | 7,569 | 6,482 | 5,675 | 73,183 |
| Approximate difference (in %) | 10% | 16% | 87% | 23% | 45% | –8% | 26% |
Table 4
Monthly Abstract Views in Library Plus (snap-shot taken between March–August 2018)
| Total abstract views | March | April | May | June | July | August | Total |
|---|---|---|---|---|---|---|---|
| 2018 | 108,847 | 100,856 | 77,810 | 39,579 | 90,905 | 21,934 | 439,931 |
| 2017 | 82,132 | 85,450 | 53,514 | 35,719 | 29,920 | 27,056 | 313,791 |
| Approximate difference (in %) | 33% | 18% | 45% | 11% | 204% | –19% | 40% |
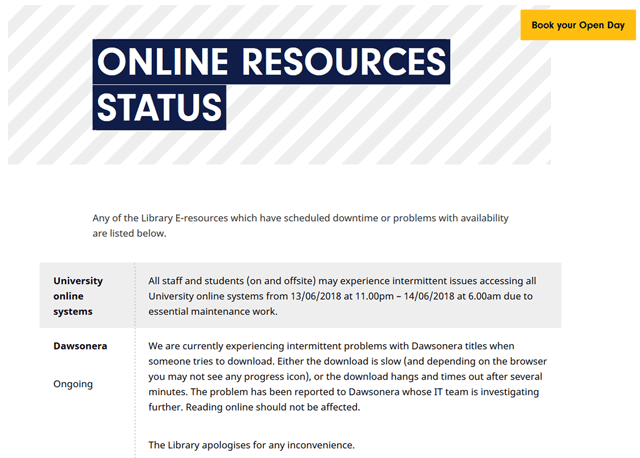
Figure 14
‘Online Resources Status’ section of Library web pages