
Table 1
Techniques Used for Worship at the Cross as listed in the Training Manual
| Key Elements | Activity |
|---|---|
| Songs | Select common and simple songs to sing together. |
| Pace of speech | Use a slow pace of speech to ensure everyone is following. |
| Checking for understanding | Ask simple yes/no questions and repeat ideas if something isn’t understood. |
| Visual images | Use pictures, visual aids, or dramas to help grasp concepts or theme of the day. |
| Length of lessons | The lesson should be short (less than 20 minutes) to accommodate people with varying attention spans. |
| Simple language | Use simple words to make it easier for all people to remember the theme of the day. |
| Repetition | Repeat key points that need to stick into the minds of the participants. |
| Encourage participation | Allow participants to ring a bell, start a song, or take part in activities during the session. |
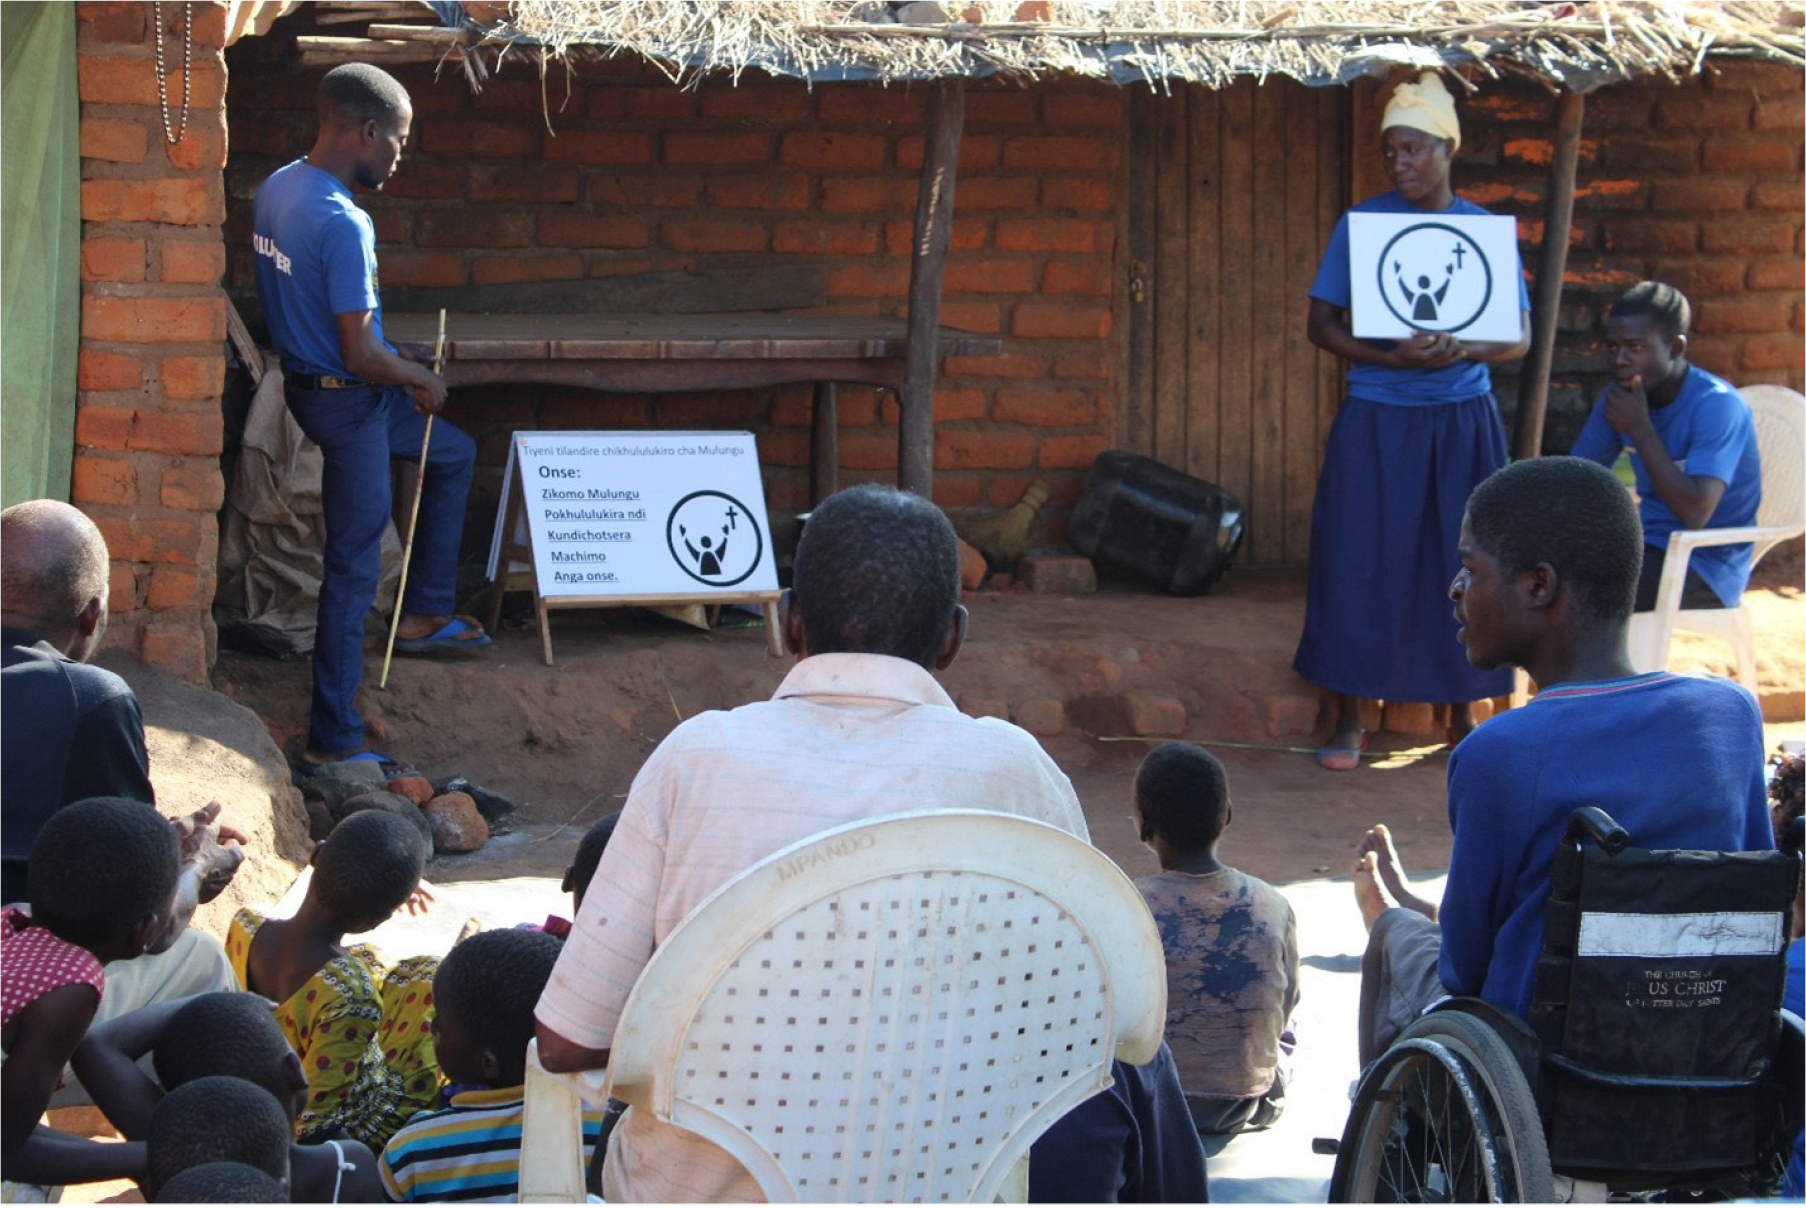
Photograph. Community based Worship at the Cross service held in rural Malawi
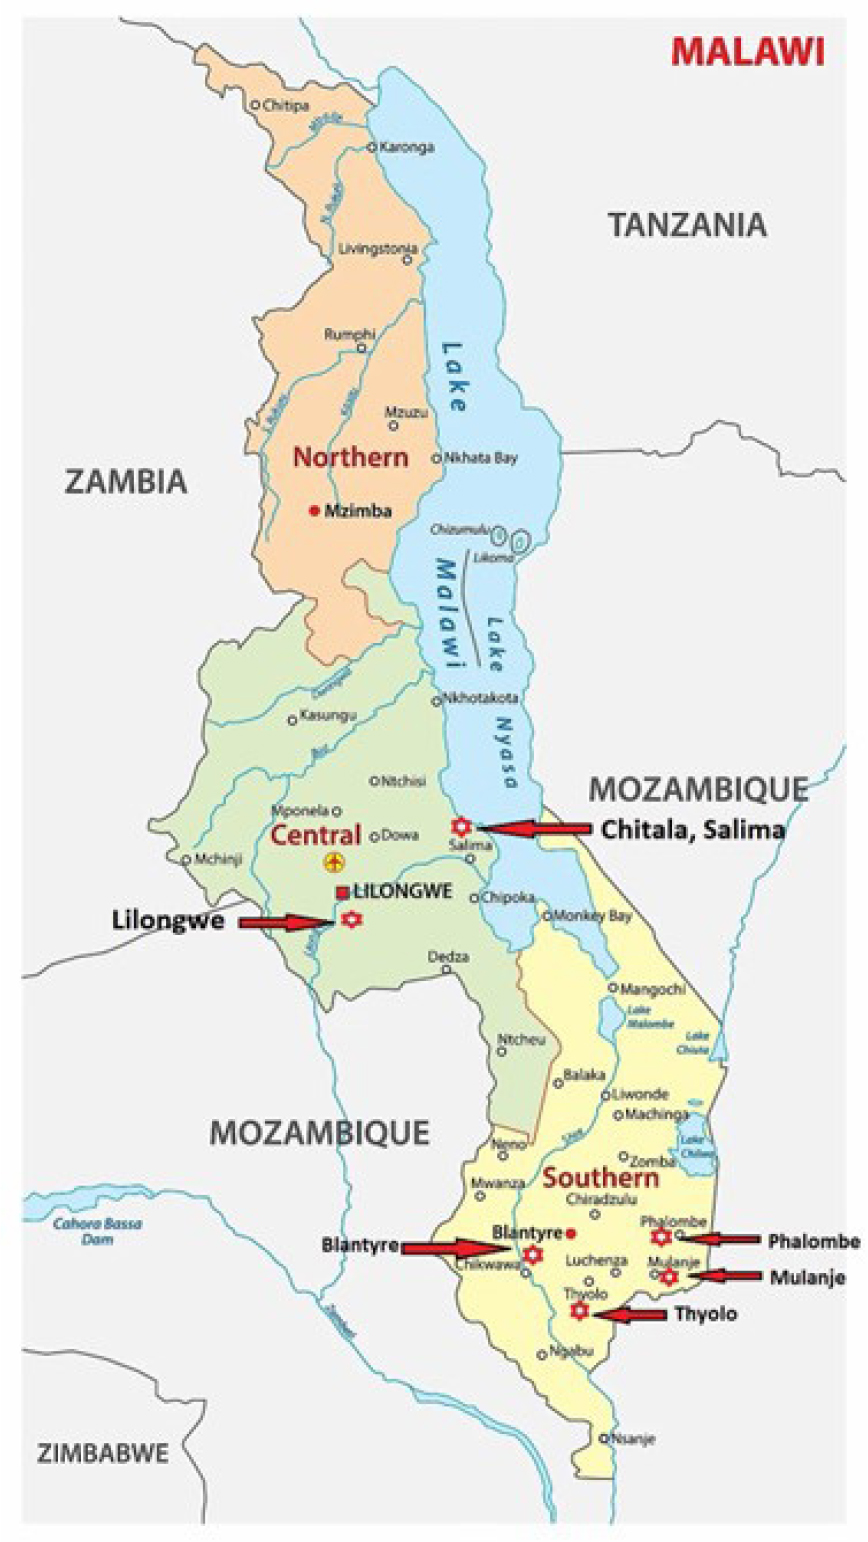
Figure 1
Map of Malawi with data collection districts highlighted (From https://www.worldatlas.com/maps/malawi)
Table 2a
Worship at the Cross (WatC) Responses (N=73).
| Information about the Person with Disability | N (%) |
|---|---|
| Person Completing Survey | |
| Adult with Disability | 37 (51%) |
| Caregiver | 27 (37%) |
| Did not respond/missing | 9 (12%) |
| Type of Disability* | |
| Physical Disability | 24 (33%) |
| Epilepsy | 16 (22%) |
| Cerebral Palsy | 7 (10%) |
| Blind/Difficult to See | 7 (10%) |
| Deaf/Difficult to Hear | 5 (7%) |
| Intellectual Disability | 3 (4%) |
| Other | 3 (4%) |
| Did not respond/missing | 15 (21%) |
| Assistive Device* | |
| Crutches/Walker | 7 (10%) |
| Wheelchair/tricycle | 4 (5%) |
| Cane | 4 (5%) |
| Hearing aid | 1 (1%) |
| Adaptor chair | 1 (1%) |
| None | 41 (56%) |
| Did not respond/missing | 15 (21%) |
| How Often Attends WatC | |
| More than monthly | 42 (58%) |
| Monthly | 19 (26%) |
| Less than Monthly | 5 (7%) |
| Did not respond/missing | 7 (10%) |
| How Long to Travel to WatC | |
| Less than 30 minutes | 7 (10%) |
| 30 min but less than 1 hour | 41 (56%) |
| 1 hour or more | 14 (19%) |
| Did not respond/missing | 11 (15%) |
| Member of a church | |
| Yes, this church | 15 (21%) |
| Yes, another church | 41 (56%) |
| Did not respond/missing | 17 (23%) |
| Attend Regular Church Services | |
| Every Week | 20 (27%) |
| Occasionally | 45 (62%) |
| Never | 1 (1%) |
| Did not respond/missing | 7 (10%) |
| Believe Jesus Died for Sins | |
| Yes | 46 (63%) |
| Somewhat/Not Sure | 9 (12%) |
| Did not respond/missing | 18 (25%) |
| Been Baptized | |
| Yes | 44 (60%) |
| No | 11 (15%) |
| Did not respond/missing | 18 (25%) |
Table 2b
Worship at the Cross (WatC) Responses (N=73).
| Information about Program Impact | N (%) |
|---|---|
| How Participates in WatC* | |
| Sing | 60 (82%) |
| Clap Hands/Play Instrument | 4 (5%) |
| Answer Questions | 12 (16%) |
| None/missing | 9 (12%) |
| Why Attends WatC* | |
| Learn God’s Word | 63 (86%) |
| Worship God | 47 (64%) |
| Prayer/Seek God’s Intervention | 18 (25%) |
| Able to Attend with Disability | 15 (21%) |
| Did not respond/missing | 4 (5%) |
| Treated like others before WatC | |
| Yes | 24 (33%) |
| Sometimes | 35 (48%) |
| No | 4 (5%) |
| Did not respond/missing | 10 (14%) |
| Treated like others since WatC | |
| Yes | 54 (74%) |
| Sometimes | 9 (12%) |
| No | 0 (0%) |
| Did not respond/missing | 10 (14%) |
| Relationship with God Changed by WatC* | |
| Stronger Relationship with God | 56 (77%) |
| Learning God’s Word | 44 (60%) |
| Improved Spiritual Life | 22 (30%) |
| Receiving Blessings | 15 (21%) |
| Improved Physical/Social Life | 15 (21%) |
| Don’t Know | 1 (1%) |
| Satisfied with WatC Services | |
| Satisfied or Very Satisfied | 58 (79%) |
| Neutral | 7 (10%) |
| Unsatisfied or Very Unsatisfied | 0 (0%) |
| Did not respond/missing | 8 (11%) |
Table 3
Volunteer Survey Responses (N=82)
| N (%) or Mean (SD) | |
|---|---|
| Program Volunteer | |
| Worship at the Cross | 82 (100%) |
| Home Based Care | 41 (50%) |
| How Long a Volunteer | |
| Less than a year | 5 (6%) |
| 1-2 years | 14 (17%) |
| 3-5 years | 29 (35%) |
| 6-8 years | 18 (22%) |
| 9-11 years | 16 (20%) |
| Satisfaction With (scale of 1=strongly agree to 5=strongly disagree) | |
| Training | 1.9 (0.69) |
| Volunteer Appreciation | 1.8 (0.96) |
| Community Acceptance of program | 1.5 (0.71) |
| Results of Home-based Care | 3.1 (2.4) |
| Comfortable Training Someone (scale of 1=very comfortable to 5=very uncomfortable) | |
| To Lead Worship at the Cross Service | 1.5 (0.76) |
| About Disabilities | 2.3 (0.83) |
| To Assess Disabilities | 2.5 (1.24) |
| To Design a Home Based Program | 3.9 (1.91) |
| To Provide Home Based Care | 4 (1.96) |
| Agree with the following statements | |
| God loves everyone | 82 (100%) |
| Christians should serve those in need | 82 (100%) |
| Disabilities are punishments for sins | 22 (27%) |
| Because of my volunteer work, I am better at reaching people with disabilities | 81 (99%) |
| How often Gospel Shared | |
| Every Visit | 17 (21%) |
| Most Visits | 49 (60%) |
| Occasionally | 14 (17%) |
| Never | 2 (2%) |
Table 4
Selected Home Based Care Evaluation Results (N-47).
| N (%) | |
|---|---|
| Age of Child | |
| Under 5 | 13 (28%) |
| 5 to 9 | 15 (32%) |
| 10 to 14 | 15 (32%) |
| 15 to 20 | 4 (9%) |
| Primary Disability | |
| Cerebral Palsy | 31 (66%) |
| Difficulty hearing/speaking | 4 (9%) |
| Epilepsy | 2 (4%) |
| Downs Syndrome | 2 (4%) |
| Other | 8 (17%) |
| Able to Sit | |
| Unaided | 34 (72%) |
| With assistance | 11 (23%) |
| Cannot | 2 (4%) |
| Stand | |
| Unaided | 14 (30%) |
| With assistance | 20 (43%) |
| Cannot | 13 (28%) |
| Feed Self | |
| Unaided | 18 (38%) |
| With assistance | 11 (23%) |
| Cannot | 17 (36%) |
| Did not answer/missing | 1 (2%) |
| Use Toilet | |
| Unaided | 10 (21%) |
| With assistance | 12 (26%) |
| Cannot | 24 (51%) |
| Did not answer/missing | 1 (2%) |
| Child responds to* | |
| Speaking | 47 (100%) |
| Touching | 44 (94%) |
| Recognizing Family | 40 (86%) |
| Watching/Playing with Others | 36 (78%) |
| Does not respond | 0 (0%) |
| Number of Words Able to Speak | |
| 0 | 17 (36%) |
| 1-10 | 11 (23%) |
| 11-25 | 4 (9%) |
| 26-50 | 3 (6%) |
| 51+ | 12 (26%) |
| Able to Move | |
| Walking | 15 (32%) |
| Crawling | 13 (28%) |
| Bottom Shuffling | 5 (11%) |
| Unable to move | 14 (30%) |
| Child Generally Feels | |
| Happy | 20 (42%) |
| Somewhat Happy | 14 (31%) |
| Neutral | 11 (23%) |
| Somewhat Sad | 2 (4%) |
| Sad | 0 (0%) |
| Household Belongs to Church | |
| Yes, this church | 7 (15%) |
| Yes, another church | 35 (74%) |
| No answer/missing | 3 (6%) |
| Did not answer/missing | 2 (4%) |
| Attend Worship at the Cross | |
| Yes | 10 (21%) |
| No | 37 (79%) |
| Child Attends School | |
| Too young | 12 (26%) |
| Yes | 13 (28%) |
| No/Did not answer | 22 (47%) |
| Frequency of Volunteer Visits | |
| A few times per week or weekly | 11 (23%) |
| A few times per month or monthly | 29 (62%) |
| A few times per year | 7 (15%) |
| Caregiver Confident with Exercises | |
| Yes | 39 (83%) |
| No/Did not answer | 8 (17%) |
| Child Improved | |
| Yes | 36 (77%) |
| No/Did not answer | 11 (23%) |
| Child Enjoys Visits | |
| A Lot | 22 (46%) |
| Mostly | 18 (38%) |
| Somewhat | 6 (13%) |
| Not very | 1 (2%) |
| Not at all | 0 (0%) |
| Trust the Volunteer | |
| A Lot | 20 (43%) |
| Mostly | 19 (41%) |
| Somewhat | 7 (14%) |
| Not very | 1 (2%) |
| Not at all | 0 (0%) |
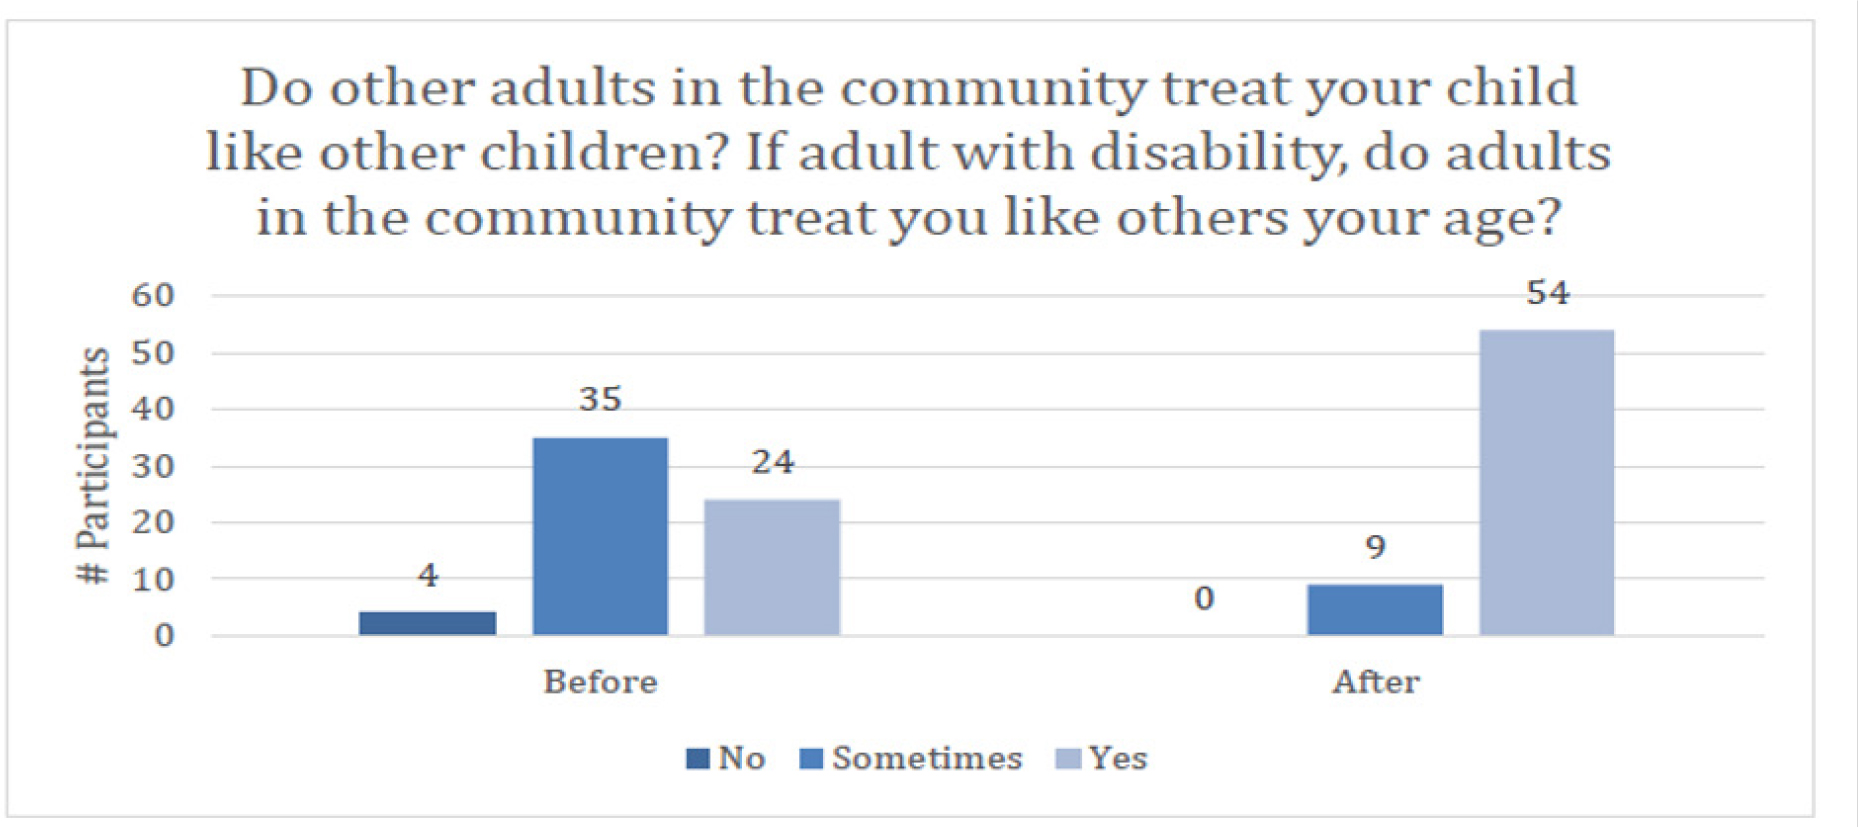
Figure 2
Social inclusion among PWDs since attending Worship at the Cross