
Introduction
Study from history of healthcare reveals that the invention of the concept for Hospital as an institution had been exported throughout the world by Christian missionaries.1 The tradition of charitable medical treatment can be traced back to the early years of Christianity when Church growth closely related to care for the sick as well as other charitable activities, such as providing foods, clothes, and home for the poor and care for widows and children.2 Charitable medical services may face challenges in providing a quality service. Despite the challenges, a majority of charitable medical services could still provide high quality care.3
Lean is a concept of removing the “Waste” throughout an organization or activity. “Waste” is defined as “any extra time, labor, capital, space, facilities, or material that does not add value to the product or service for the customer (p.5).”4 On the other hand, Six Sigma focuses on removing defects by reducing variability. The implementation of Six Sigma, most of the time, is to remove “Waste;” therefore, the term Lean Six Sigma is more common than each standing alone.4,5 Waiting and motion are the most common types of “Waste” during the process of charity activities, particularly free medical services. Most charitable activity initiators do not employ standard operating procedures for free medical services, not paying much attention to sustainable efficiency. For that reason, charity activities can fail to keep to a schedule.
A process map in Lean Six Sigma is commonly used as a diagnostic tool to determine possible bottlenecks in the system. Despite its importance as part of Quality Improvement (QI), systematic implementation and evaluation of a process map as part of initiatives for reducing “Waste” are not considered essential in healthcare practice.6 The purpose of this study is to observe the effectiveness of Lean Six Sigma in free medical services and see if there are any effects between using and not using the Lean Six Sigma process map.
Methods
This study compared pre- and post-intervention quality improvement methods. The study followed the schedule provided by the committee, whereas the service was performed in two periods of 3 hours each. The first period was the pre-intervention, and the second period was the post-intervention. The service used paper-based medical records given to the patients following their registration. There was no clear flow in the first period; therefore, some number of patients sat waiting without holding their medical record. In such cases, those patients needed to go to the registration desk for registration and their medical record paper. This process was changed in the second period of service by posting the flow map and briefing the flow procedure to the committee and volunteers of the free medical service.
The clinic started at 10:00 a.m. local time, broke for lunch at 01:00 – 02:00 p.m., then resumed until all patients were treated. After the study had been approved by the organizer, we counted the number of patients from 10:00 a.m.–01:00 p.m. for group 1 and from 02:30 p.m.–05:30 p.m. for group 2. We treated all patients who came to the free medical service even after the period of this study (after 05:30 p.m.). Following the lunch break, we changed the registration and patient flow to introduce the new system. Figure 1 shows the process map for the patient flow newly applied to the second group.
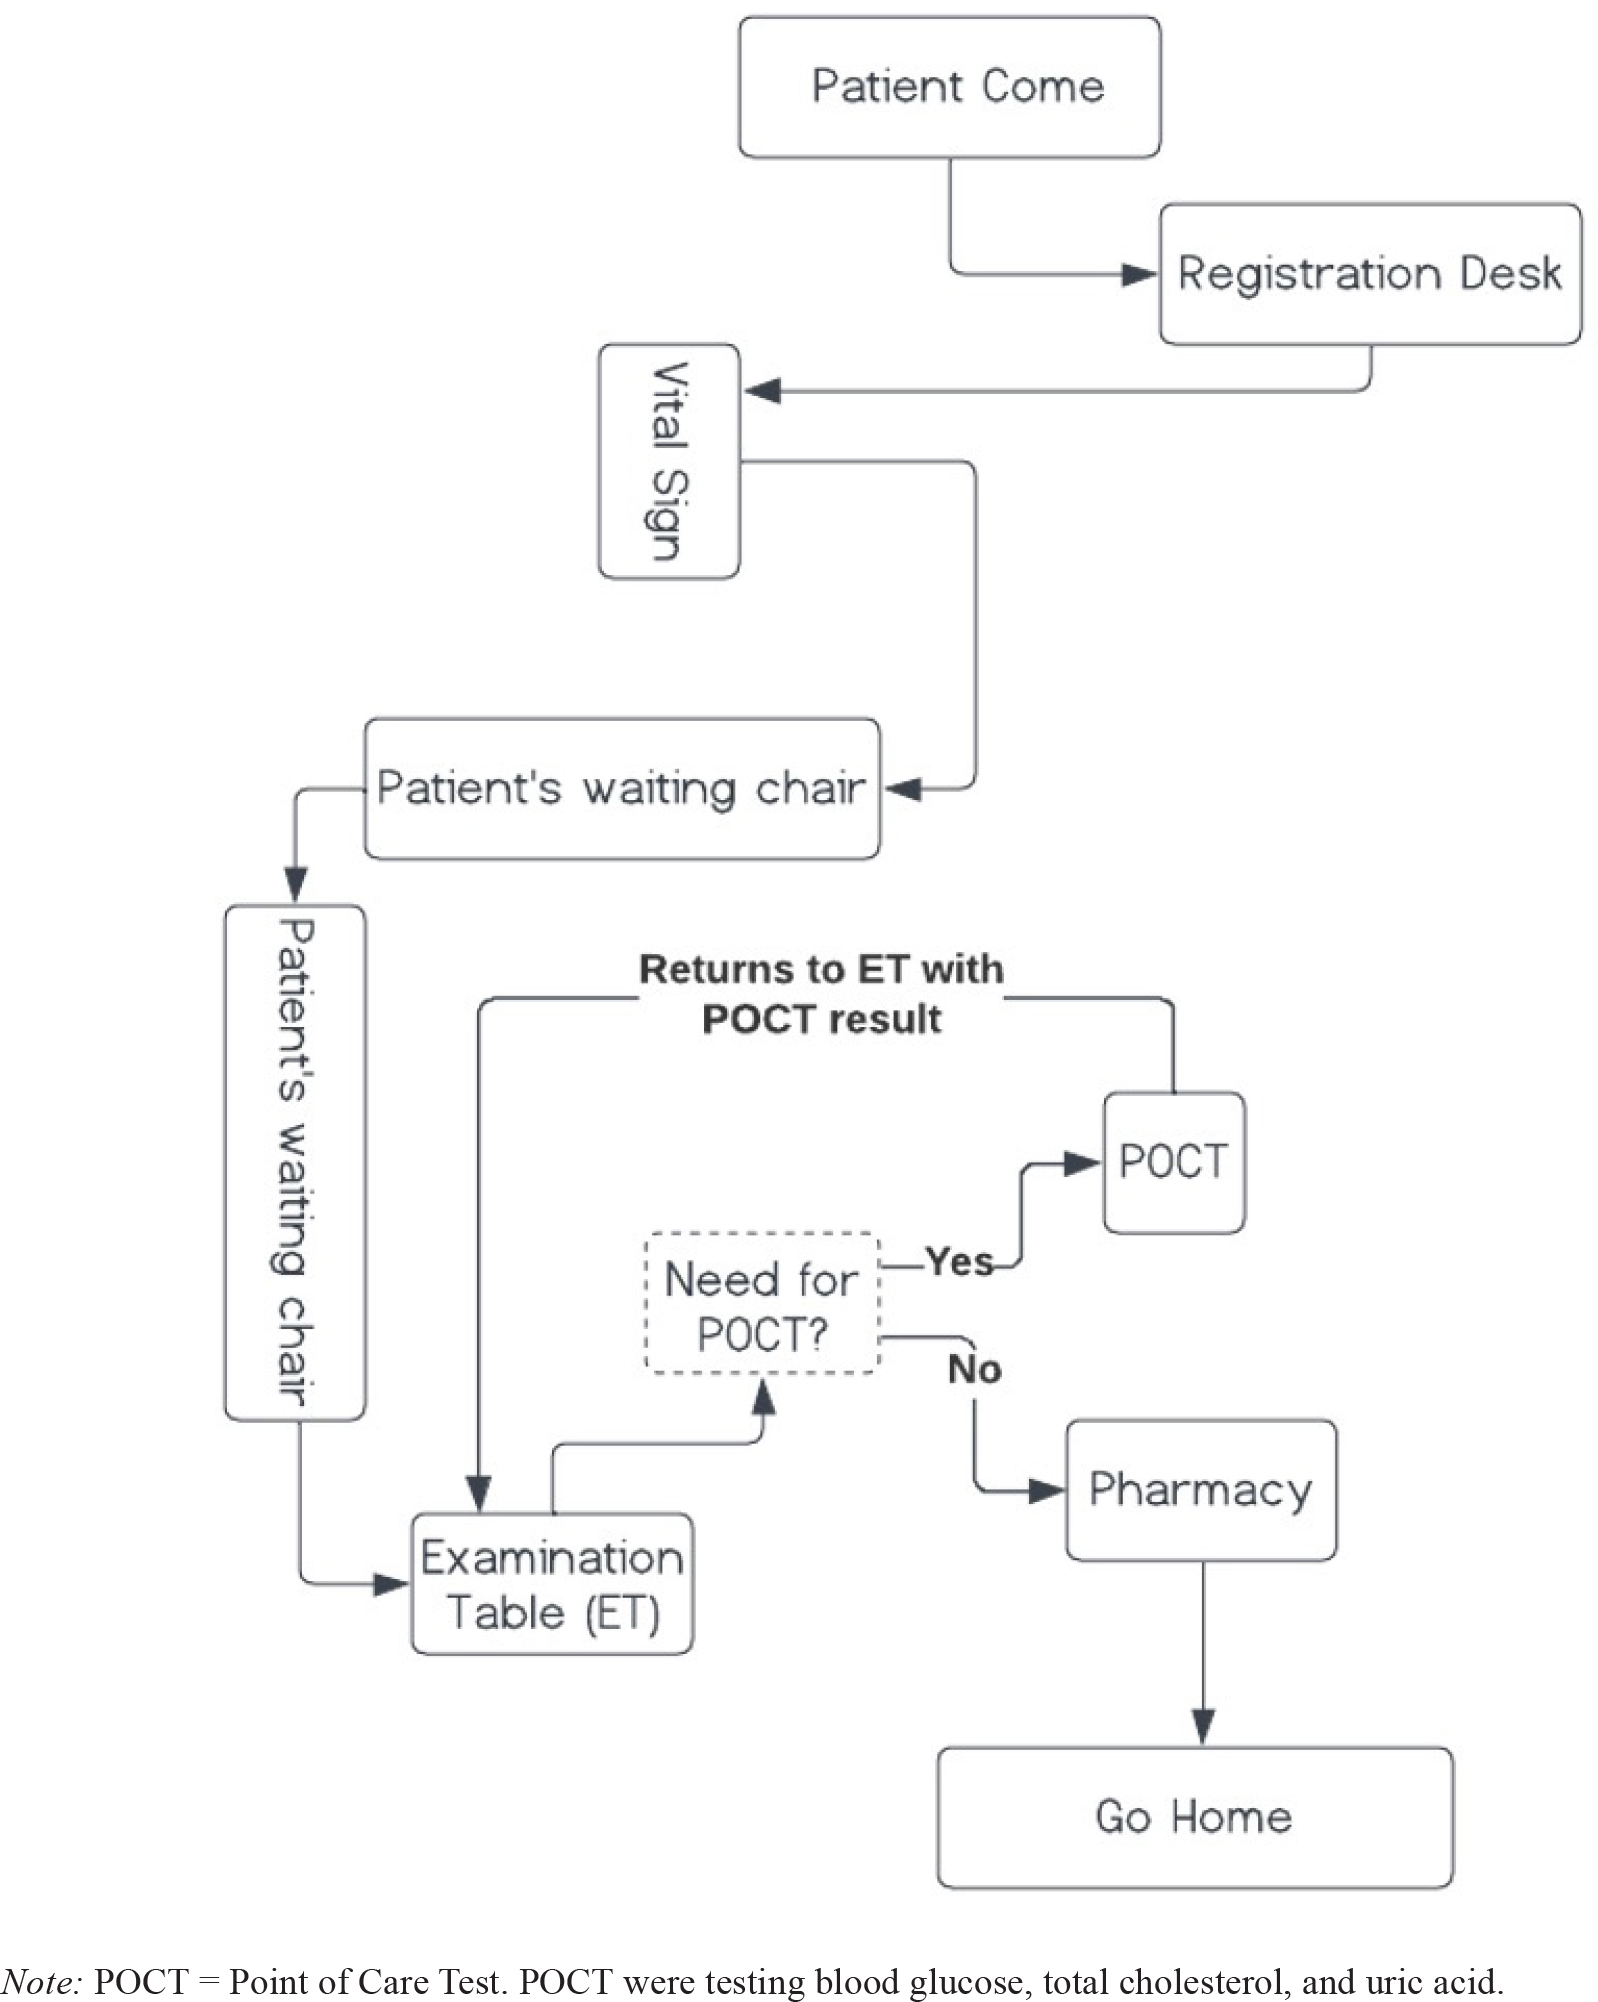
Figure 1
Process Map for The New Patient Flow.
Results
There were 159 patients total visiting during the period of this study, 96 of them female (60%). There were 50 (31%) patients who came on the first period of this study during which time the process map was not utilized. After the introduction of the process map, the number of patients that were served doubled, average patients per-hour also doubled, and average waiting time reduced to half compared to the first period. Table 1 reports the difference between the first and second period of this study.
Table 1
Number of patients, percentage, average patients (pts) per-hour, and average waiting time in each period.
| Period | No Patients | Percentage (%) | Average Pts per-Hour | Approximate Pts Waiting Time |
|---|---|---|---|---|
| I | 50 | 31 | 17 | 36 minutes |
| II | 109 | 69 | 36 | 17 minutes |
| Total | 159 | 100 | - | - |
[i] Note: Period I was when before process map introduced and Period II was after process map has been introduced. Average pts per-hour: (No. Patients) / (3 hours). Average pts Waiting Time: (Average Pts per-Hour) / (60 minutes) x 10.
Discussion
Effective time management can reduce patients’ waiting time as well as job-related stresses. Through proper training in planning, healthcare workers can waste less time.7 Patient pathway is an example of process map which can improve patient flow, reduce confusion, and help in identifying bottlenecks and constraints.8 There were more female patients than male in this activity. There is no specific explanation from previous study that determines this phenomenon. The best explanation is due to the nature of Indonesian culture; most females have roles as housewives while males work outside the home.9 Therefore, females had more free time to use the free medical service when it was conducted near their home.
Each period of study was conducted for exactly 3 hours; however, patients coming after the period were still served but not included in this study. An average of 17 patients were served per hour in the first period, mainly because of the longer transition when patients visited the doctor’s table without a medical record paper. The medical record paper was given to the patient when he/she registered. Not knowing the correct flow, most patients sat down at the patient’s waiting chairs without initially being registered.
After introduction of the process map, the number of patients seen by the doctor doubled to 109 patients with an average of 36 patients per hour. An effective process map can increase patient visits with more patients receiving care in the same amount of time. Study of Robinson et al. (2020) showed a process map reducing the cycle time from 71 to 65 minutes. This allowed patients to move directly to the next station. Cycle time reduction is meaningful in the sense of patient and staff satisfaction as well in preventing overtime and missed breaks.10 In this study, the presence of a process map increased the number of patients seen by the physician to double. The physician could take his break properly and did not have to serve the patients until late at night.
Another concern for the free medical service is patient satisfaction regarding the waiting time. We could not directly measure the waiting time of the patients, but we calculated the time from entering the waiting room until seeing the physician. The capacity of the waiting room was 10 patients, so the constant used for calculating the average waiting time was 10 (Table 1). The use of the process map enhanced patient movement and reduced the waiting time from 36 minutes to 17 minutes. Value stream map, the common terminology for process map in Six Sigma, is one of the important tools for both Lean and Six Sigma and reduced waiting time and improved patient flow.10,11 In this study, the waiting time was reduced by removing the time the examination chair was empty despite other patients still waiting in the queue. Most of this wasted time was due to registration problems such as unregistered patients already being in the examination queue or having an incorrect ticket number.
Conclusion
Improving the patient flow can reduce the waiting time of the patients as well as preventing the health workers from missing breaks and having overtime. This study supports evidence for the effectiveness of a process map in improving patient flow. The number of patients seen per hour was doubled after the introduction of a process map resulting in a significant reduction of waiting time. Therefore, we suggest every charity activity that requires flow to use a process map. It can be most effective for free medical services in the control of flow and can prevent an unnecessary waste of time.
Competing Interests
None declared