
Table 1
Modulatory effect of VC on lead residue concentration
| Organs | Control | Lead | VC | Lead + VC |
|---|---|---|---|---|
| Brain (ppm) | 0.21c±0.06 | 0.34a±0.01 | 0.16d±0.08 | 0.26b±0.04 |
| Kidney (ppm) | 0.23c±0.07 | 0.96a±0.03 | 0.22c±0.04 | 0.33b±0.06 |
| Liver (ppm) | 0.17c±0.01 | 0.30a±0.02 | 0.17c±0.04 | 0.21b±0.01 |
| Testes (ppm) | 0.22c±0.04 | 0.33a±0.01 | 0.22c±0.01 | 0.24b±0.02 |
[i] Notes. Values are presented as mean ± standard error. Means with similar case letters across the horizontal array are not significantly different at p>0.05
Table 2
Effect of VC on lead-induced toxicity on body weights and weights of organs
| Body/organ weight | Control | Lead | VC | Lead + VC |
|---|---|---|---|---|
| Pre-treatment body weight (g) | 163.43a±1.98 | 166.87a±2.65 | I65.12a±3.76 | 164.22a±3.59 |
| Post-treatment body (g) | 229.00c±8.82 | 172.55a±9.86 | 234.50d±10.12 | 180.90b±6.89 |
| Liver (g) | 7.45a ±1.02 | 7.78 a ±0.49 | 6.95a ±0.56 | 7.32a ±1.08 |
| Heart (g) | 0.75c ±0.08 | 0.50 a ±0.02 | 0.73c ±0.04 | 0.73c ±0.04 |
| Kidney (g) | 0.65a ±0.09 | 0.65 a ±0.09 | 0.65a ±0.09 | 0.65a ±0.09 |
| Lungs (g) | 1.37a ±0.04 | 1.62 a ±0.05 | 1.35a ±0.06 | 1.68a ±0.03 |
| Testes (g) | 1.10c ±0.10 | 0.68 a ±0.09 | 1.10c ±0.11 | 0.70b ±0.02 |
| Epididymes (g) | 0.35c ±0.06 | 0.18 a ±0.04 | 0.38d ±0.12 | 0.20b ±0.04 |
[i] Notes. Values are presented as mean ± standard error. Means with similar case letters are not significantly different.
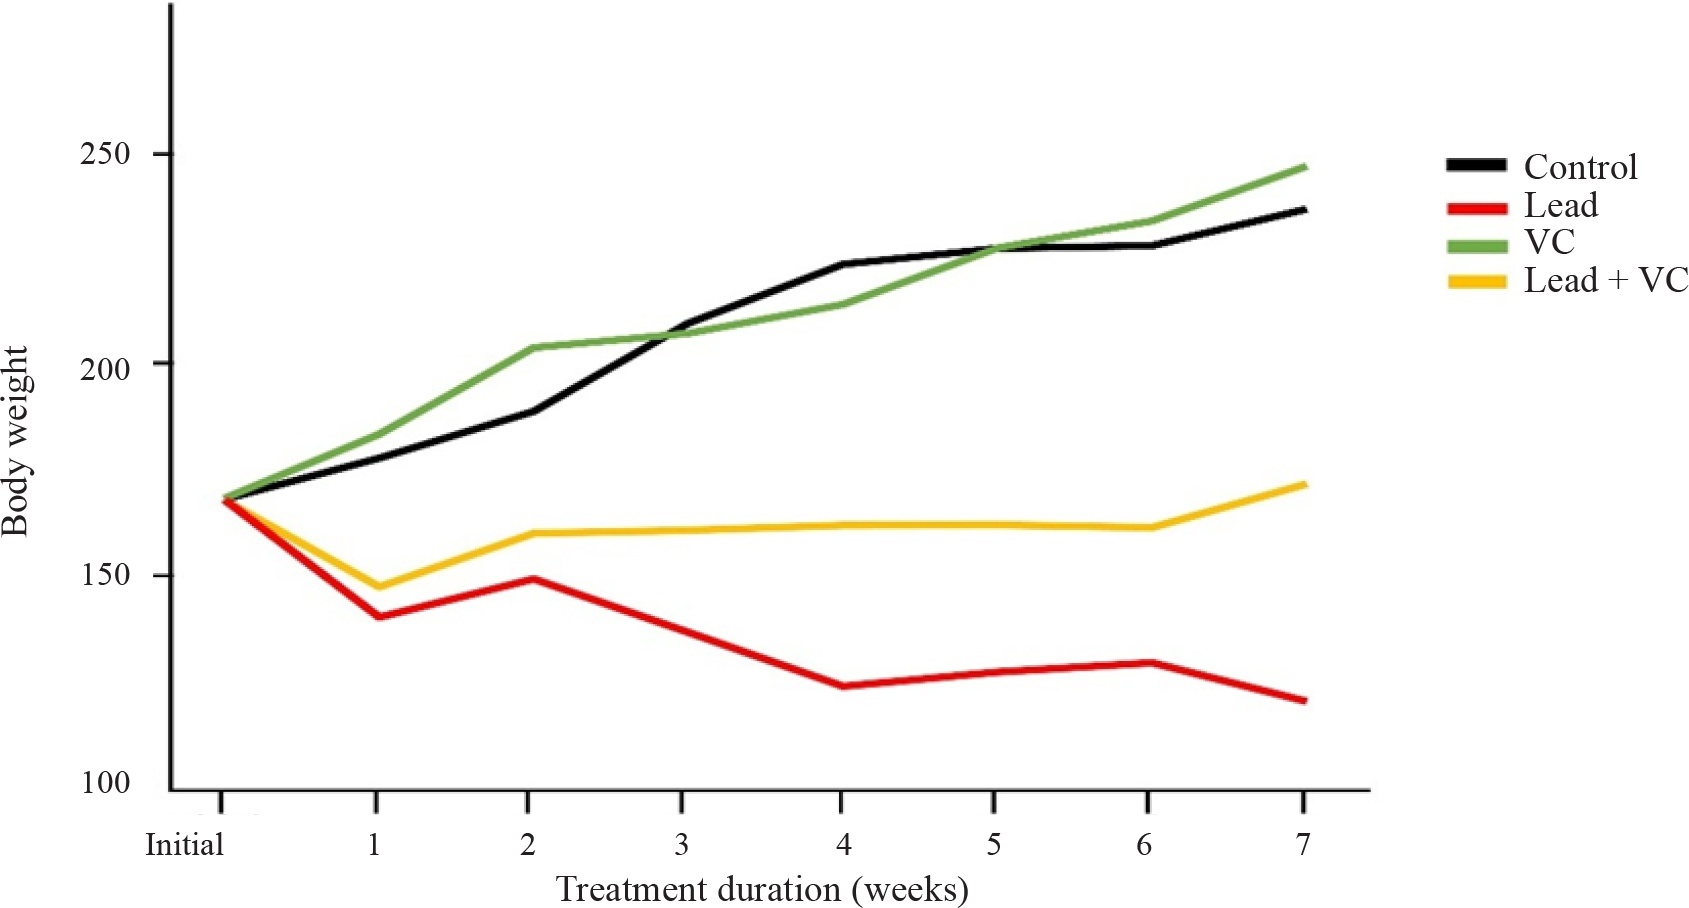
Figure 1
Effect of VC on weekly body weights of rats treated with lead
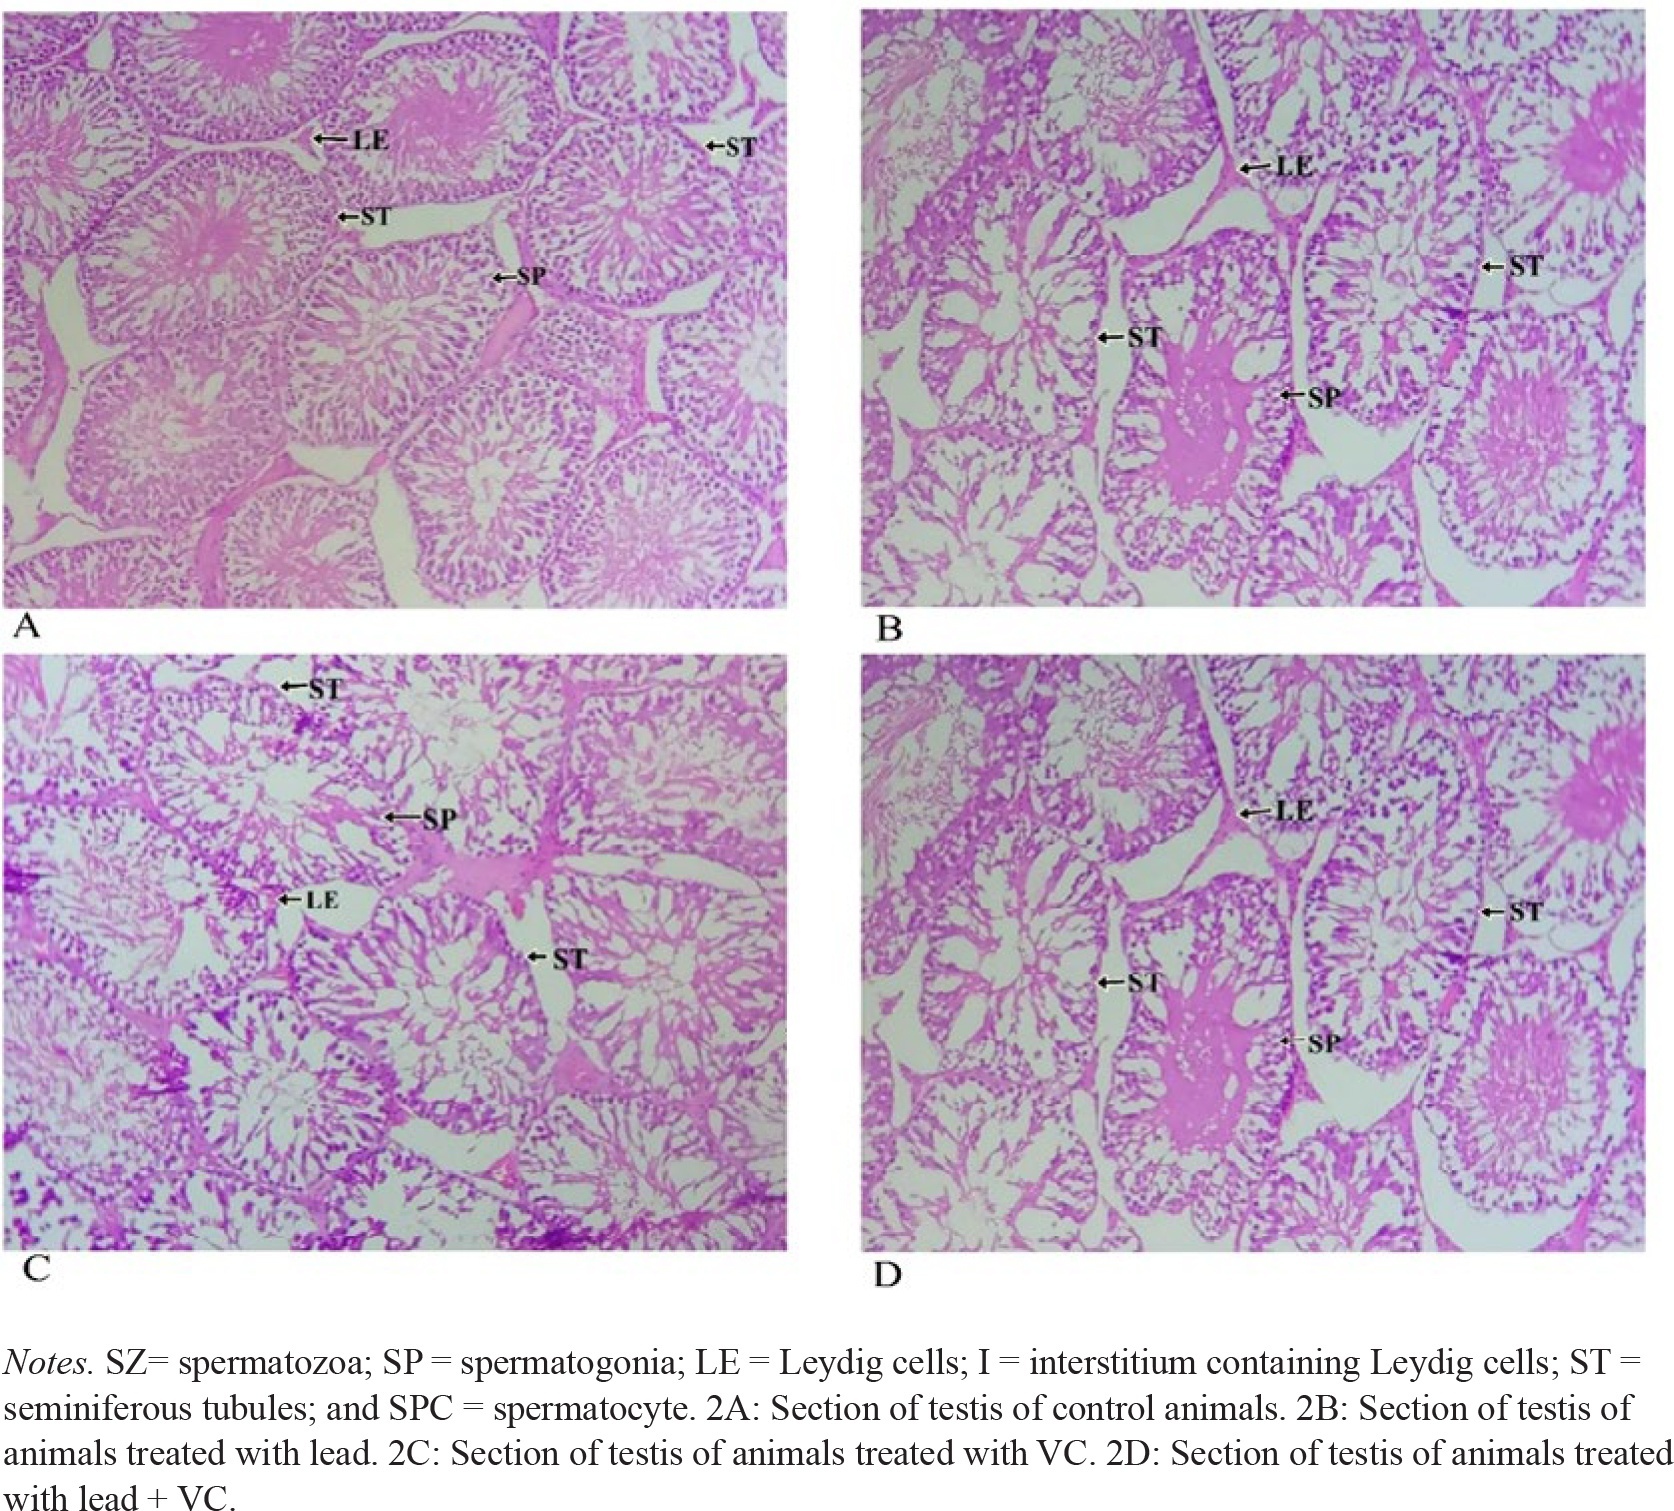
Figure 2
Modulatory effect of VC on lead-induced testicular toxicity of rats. (H&E X400)