
Fig. 1.
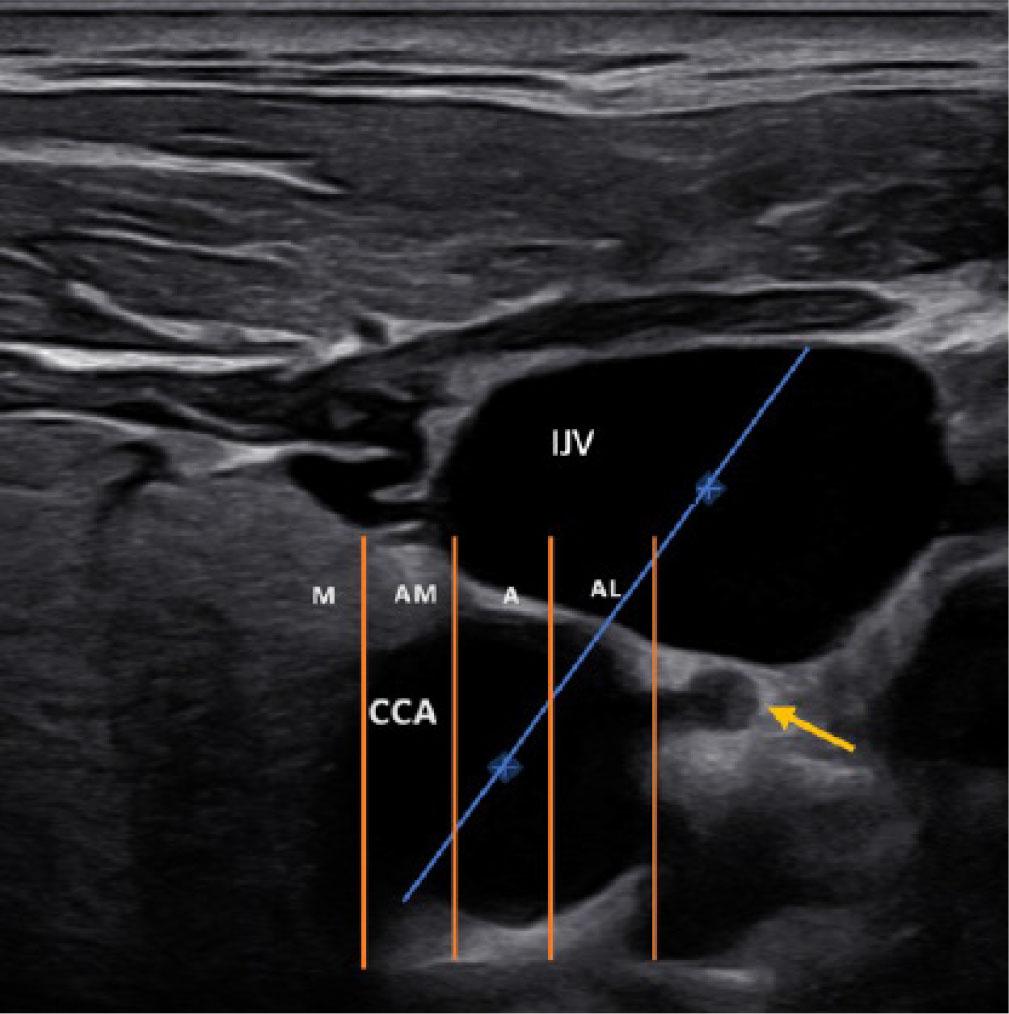
Fig. 2.

Fig. 3.
Vagus nerve variations according to patient demographics
| Variable, n (%) | No. | Variation (+) (n = 132) | Variation (−) (n = 215) | P-value |
|---|---|---|---|---|
| Sex | ||||
| Male | 103 | 48 (36.4) | 55 (25.6) | 0.033 |
| Female | 244 | 84 (63.6) | 160 (74.4) | |
| Age | ||||
| <20 | 38 | 5 (3.8) | 33 (15.3) | |
| 20–39 | 131 | 27 (20.5) | 104 (48.4) | <0.001 |
| 40–59 | 131 | 70 (53.0) | 61 (28.4) | |
| >60 | 47 | 30 (22.7) | 17 (7.9) | |
Prevalence of vagus nerve variations by side and variation characteristics
| Variable, n (%) | Right (n = 347) | Left (n = 347) | P-value |
|---|---|---|---|
| Position of the vagus nerve | |||
| Normal | 326 (94.0) | 114 (32.9) | <0.001 |
| Variation | 21 (6.0) | 233 (67.1) | |
| Types | |||
| Anterolateral | 5 (1.4) | 63 (18.1) | |
| Anteromiddle | 9 (2.6) | 114 (32.9) | 0.040 |
| Anteromedial | 3 (0.9) | 42 (12.1) | |
| Medial | 4 (1.1) | 14 (4.0) | |
| Level of variation | |||
| Variation at Level III | 8 (2.3) | 112 (32.3) | <0.001 |
| Variation at Level IV | 13 (3.7) | 121 (34.9) | |
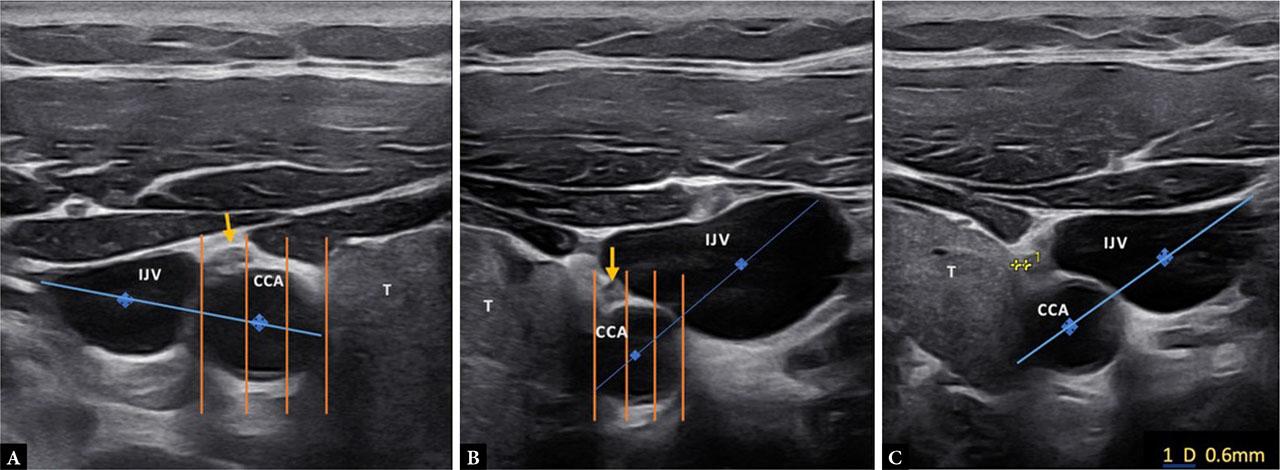
| Proximity to the thyroid gland | |||
| Significant proximity (<2 mm, including abutting) | 8 (2.3) | 61 (17.6) | |
| • Abutting thyroid gland (0 mm) | 3 (0.9) | 10 (2.9) | 0.071 |
| • Within <2 mm but not abutting | 5 (1.4) | 51 (14.7) | |
| >2 mm (safe distance) | 8 (2.3) | 109 (31.4) | |