
Fig. 1.
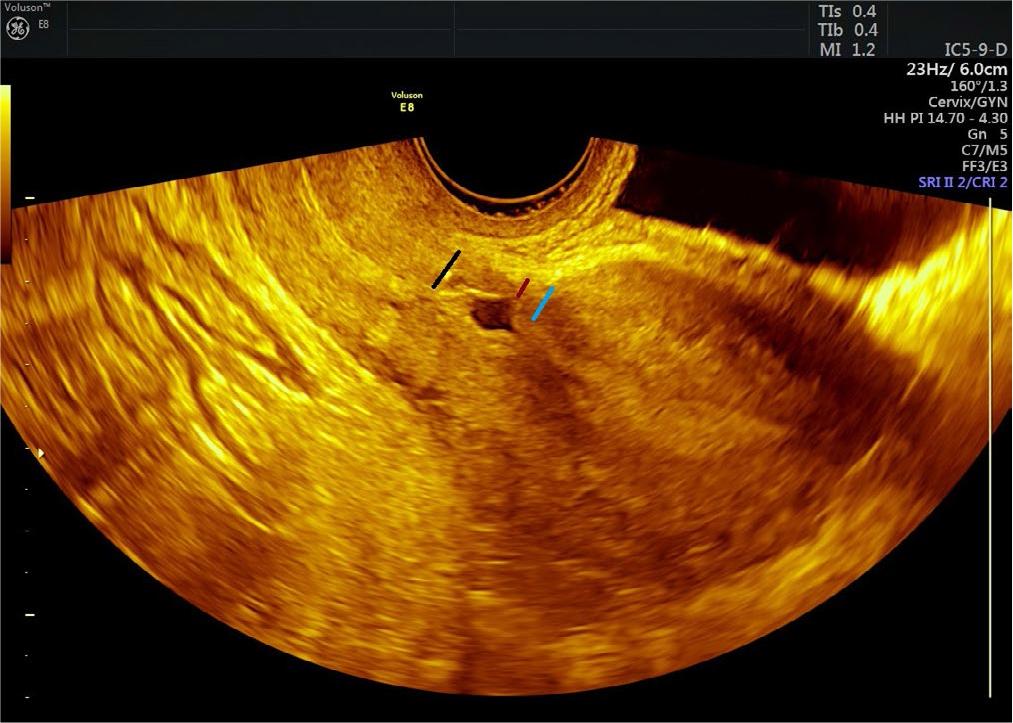
Fig. 2.
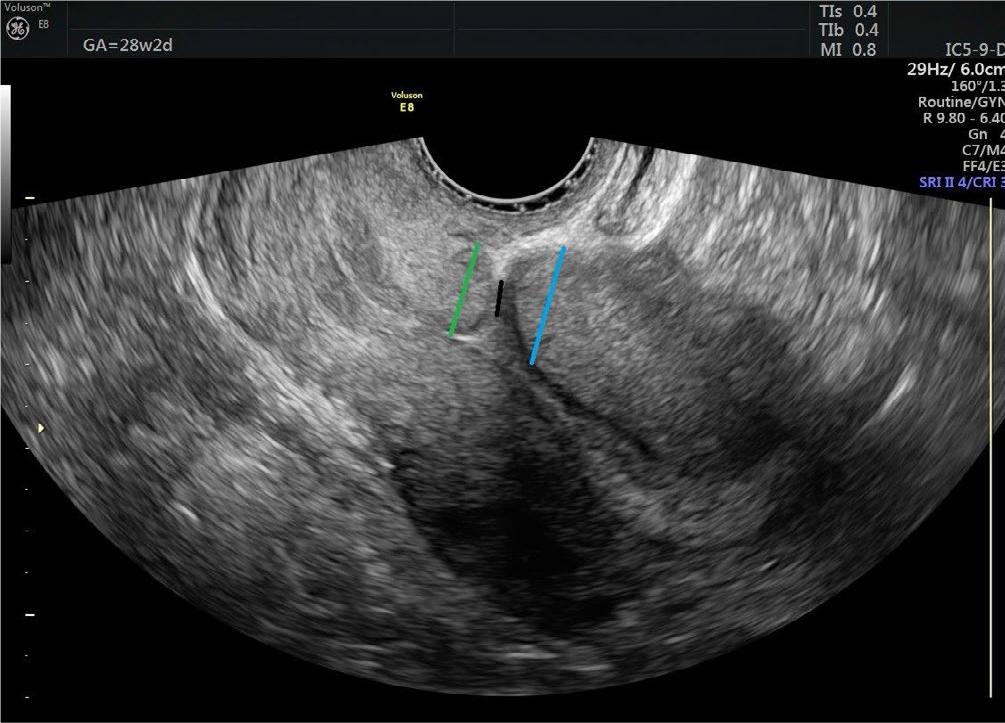
Fig. 3.
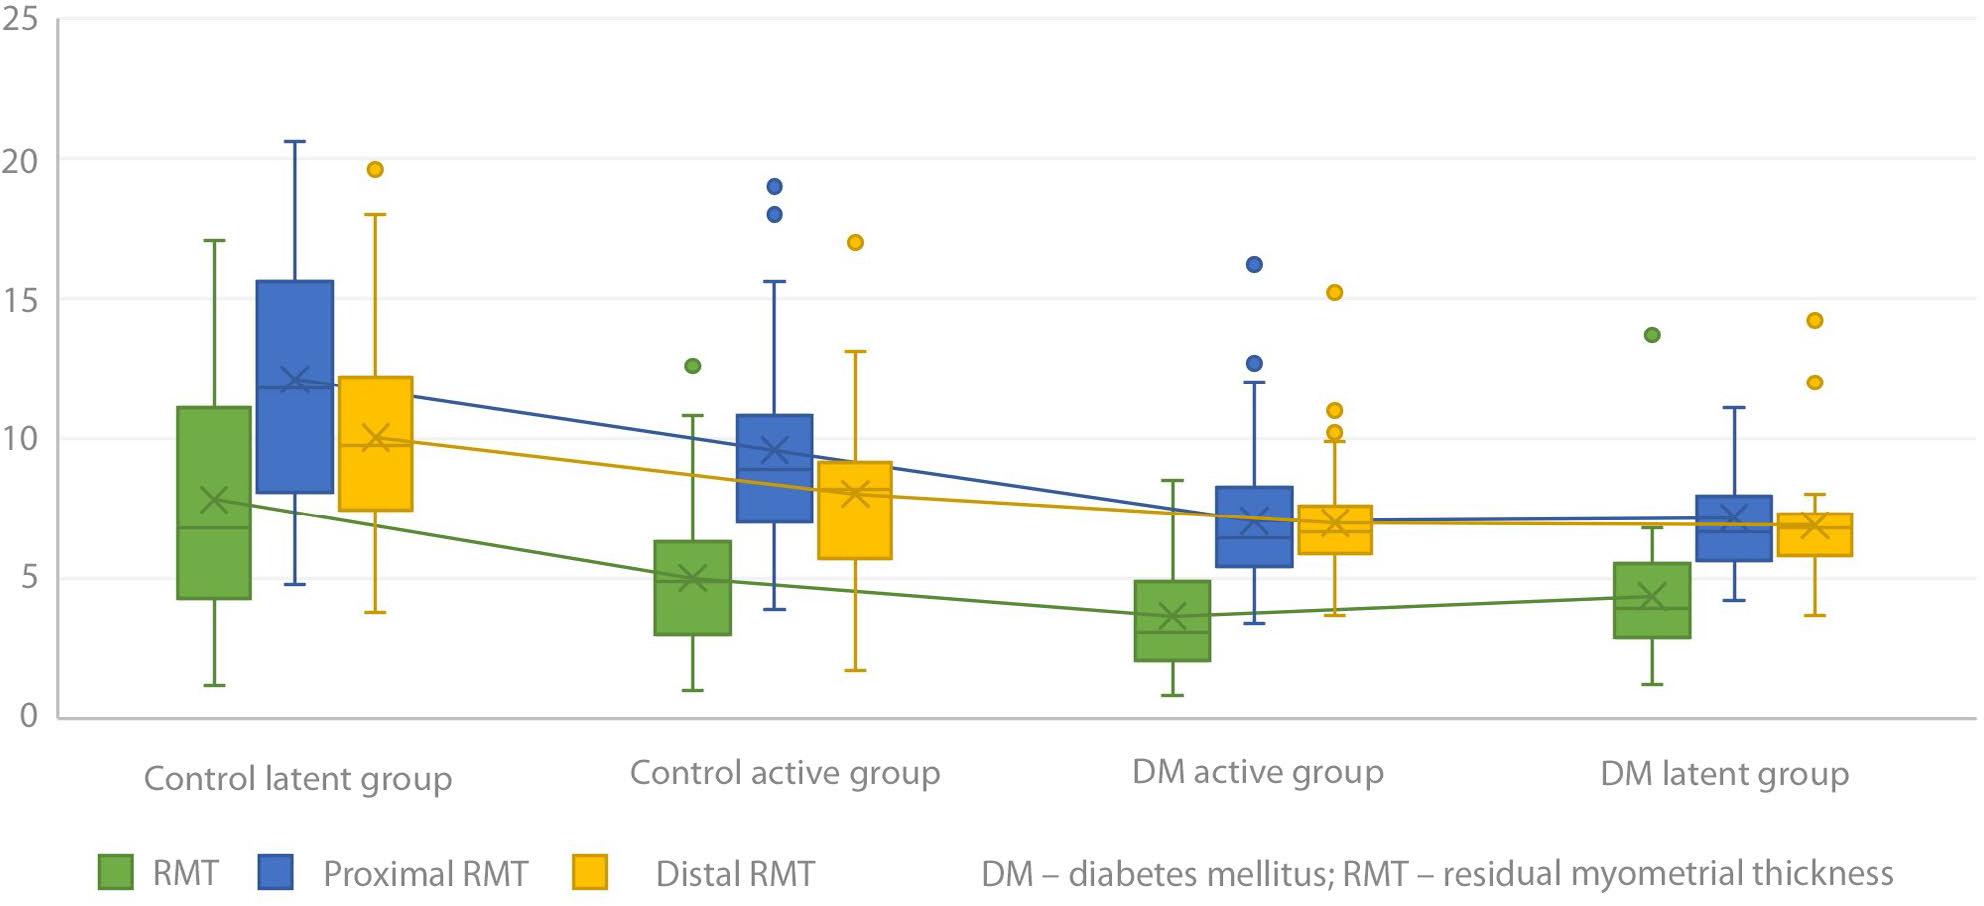
Evaluation of cesarean section area in the study group according to cervical changes
| Parameters | DM active labor (n = 29) | DM latent labor (n = 56) | Control active labor (n = 35) | Control latent labor (n = 50) | P | |
|---|---|---|---|---|---|---|
| Age | 30.03 ± 4.80 | 31.73 ± 4.70 | 27.94 ± 5.02 | 28.86 ± 6.25 | 0.005* | |
| Gestational week | 37.47 ± 2.45 | 37.36 ± 1.65 | 38.27 ± 2.46 | 37.33 ± 1.95 | 0.150* | |
| Fetal weight | 3350.41 ±739.97 | 3285.57 ±638.56 | 2835.57 ±763.50 | 2954.20 ± 663.08 | 0.002* | |
| BMI | 31.78 ± 2.41 | 32.94 ± 5.51 | 29.32 ± 5.10 | 28.24 ± 4.54 | 0.0001* | |
| Fetal position | Vertex | 29 (100%) | 54 (96.4%) | 28 (80.0%) | 43 (86.0%) | 0.011Ψ |
| Breech | 0 (0%)a | 2 (3.6%)a | 7 (20.0%)b | 7 (14.0%)a | ||
| Niche positivity | 9 (31.0%) | 18 (32.1%) | 15 (42.9%) | 17 (34.0%) | 0.712Ψ | |
| RMT | 4.35 ± 2.40 | 3.66 ± 1.95 | 5.13 ± 2.57 | 7.85 ± 4.45 | 0.0001* | |
| Proximal RMT | 7.17 ± 2.43 | 7.05 ± 2.34 | 9.65 ± 3.44 | 12.16 ± 4.31 | 0.0001* | |
| Distal RMT | 6.90 ± 2.00 | 6.98 ± 2.02 | 8.09 ± 3.04 | 10.06 ± 3.69 | 0.0001* | |
Evaluation of sociodemographic and cesarean scar characteristics of study groups
| Diabetes group (n = 85) | Control group (n = 85) | P | ||
|---|---|---|---|---|
| Maternal age (year) | 31.15 ± 4.77 | 28.48 ± 5.76 | 0.0001¥ | |
| Gestational age (week) | 37.40 ± 1.94 | 37.72 ± 2.21 | 0.315Φ | |
| BMI (kg/m2) | 32.5 ± 4.70 | 28.68 ± 4.78 | 0.0001Φ | |
| Fetal weight (gram) | 3307.69 ± 671.17 | 2905.24 ± 704.20 | 0.001¥ | |
| RMT | 3,90 ± 2,12 | 6,73 ± 4,00 | 0.0001Φ | |
| Proximal RMT | 7,09 ± 2,36 | 11,12 ± 4,14 | 0.0001Φ | |
| Distal RMT | 6,95 ± 2,00 | 9,25 ± 3,55 | 0.0001¥ | |
| Niche positivity | 27(31.8%) | 32 (37.6%) | 0.420Ψ | |
| Weight gain (kg) | 14.6 ± 8.4 | |||
| Diabetic status | GDM | 64 (75.3%) | ||
| PDM | 21 (24.7%) | |||
| Treatment method | Diet | 43 (50.6%) | ||
| Insulin | 42 (49.4%) | |||
Distribution of myometrial thicknesses according to niche presence
| DM group (n = 85) | P | Control group (n = 85) | P | |||
|---|---|---|---|---|---|---|
| Niche(+) (n = 27) | Niche(−) (n = 58) | Niche(+) (n = 32) | Niche(−) (n = 53) | |||
| RMT | 3.69 ± 2.10 | 3.99 ± 2.14 | 0.550 | 5.39 ± 3.74 | 7.53 ± 3.96 | 0.016Φ |
| Proximal RMT | 7.37 ± 2.77 | 6.95 ± 2.15 | 0.447¥ | 10.73 ± 3.43 | 11.36 ± 4.53 | 0.474Φ |
| Distal RMT | 7.23 ± 2.24 | 6.82 ± 1.88 | 0.381¥ | 8.77 ± 2.09 | 9.53 ± 4.19 | 0.265¥ |
Evaluation of cesarean scar area according to diabetes type and treatment
| PDM (n = 21) | GDM (n = 64) | P | |
|---|---|---|---|
| RMT | 4.76 ± 2.82 | 3.61 ± 1.78 | 0.032Φ |
| Proximal RMT | 7.96 ± 3.09 | 6.80 ± 2.02 | 0.118¥ |
| Distal RMT | 7.85 ± 2.68 | 6.66 ± 1.64 | 0.017Φ |
| Niche positivity | 5 (23.8%) | 22 (34.4%) | 0.367Ψ |
| Diet therapy group (n = 43) | Insulin therapy group (n = 42) | P | |
| RMT | 3.47 ± 1.50 | 4.33 ± 2.55 | 0.198¥ |
| Proximal RMT | 6.72 ± 1.71 | 7.45 ± 2.85 | 0.370¥ |
| Distal RMT | 6.82 ± 1.62 | 7.08 ± 2.33 | 0.930¥ |
| Niche positivity | 18 (41.9%) | 9 (21.4%) | 0.043Ψ |
Multivariate linear regression analysis of the effects of demographic and clinical characteristics on RMT
| Beta | SE | ß | 95 % CI | p-value | |
|---|---|---|---|---|---|
| Age | 0.019 | 0.049 | 0.030 | –0.077 – 0.116 | 0.693 |
| BMI | 0.001 | 0.054 | 0.001 | –0.107 – 0.107 | 0.997 |
| Fetal weight | 0.001 | 0.001 | –0.091 | –0.001 – 0.001 | 0.222 |
| Presence of diabetes | –2.704 | 0.557 | –0.388 | –3.803 – –1.604 | 0.001 |