
Fig. 1.
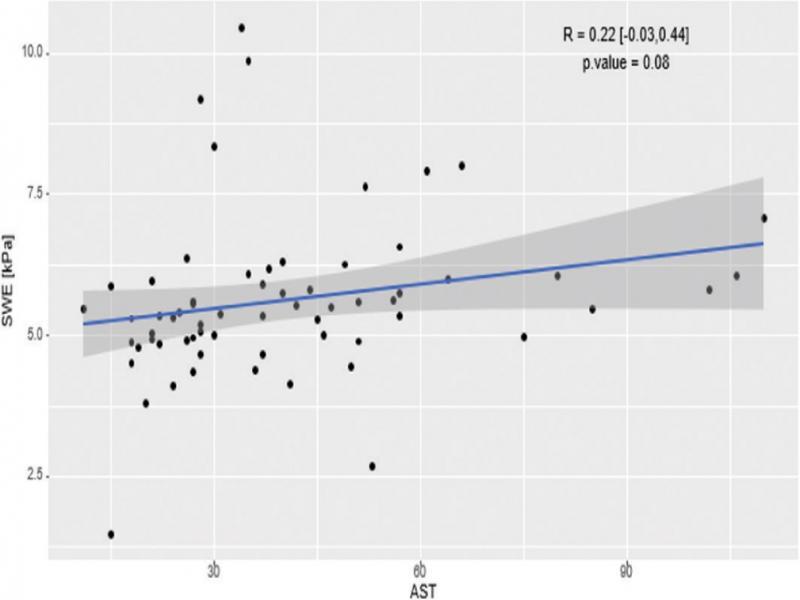
Fig. 2.

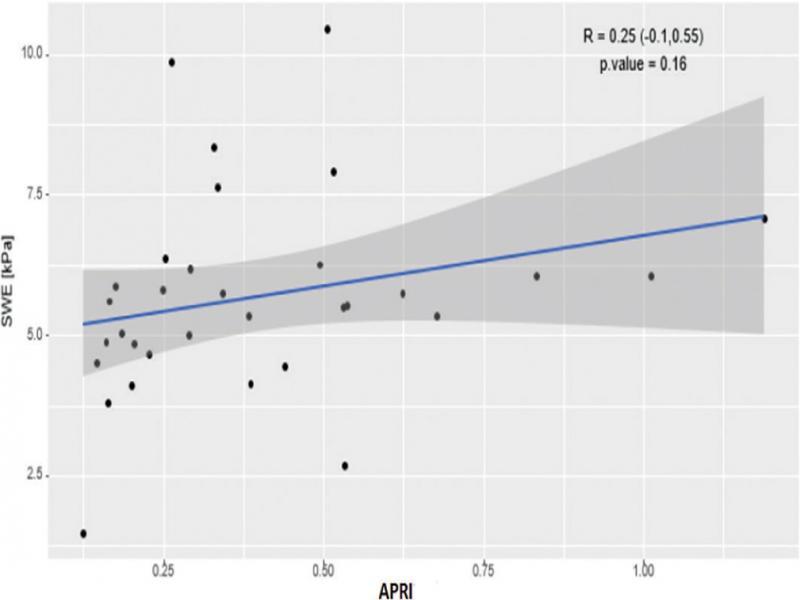
Fig. 3.
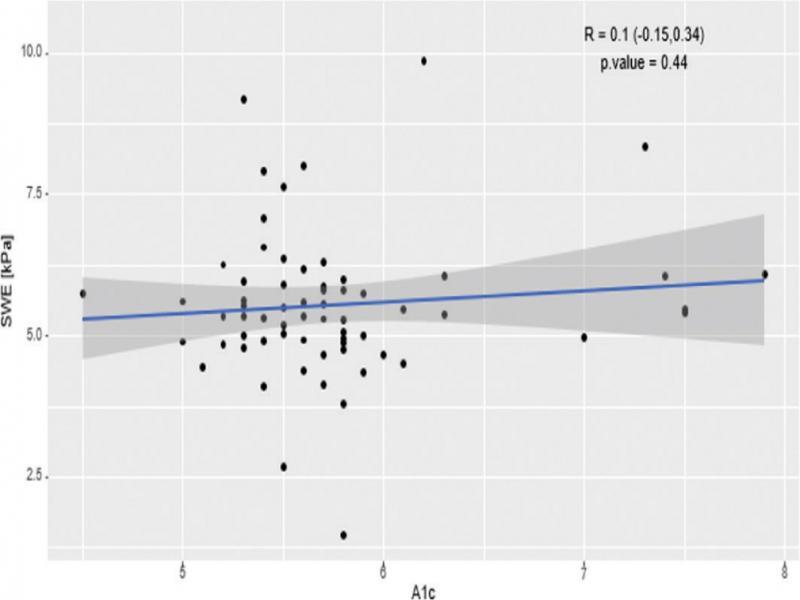
Fig. 4.
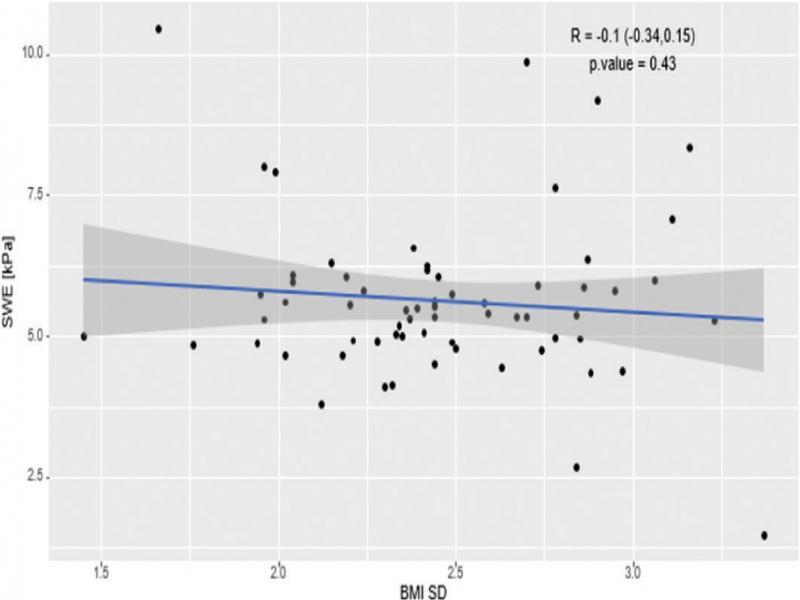
Fig. 5.
Demographic and laboratory features of patients stratified by A1c
| Entire cohort N = 67 | Group C | Group D |
P = for Group C | |
|---|---|---|---|---|
| Age (yr) | 13.59 | 12.97 | 14.25 | 0.087 |
| Gender | Male = 35 | Males = 18 | Males = 17 | 0.529 |
| BMI SDS | 2.49 ± 0.39 | 2.39 ± 0.38 | 2.53 ± 0.40 | 0.169 |
| Serum ALT (U/L) | 78.48 ± 44.75 | 82.41 ± 45.63 | 74.16 ± 44.10 | 0.462 |
| Serum AST (U/L) | 40.1 ± 22.1 | 40.09 ± 18.54 | 40.13 ± 25.74 | 0.994 |
| A1c (%) | 5.77 ± 0.64 | 5.36 ± 0.23 | 6.19 ± 0.66 | <0.001 |
| SWE Score (kPa) | 5.61 ± 1.43 | 5.82 ± 1.48 | 5.39 ± 1.36 | 0.233 |
| HOMA-IR | 10.62 ± 10.19 | 10.49 ± 12.04 | 10.84 ± 6.47 | 0.940 |
| Vitamin D, 25OH (ng/mL) | 14.23 ± 5.44 | 11.80 ± 4.18 | 15.75 ± 5.65 | 0.025 |
| Platelets (× 109 per liter) | 310 ± 75.50 | 299.89 ± 66.38 | 326.46 ± 76.01 | 0.303 |
| APRI | 0.40 ± 0.25 | 0.42 ± 0.24 | 0.36 ± (0.28) | 0.494 |
| Metformin users | 8 | 1 patient | 7 patients | 0.016 |
Demographic and laboratory features of patients with (SWE Score >5_10 kPa) and without (SWE Score <5_1 kPa) suspected hepatic fibrosis
| Entire cohort N = 67 | Group A | Group B |
P = for Group A | |
|---|---|---|---|---|
| Age (yr) | 13.59 | 13.12 ± 2.80 | 13.88 ± 3.10 | 0.328 |
| Gender | Male = 35 | Male = 15 | Male = 20 | 0.326 |
| BMI SDS | 2.49 ± 0.39 | 2.42 ± 0.40 | 2.48 ± 0.38 | 0.603 |
| Serum ALT (U/L) | 78.48 ± 44.75 | 60.04 U/L ± 41.01 | 89.27 U/L ± 43.75 | 0.010 |
| Serum AST (U/L) | 40.1 ± 22.1 | 31.12 U/L ± 14.92 | 45.37 U/L ± 23.99 | 0.011 |
| A1c (%) | 5.77 ± 0.64 | 5.71 ± 074 | 5.80 ± 0.74 | 0.557 |
| SWE Score (kPa) | 5.61 ±1.43 | 4.47 ±0.83 | 6.28 ± 1.28 | <0.001 |
| HOMA-IR | 10.62 ± 10.19 | 14.25 ± 14.85 | 8.55 ± 4.36 | 0.215 |
| Vitamin D, 25OH (ng/mL) | 14.23 ± 5.44 | 14.60 ± 5.42 | 14.00 ± 5.55 | 0.742 |
| Platelets (× 109 per liter) | 310 ± 75.50 | 325.67 ± 45.40 | 301.70 ± 81.79 | 0.360 |
| APRI | 0.40 ± 0.25 | 0.25± 0.13 | 0.49 ± 0.27 | 0.011 |
| Metformin users | 8 | 2 patients | 6 patients | 0.442 |
Demographic and laboratory features of patients who underwent liver biopsy
| Subjects with liver biopsy N = 5 | |
|---|---|
| Age (yr) | 14.00 (8–17) |
| Fibrosis stage | Stage 1= 4 patients |
| Gender | Male = 3 |
| BMI SDS | 2.44 ± 0.55 (1.66–3.11) |
| Serum ALT (U/L) | 133.20 ± 49.70 (86–189) |
| Serum AST (U/l) | 76.40 ± 33.20 (34–110) |
| A1c (%) | 6.15 ± 0.93 (5.4–7.4) |
| SWE score (kPa) | 7.45 ± 1.43 (6.05–10.45) |
| Vitamin D 25OH (ng/mL) | 9.75 ± 2.22 (9–13) |
| Platelets (× 109 per liter) | 277.10 ± 76.07 (187–431) |
| AST/PLT ratio | 0.64 ± 0.41 (0.33–1.52) |
| Metformin users | N = 2 |