
Fig. 1
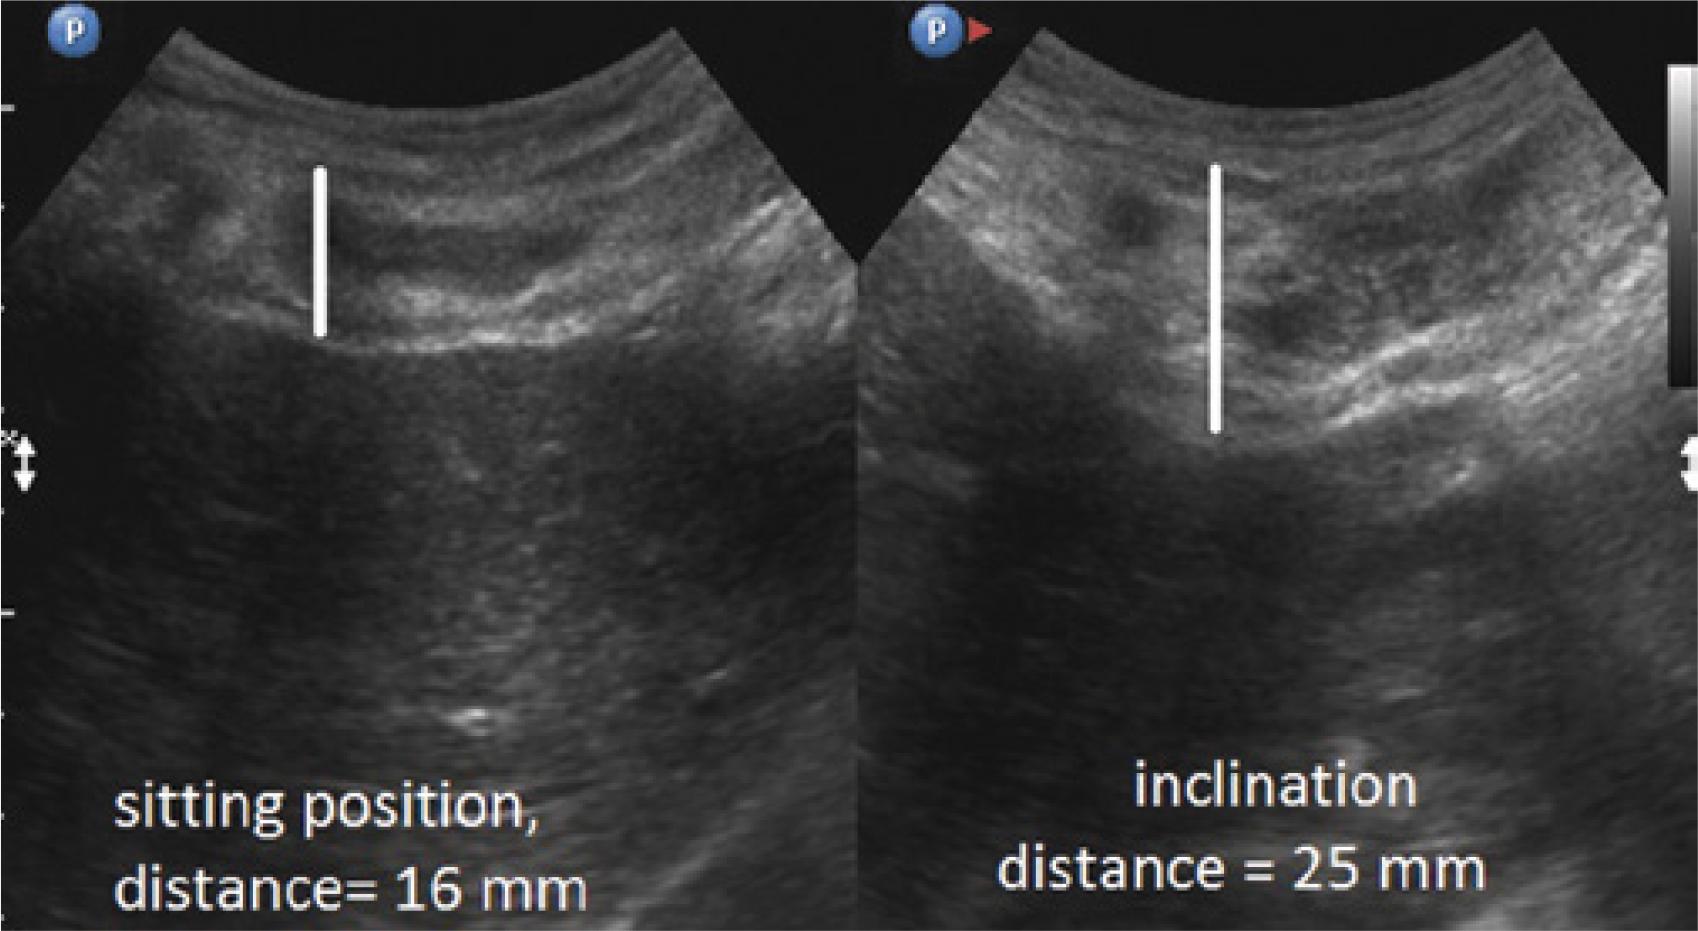
Fig. 2
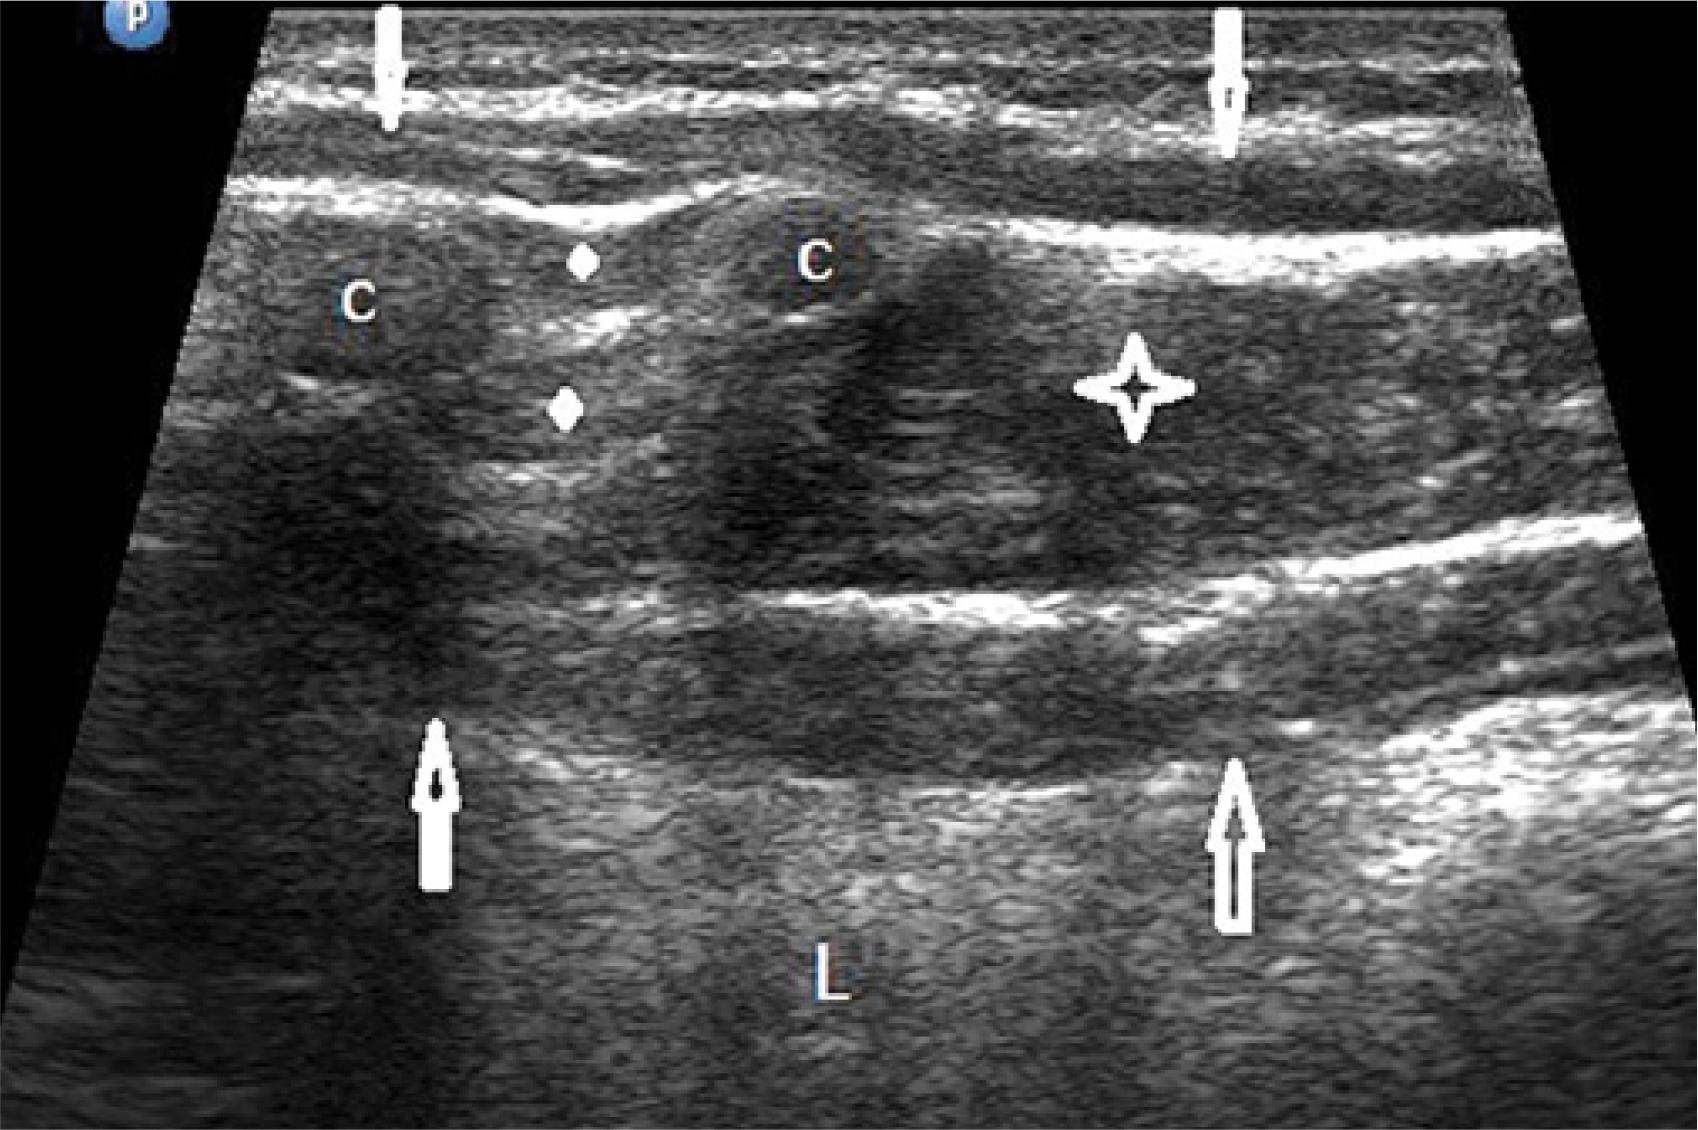
Fig. 3
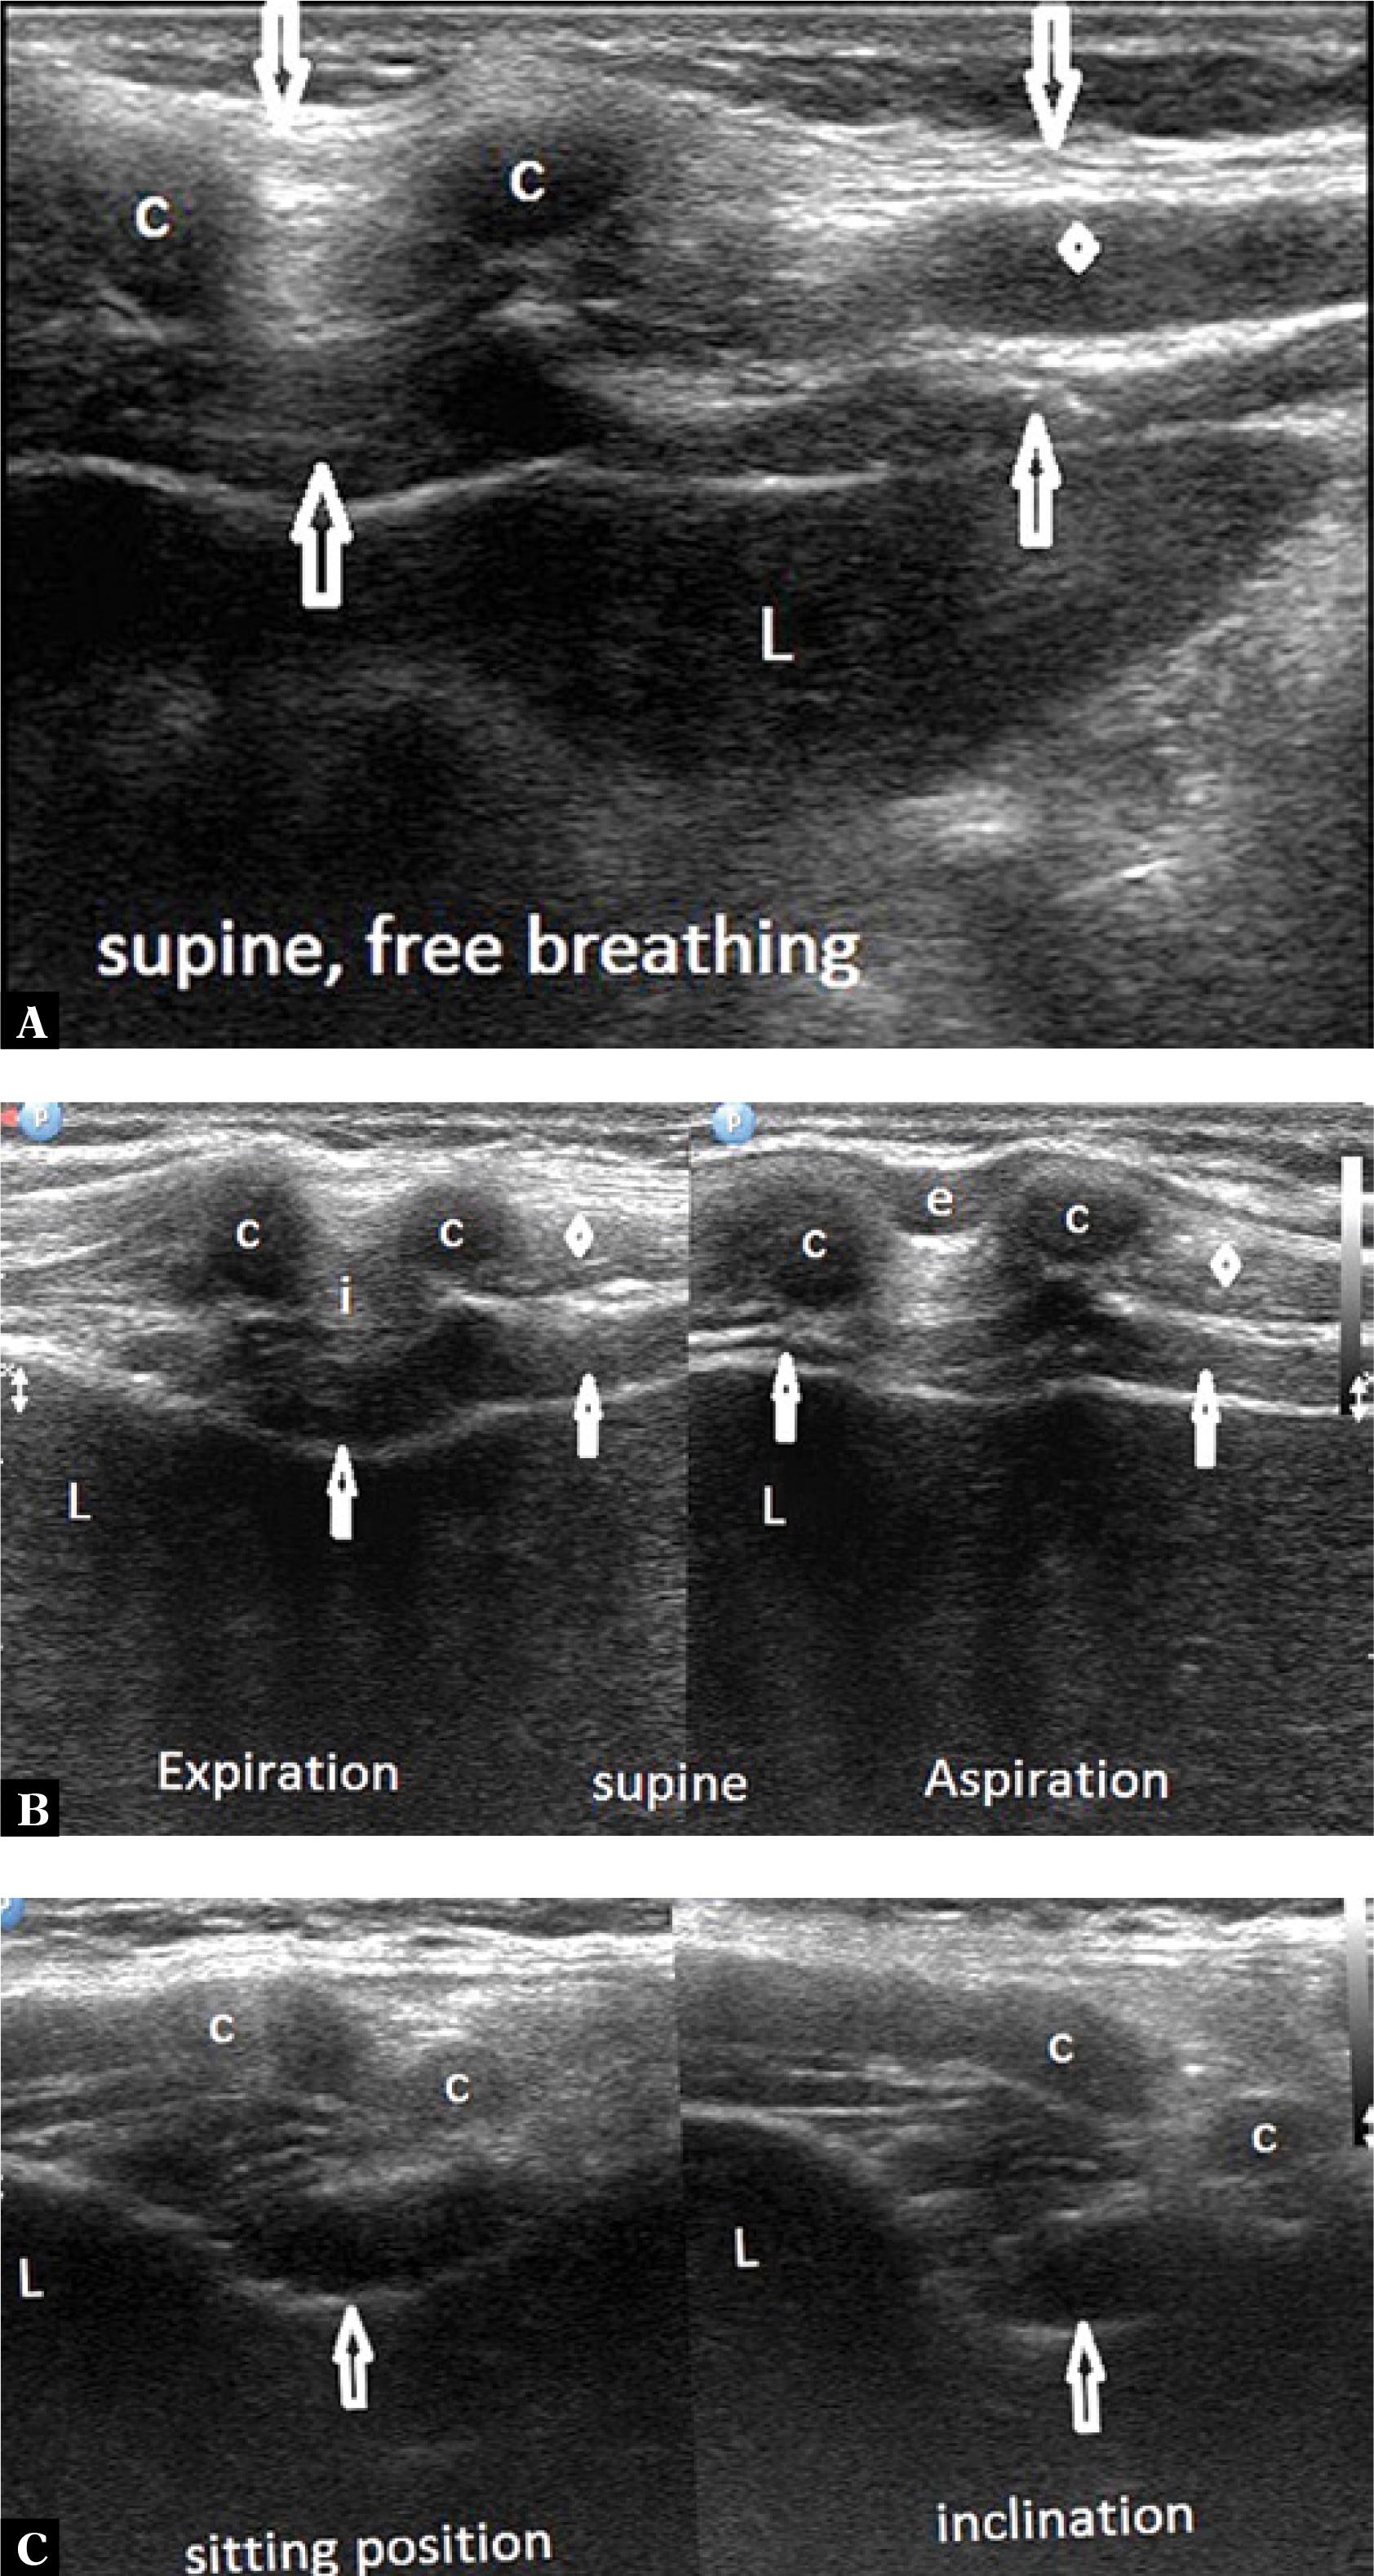
Fig. 4
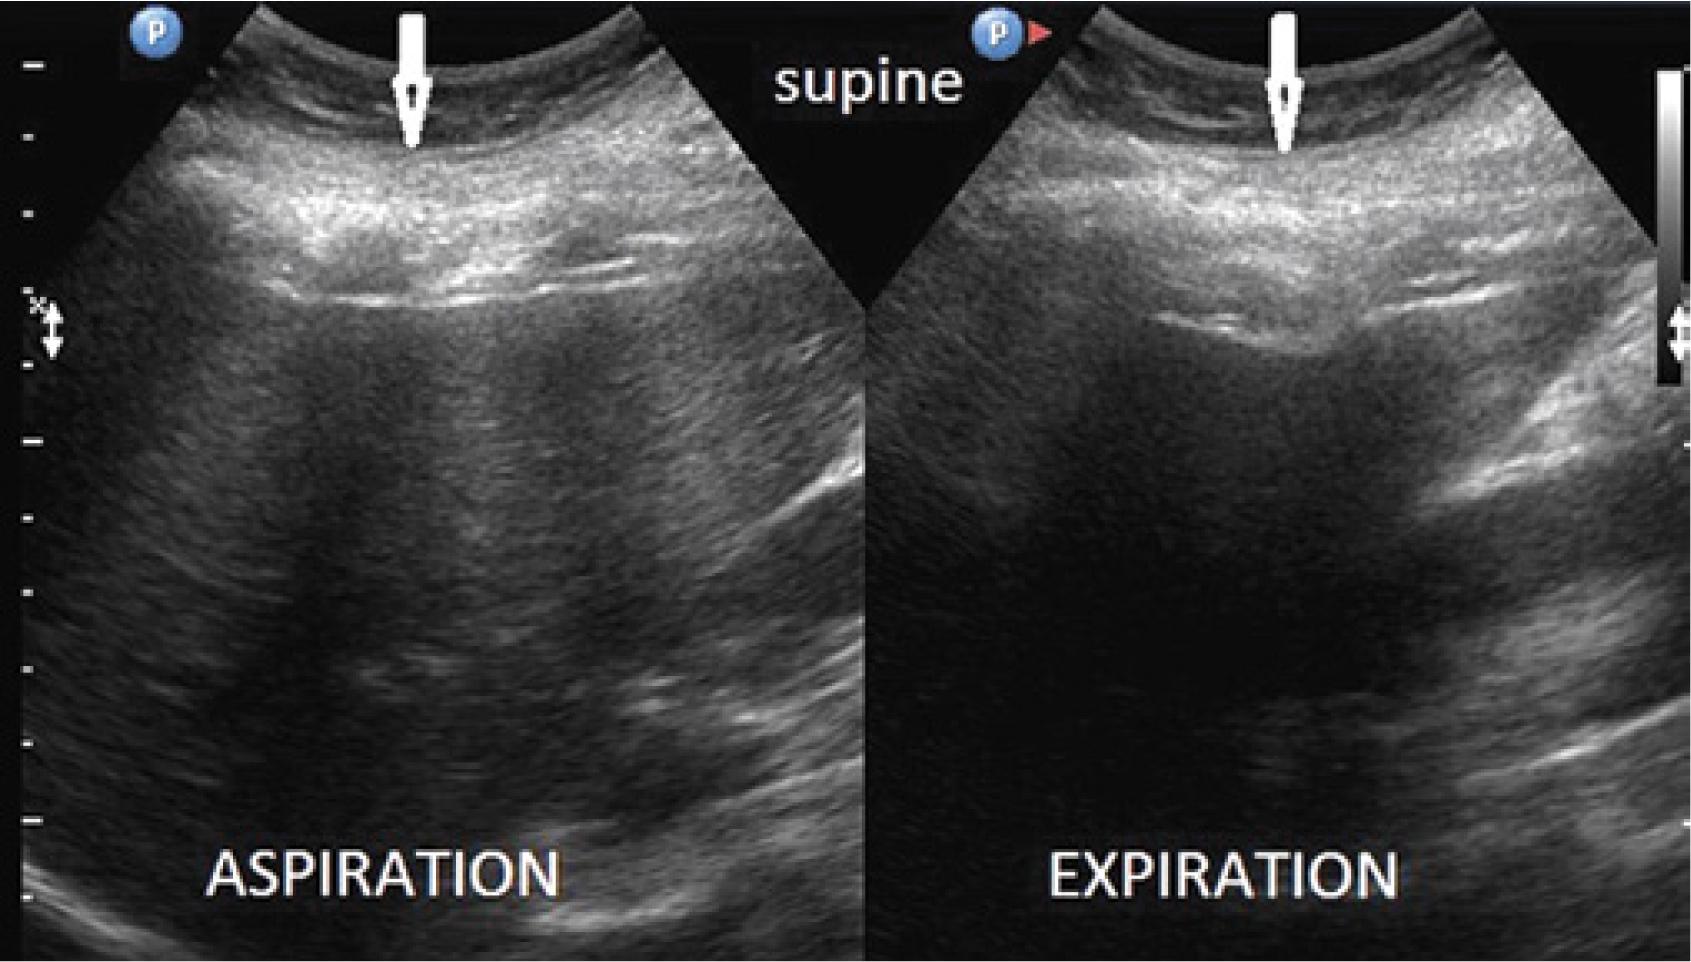
Fig. 5
Fig. 6
Fig. 7
Fig. 8
Fig. 9
Fig. 10
Comparison of the thickness of the musculocartilaginous complex during inhalation, exhalation, supine position, sitting position and forward trunk flexion in 178 patients
| Feature | Thickness range | Mean SD | Feature | Thickness range | Mean SD |
|---|---|---|---|---|---|
| Inhalation | 11–28 mm | 14.5 mm +/− 2.4 | Exhalation | 12–40 mm | 21.5 mm +/− 3.3 |
| Sitting | 11–31 mm | 17.0 mm +/− 2.9 | Flexion | 20–40 mm | 25.4 mm +/− 3.5 |
Ultrasonographic characteristics of the musculocartilaginous complex in 182 patients
| Feature | Number of patients | Percentage |
|---|---|---|
| Heterogeneous | 121 | 66.5 |
| Hypoechoic | 35 | 19.2 |
| Hyperechoic | 26 | 14.3 |
| Smooth outline of indentation | 182 | 100.0 |
| Broad base of the costal arch | 182 | 100.0 |
| Focal costal compression | 152 | 83.5 |
| Segmental costal compression | 30 | 16.5 |
Summary of statistical data on the thickness of the musculocartilaginous complex at different testing stages in 178 patients
| Stage | Mean | Stage | Mean |
|---|---|---|---|
| Inhalation | 14.5 mm | Exhalation | 21.5 mm |
| Inhalation | 14.5 mm | Sitting | 17.0 mm |
| Inhalation | 14.5 mm | Flexion | 25.4 mm |
| Exhalation | 21.5 mm | Sitting | 17.0 mm |
| Inhalation | 21.5 mm | Flexion | 25.4 mm |
| Sitting | 17.0 mm | Flexion | 25.4 mm |