
Fig. 1
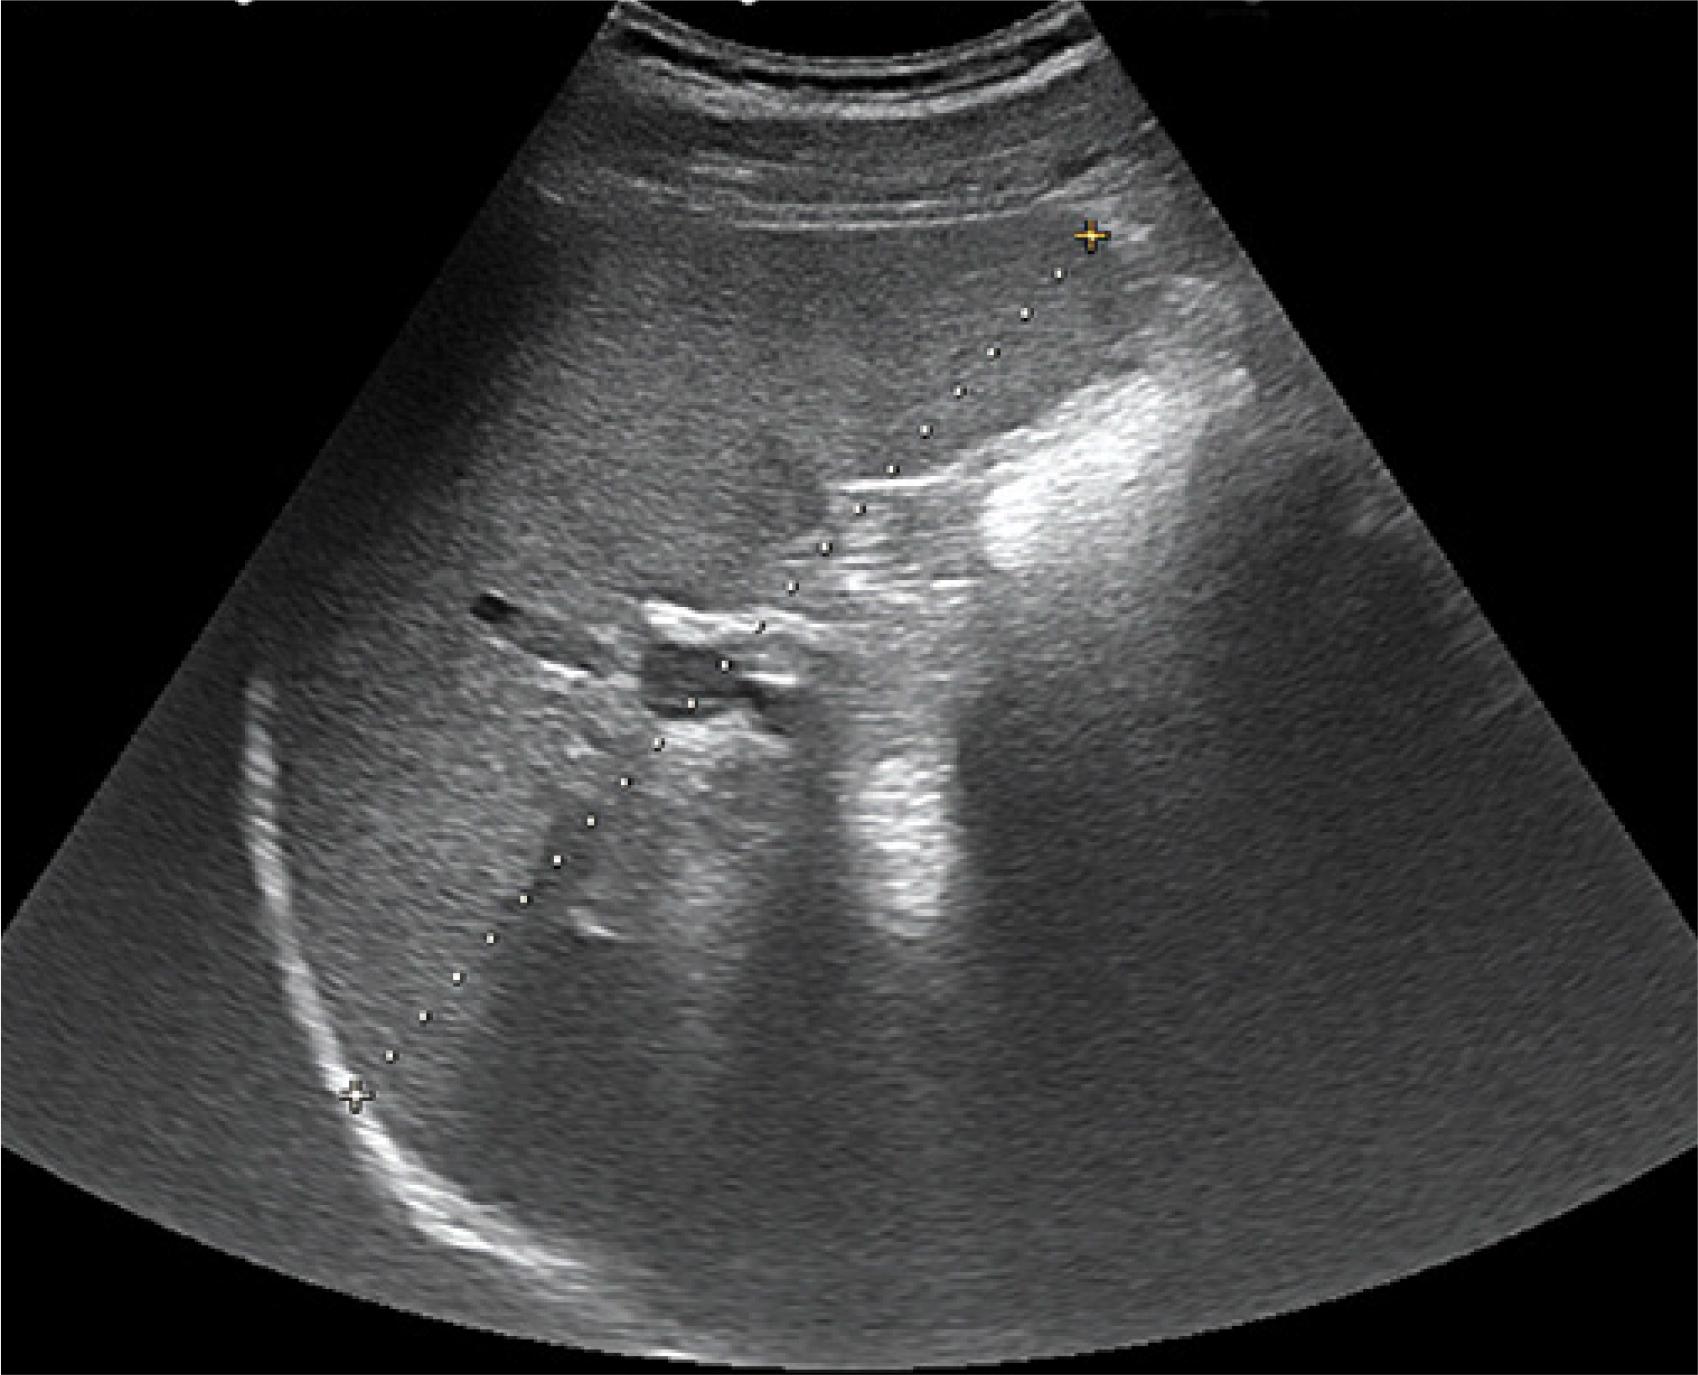
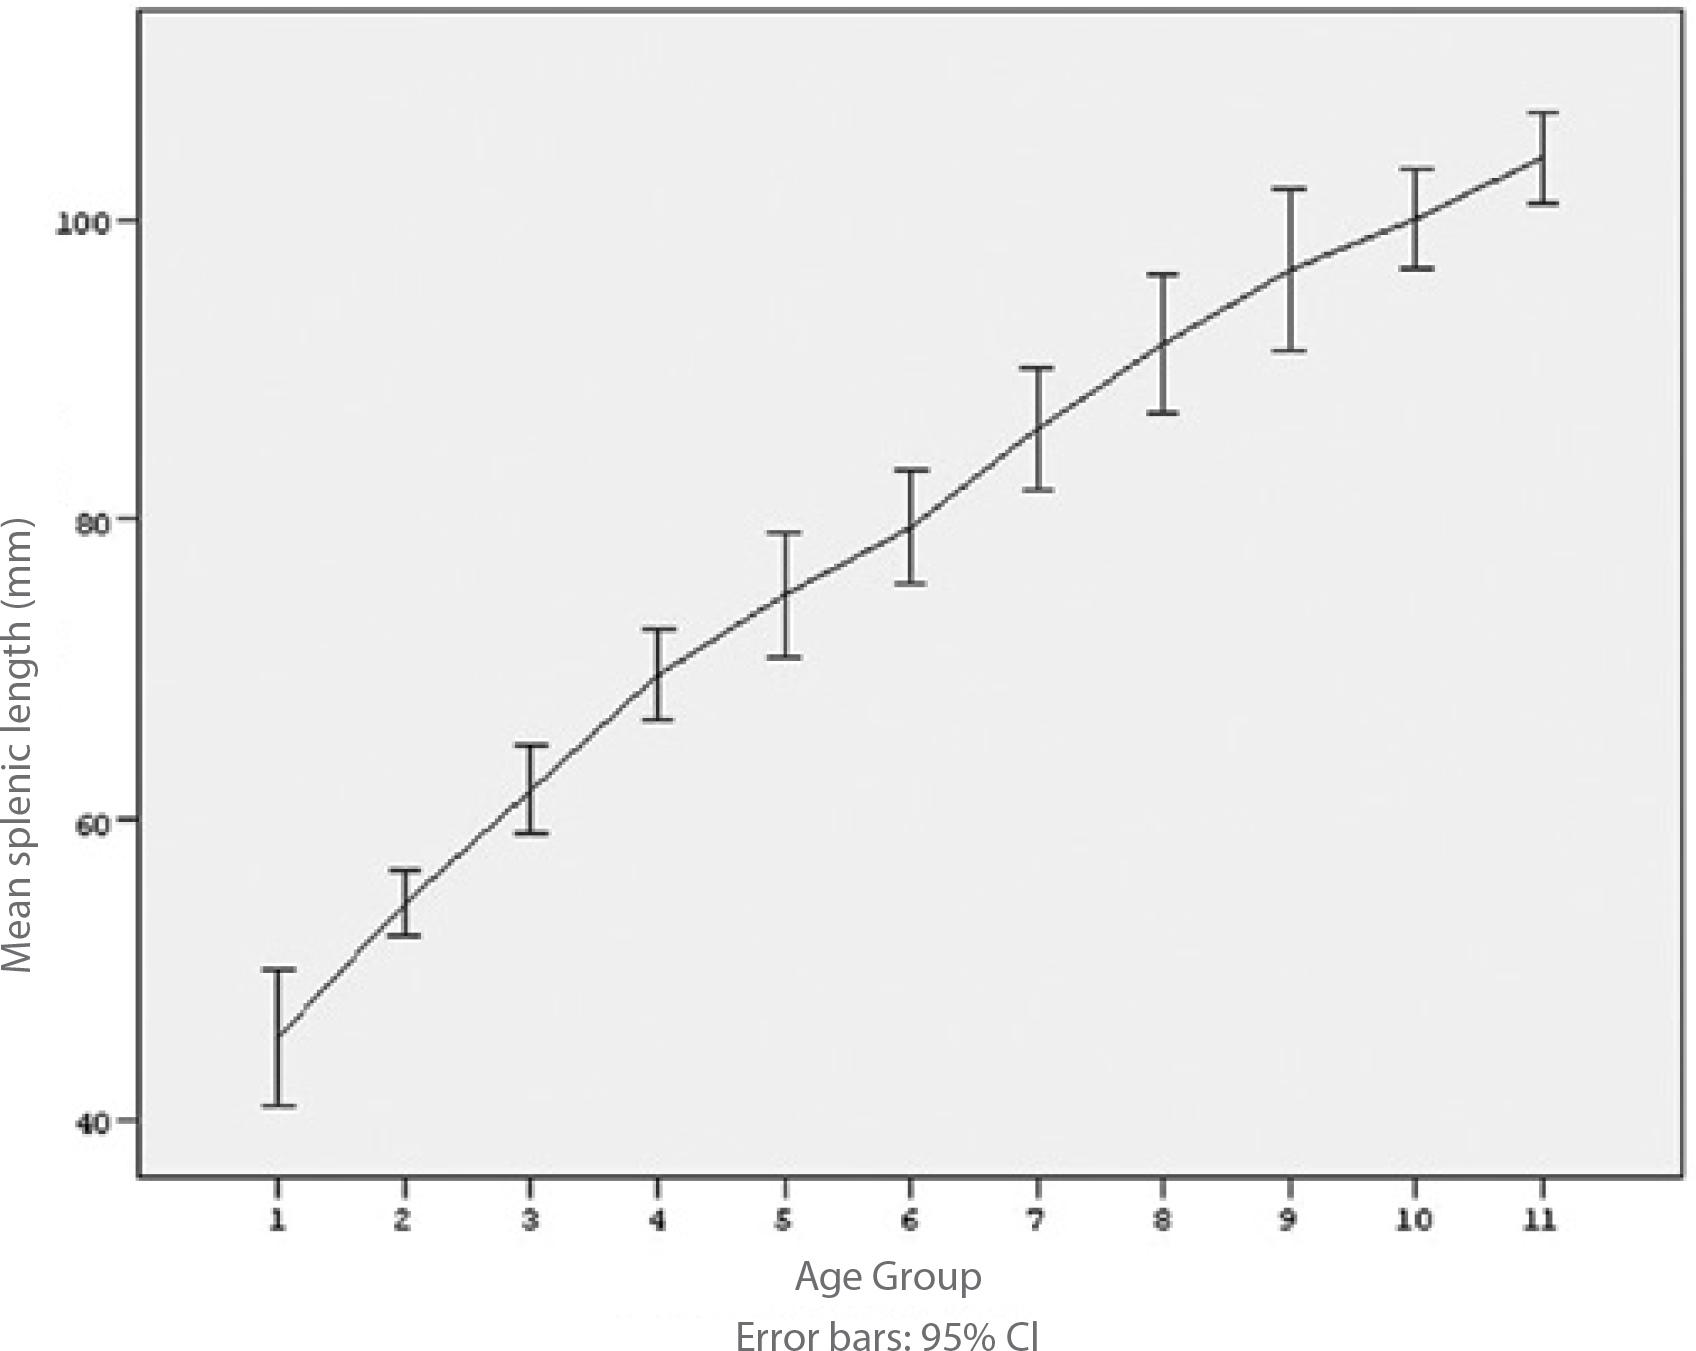
Fig. 2
_ Regression analysis with SL as a dependent variable
| Variable | Spleen | |
|---|---|---|
| Height | Constant | 24.934 |
| Coefficient | 0.498 | |
| Std. Error | 0.012 | |
| P Value | <0.001 | |
| Weight | Constant | 53.757 |
| Coefficient | 1.046 | |
| Std. Error | 0.034 | |
| P Value | <0.001 |
Splenic length to age by ultrasonography in healthy children (n = 310)
| Subjects | Splenic length (mm) | |||||||||
|---|---|---|---|---|---|---|---|---|---|---|
| Age Group | N | Mean | SD | Median | Min. | Max. | Percentile | 95% Confidence Intervalfor Mean | ||
| 10th | 90th | Lower bound | Upper bound | |||||||
| 0 – <3 mo | 21 | 46 | 10 | 47 | 29 | 65 | 33 | 61 | 41 | 50 |
| 3 – <6 mo | 24 | 54 | 5 | 55 | 46 | 67 | 47 | 62 | 52 | 57 |
| 6 – <12 mo | 24 | 62 | 7 | 61 | 50 | 75 | 54 | 74 | 59 | 65 |
| 1 – <2 y | 30 | 70 | 8 | 71 | 53 | 82 | 57 | 80 | 67 | 73 |
| 2 – <4 y | 27 | 75 | 11 | 75 | 58 | 99 | 62 | 89 | 71 | 79 |
| 4 – <6 y | 27 | 79 | 10 | 78 | 65 | 99 | 67 | 94 | 76 | 83 |
| 6 – <8 y | 31 | 86 | 11 | 84 | 67 | 106 | 74 | 101 | 82 | 90 |
| 8 – <10 y | 26 | 92 | 12 | 93 | 65 | 114 | 76 | 107 | 87 | 96 |
| 10 – <12 y | 27 | 97 | 14 | 101 | 68 | 114 | 73 | 111 | 91 | 102 |
| 12 – <14 y | 38 | 100 | 10 | 101 | 78 | 116 | 85 | 114 | 97 | 103 |
| 14 – <16 y | 35 | 104 | 9 | 101 | 87 | 124 | 94 | 118 | 101 | 107 |
_ Correlations of splenic length with height, weight, and age
| Parameters | Spleen |
|---|---|
| Height | 0.924 |
| Weight | 0.871 |
| Age | 0.874 |
| Correlation is significant at the 0.01 level | |
_ Splenic length relative to body height
| Body height(cm) | Splenic length – mean (mm) | Standard deviation |
|---|---|---|
| 45–60 | 44 | 8 |
| 61–80 | 62 | 8 |
| 81–100 | 74 | 8 |
| 101–120 | 81 | 9 |
| 121–140 | 86 | 9 |
| 141–160 | 100 | 7 |
| 161–174 | 108 | 7 |