Atherosclerosis is a significant cause of mortality in both Western countries and India, accounting for about half of all deaths in the former and approximately 28% in the latter(1,2). The etiology of atherosclerotic cardiovascular disease is multifaceted. The most prevalent risk factors include male gender, age (males older than 45 and females older than 55), hypertension, diabetes mellitus, cigarette smoking, and hypercholesterolemia(3,4). Low levels of high-density lipoprotein (HDL) and hypercholesterolemia, both independent risk factors for atherosclerosis, have been associated with abdominal obesity (AO)(5). While general obesity has been established as a cardiometabolic risk factor, AO is recognized as the best predictor of this risk, regardless of body mass index(6).
Although body mass index (BMI) has long been used to measure obesity, it does not fully capture changes in body composition. Increases in body fat and decreases in muscle mass may occur without significant changes in height, weight, or BMI, making it an incomplete measure of fat and muscle distribution(7). Recent evidence suggests that markers of abdominal obesity, such as waist circumference and visceral adipose tissue (VAT), may be better indicators of cardiovascular disease risk(8,9). Direct VAT measurement is typically performed using computed tomography (CT), dual energy X-ray absorptiometry (DEXA), and magnetic resonance imaging (MRI)(10,11). However, CT and MRI are costly due to expensive equipment and maintenance requirements, with MRI also necessitating lengthy image acquisition times. DEXA scans also have limited accessibility due to their cost and the need for specialized equipment. In comparison, ultrasonography (USG) offers several advantages, including the ability to simultaneously examine the abdomen and neck. It is widely accepted as one of the best methods for detecting early atherosclerosis in the carotid arteries(12,13,14). Additionally, USG is cost-effective, relatively quick, radiation-free, and widely available(15).
Various surrogate imaging markers of visceral adipose tissue deposition have been recently described, such as posterior right perinephric fat thickness (PRPFT), preperitoneal fat thickness (PPFT), visceral fat thickness (VFT), and abdominal fat index (AFI)(16). This study aimed to investigate the link between atherosclerosis and abdominal obesity using USG.
This hospital-based prospective observational study was conducted for a period of one and a half years, from February 2023 to July 2024, following approval from the College Research Committee and the Institutional Ethics Committee (IEC number: TMU/IEC/2021-22/78).
Patients with a BMI of 25–40 were included as cases, while those with a BMI of 18.0–24.9 served as controls. Both groups were age- and sex-matched.
Patients aged 18 years or older with a BMI greater than or equal to 25 and less than or equal to 40.
Patients aged 18 years or older with a BMI greater than or equal to 18 and less than 25.
Exclusion criteria for cases and controls
BMI greater than 40 kg/m2 (as measurement of abdominal indices using ultrasonography becomes difficult)
Patients with chronic debilitating diseases, specifically diabetes mellitus or known coronary artery disease
History of bariatric surgery
Sample size calculation: the sample size was calculated to be 106 based on the prevalence of abdominal obesity in the Indian population (approx. 57%) and a correlation coefficient of 0.4 between visceral fat and carotid atherosclerosis, as reported in a previous study(17,18).
Written informed consent was obtained from all cases and controls after a detailed explanation of the procedure.
BMI was calculated as the patient’s weight in kilograms divided by the square of their height in meters (kg/m2)(19).
All participants underwent USG of the abdomen and neck using a SIEMENS Acuson Sequoia machine. The examinations were conducted with the participants in a supine position, using a 3.5–5.0 MHz convex probe for abdominal imaging and a 10–14 MHz linear-array probe for neck imaging.
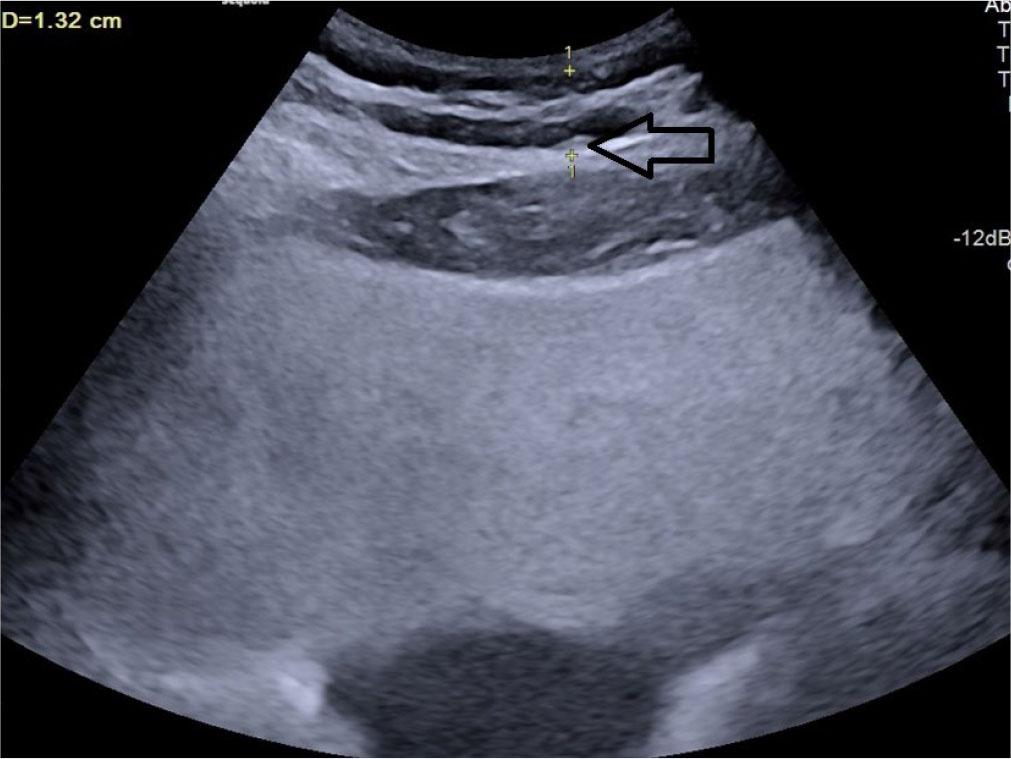
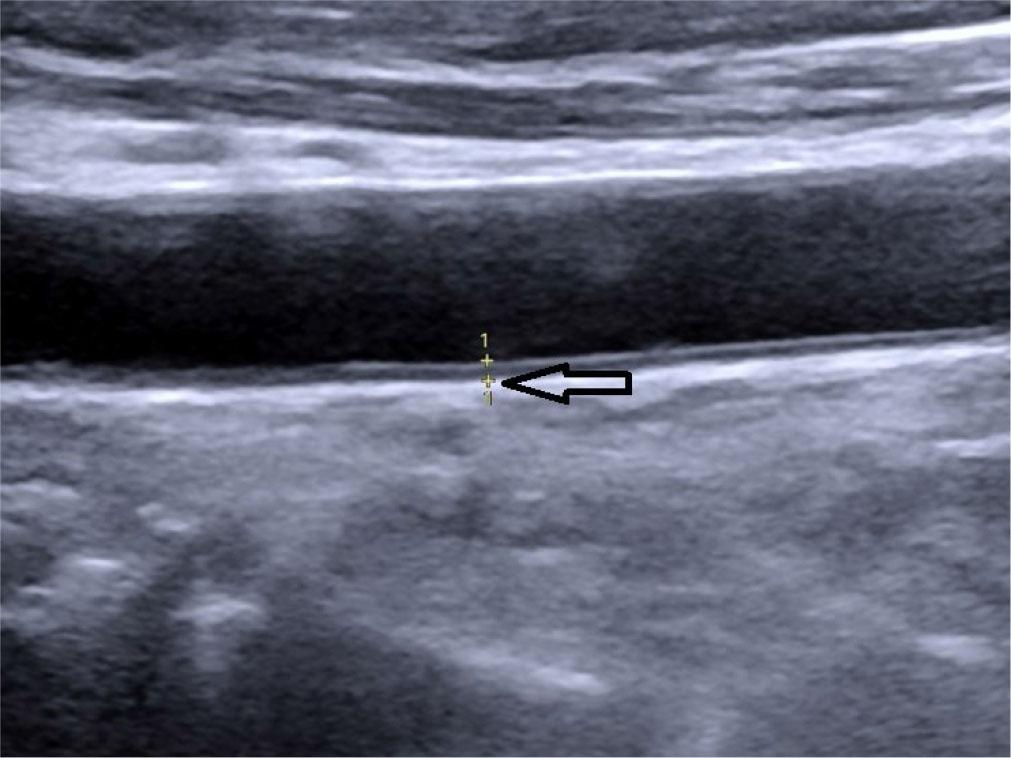
Posterior right perinephric fat thickness (PRPFT) – the maximum thickness of the fat layer located in the right posterior perinephric space, measured perpendicular to the renal capsule(20) (Fig. 1).

Longitudinal grey scale ultrasound showing measurement of posterior right perinephric fat thickness (PRPFT) denoted by calipers (arrow)
Preperitoneal fat thickness (PPFT) – the maximum thickness of abdominal fat located between the linea alba and the anterior surface of the liver capsule(21) (Fig. 2).

Transverse grey scale ultrasonography of the abdomen showing measurement of preperitoneal fat thickness denoted by calipers (arrow)
Subcutaneous fat thickness (SCFT) – the minimum thickness of fat located between the linea alba and the interface of the subcutaneous fat with the dermal layer of the skin(22) (Fig. 3).
Transverse grey scale ultrasonography of the abdomen showing measurement of subcutaneous fat thickness denoted by calipers
Splenic thickness (ST) – the distance between the splenic vein and the posterior border of the anterior abdominal muscles(16).
Abdominal wall fat index (AFI) – the ratio of PPFT to SCFT(23).
Visceral fat thickness (VFT) – the distance between the posterior border of the rectus abdominis muscle and the anterior wall of the aorta, measured perpendicular to the aorta at the level of the umbilicus(21) (Fig. 4).
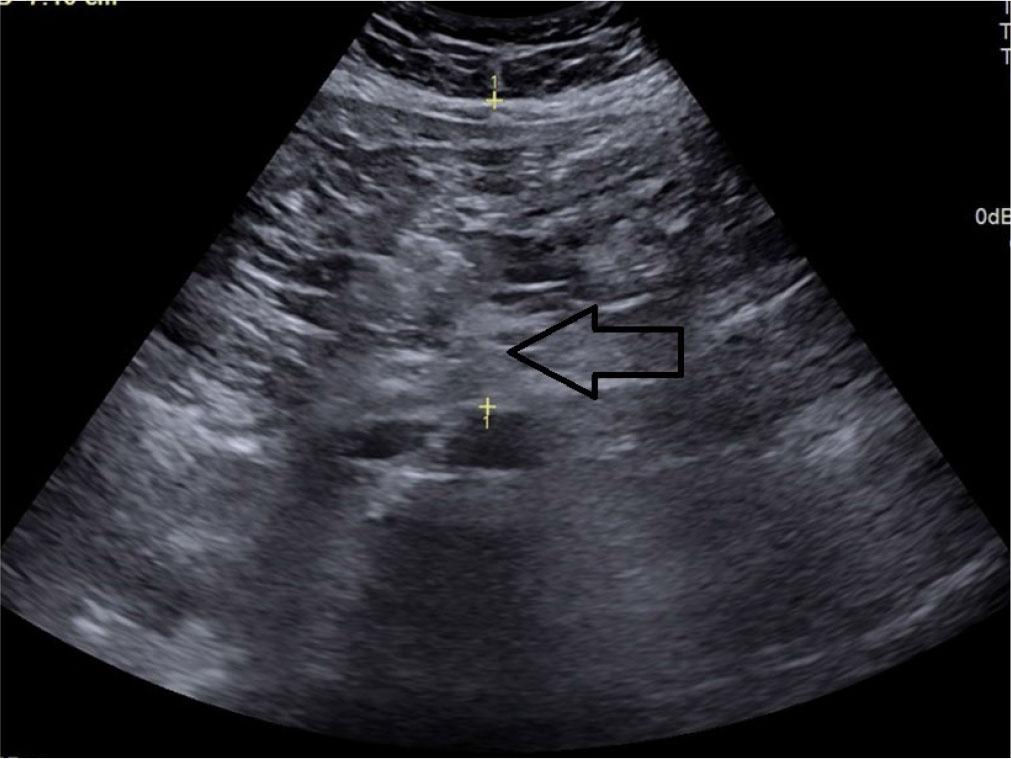
Transverse grey scale ultrasound of the abdomen showing measurement technique for visceral fat thickness denoted by calipers (arrow)
Visceral adipose tissue (VAT) = calculated using the formula: 9.008 + 1.191 × [ST (in mm)] + 0.987 × (the distance between the posterior aortic wall and the posterior border of the abdominal muscle at the umbilicus (in mm)] +3.644 × [PRPFT (in mm)](16,24) (Fig. 5).
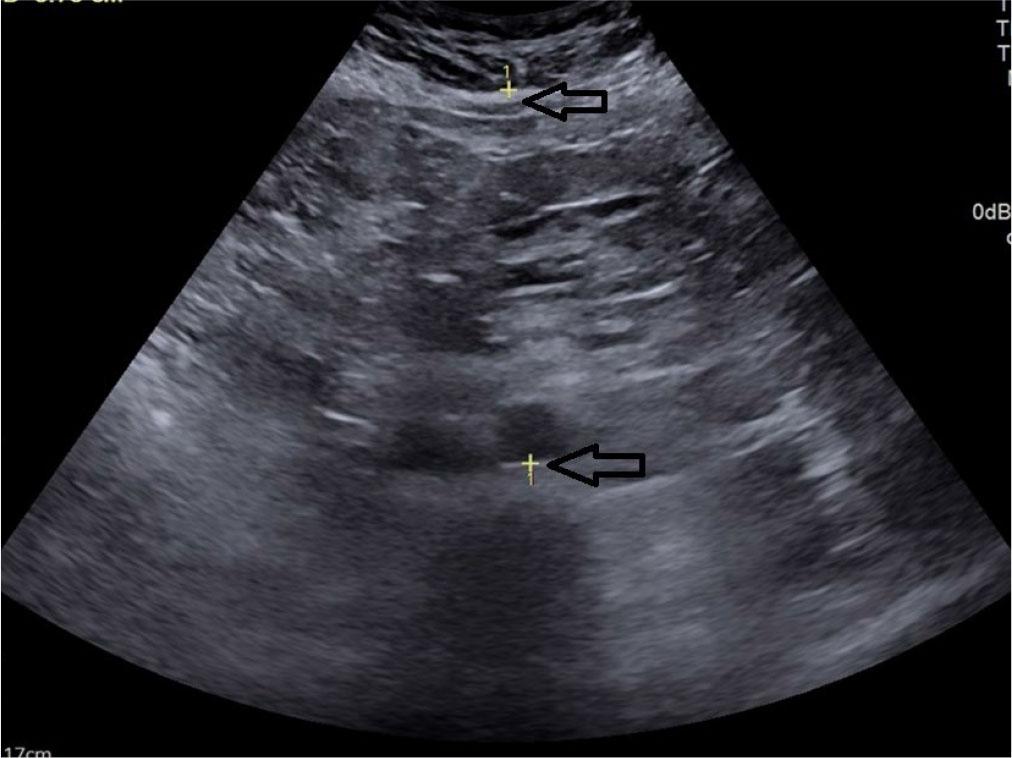
Transverse grey scale ultrasonography of the abdomen showing measurement of antero-posterior diameter between posterior border of abdominal wall and posterior wall of aorta for measurement of visceral adipose tissue thickness denoted by calipers (arrow)
Intima-media thickness (CIMT) – the distance between the outer and inner borders of the double-line pattern in the far wall of the common carotid artery (CCA) observed in the longitudinal view during neck ultrasound. Five measurements were taken on each side, 1 cm proximal to the carotid bifurcation, and the average of the measurements was considered as CIMT for statistical analysis(25,26) (Fig. 6).
Oblique longitudinal grey scale ultrasound of the neck showing measurement of carotid intima-media thickness (CIMT) denoted by calipers, marked by hollow arrow (0.08 cm)
Cut-off values for various markers were derived from a study by Hazem et al. to calculate sensitivity and specificity in relation to CIMT in the case group(16).
The statistical analysis was conducted using statistical software SPSS version 25.0 subsequent to the data being imported into a Microsoft excel spreadsheet. Normality of variables was checked with the Kolmogorov-Smirnov test. When comparing the mean values of the two groups, the Student’s t-test was utilized, while the Chi-square test was applied to analyze the frequencies between groups. Statistical significance was set at p <0.05.
The study included 100 cases and 100 age- and sex-matched controls, ranging from 18 to 60 years of age (Tab. 1). Each group consisted of 41 males and 59 females (male/female ratio: 0.69 in both study groups). The mean age of the cases was 48.63 ± 13.52 years, while the mean age of the controls was 47.84 ± 12.80 years (Tab. 1).
Descriptive statistics of various variables in cases and controls
| Variables | Cases | Controls | p-value |
|---|---|---|---|
| Age (Years) | 48.63 ± 13.52 | 47.84 ± 12.80 | 0.606 |
| Weight (kg) | 71.89 ± 7.91 | 56.48 ± 8.02 | <0.001 |
| Height (cm) | 158.77 ± 8.31 | 162.36 ± 9.31 | 0.04 |
| BMI* | 28.94 ± 3.23 | 21.32 ± 1.19 | <0.001 |
| Posterior right perinephric fat thickness (mm) | 4.460 ± 1.03 | 3.35 ± 0.97 | <0.001 |
| Preperitoneal fat thickness (mm) | 17.42 ± 4.19 | 14.39 ± 4.75 | <0.001 |
| Subcutaneous fat thickness (mm) | 13.43 ± 2.92 | 10.98 ± 3.86 | <0.001 |
| Abdominal wall fat index | 1.31 ± 0.23 | 1.34 ± 0.22 | 0.420 |
| Visceral fat thickness (mm) | 63.66 ± 15.61 | 43.78 ± 12.34 | <0.001 |
| Visceral adipose thickness (mm) | 138.29 ± 20.70 | 110.49 ± 17.62 | <0.001 |
Body mass index (kg/cm2)
All variables were confirmed to follow a normal distribution, as assessed using the Kolmogorov-Smirnov (KS) test.
Various fat measurements, including PRPFT, PPFT, SCFT, VAT, VFT as well as CIMT, showed significant differences between cases and controls (Tab. 1). However, the abdominal wall fat index did not exhibit significant differences between the two groups.
BMI did not show any statistically significant correlations with CIMT in the group of cases (p = 0.07).
PRPFT showed a strong link with CIMT in cases and a moderate correlation in controls (Tab. 2) (Fig. 7). PPFT, SCFT demonstrated a moderate association with carotid IMT in cases but a weak association in controls. AFI showed a weak association with CIMT in both cases and controls (Fig. 8). Both VFT and VAT exhibited a weak association in cases and a moderate association in controls.
Statistical significance and correlation values of various measurements compared between cases and controls in relation to carotid intima-media thickness
| Variables | Cases | Controls | ||
|---|---|---|---|---|
| p-value | Correlation coefficient (r) | p-value | Correlation coefficient (r) | |
| Posterior right perinephric fat thickness | 0.004 | 0.72 | <0.001 | 0.31 |
| Preperitoneal fat thickness | 0.001 | 0.66 | 0.07 | 0.17 |
| Subcutaneous fat thickness | 0.003 | 0.69 | 0.42 | 0.08 |
| Abdominal wall fat index | 0.03 | 0.21 | 0.10 | 0.16 |
| Visceral fat thickness | 0.04 | 0.20 | <0.001 | 0.30 |
| Visceral adipose thickness | 0.02 | 0.22 | 0.07 | 0.32 |
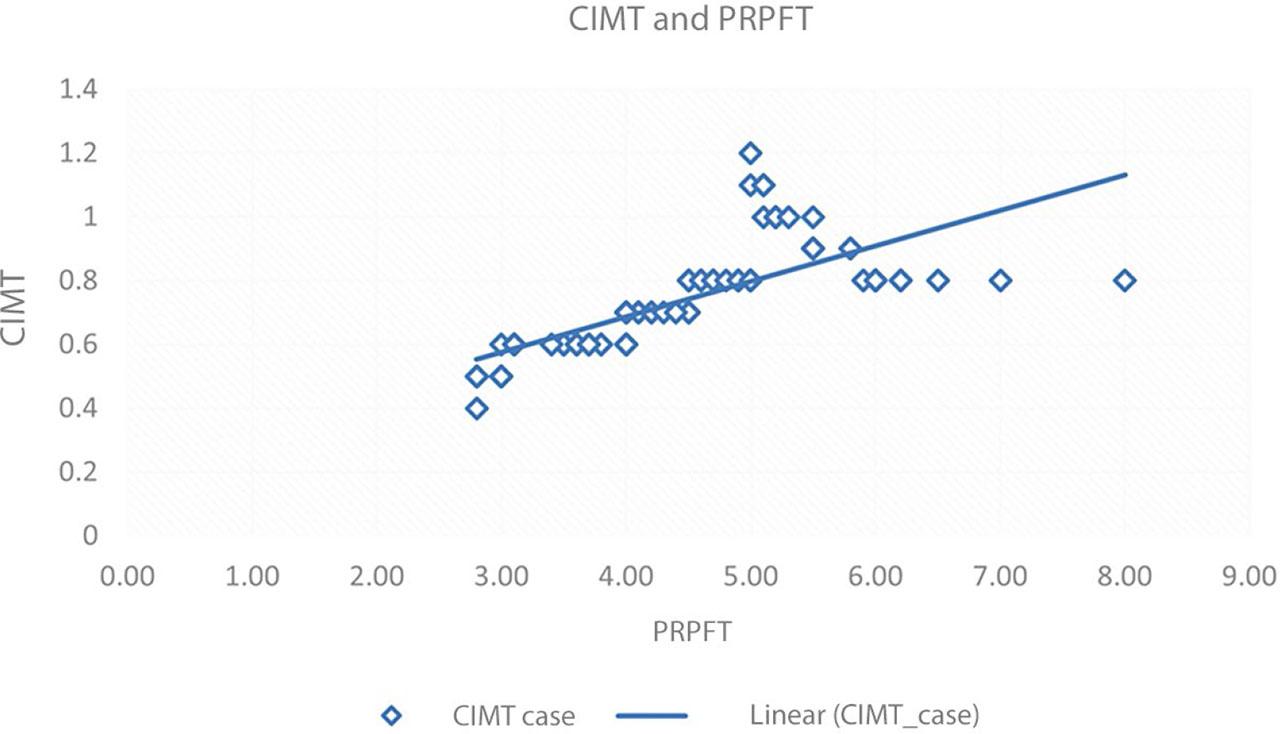
Scatter plot showing PRPFT and CIMT correlation in cases. Blue diamonds represent the data points for CIMT in cases and a linear trend line shows a positive correlation

Scatter plot comparing CIMT and abdominal fat index (AFI) in cases. Marked variation of CIMT values relative to AFI indicates a weak association
Among the parameters measured in the study, PRPFT was the most sensitive (86.3%) and specific (71.4%) indicator, while BMI was the least sensitive in relation to carotid intima-media thickening in the group of cases (Tab. 3).
Statistical significance, sensitivity, and specificity of various adipose tissue markers in relation to carotid intima-media thickness in cases
| BMI >30 | PRPFT ≥11.2 mm | PPFT ≥10.8 mm | SCFT ≥21.3 mm | VAT ≥176 mm | AFI ≥0.519 | VFT ≥62.1 mm | |
|---|---|---|---|---|---|---|---|
| Number of cases with thickened CIMT (≥ 0.9 mm) | 28 | 38 | 32 | 34 | 37 | 31 | 36 |
| p-value | 0.076 | 0.004 | 0.001 | 0.003 | 0.02 | 0.03 | 0.04 |
| Sensitivity (%) | 63.7 | 86.3 | 72.7 | 77 | 84.1 | 70.5 | 81.8 |
| Specificity (%) | 67.9 | 71.4 | 75 | 53.5 | 64.2 | 44.6 | 71.4 |
CIMT – carotid intima-media thickness; BMI – body mass index; PRPFT – posterior right perinephric fat thickness; PPFT – preperitoneal fat thickness; SCFT – subcutaneous fat thickness; VAT – visceral adipose tissue thickness; AFI – abdominal wall fat index; VFT – visceral fat thickness
Abdominal obesity has been strongly linked to all-cause mortality, especially cardiovascular disease-related deaths, even among adults with normal weight. The present study aimed to further analyze the potential link between abdominal obesity and atherosclerosis(27). We found that cases (high BMI) showed significantly higher PRPFT, PPFT, SCFT, VFT, and AFI, as compared to controls, indicating a linear correlation between BMI and markers of visceral adipose tissue, consistent with the findings of Mouchti et al.(28). Chandak et al.(22) also found a strong positive association between SCFT and BMI.
In our study, PRPFT was the most sensitive (p <0.001, r = 0.72) and BMI was the least sensitive indicator with regard to high carotid intima-media thickness. Terzis et al.(29) and Rovella et al.(30) reported that BMI independently influenced intima-media thickness (IMT) and plaque presence. Although individuals with high BMI had a higher mean CIMT in our study, it was not statistically significant (p = 0.07). This finding aligns with the CARDIA study and other research conducted in China and Singapore, which found that combining BMI and abdominal obesity measurements better predicts cardiovascular disease (CVD) risk than BMI alone(31). Additionally, individuals with BMI <20 kg/m² may also suffer from abdominal obesity and non-communicable diseases(18). South Asians, with their “Thin Fat Phenotype,” often have increased abdominal fat, making measures like PRPFT and PPFT potentially more effective than BMI for detecting abdominal obesity(32). Studies by Hazem et al.(16) and Liu et al.(33) support the strong association between PRPFT and carotid artery plaque burden, while Roever et al.(8) highlighted that PRPFT helps identify atherosclerosis risk. PPFT was also significantly higher in cases (p <0.001) in our study and showed a strong association with carotid atherosclerosis (r = 0.66, p <0.001). These results are consistent with the findings by Yamamoto et al.(34), who identified PPFT as an important risk factor for carotid IMT, but contrast with the results of Liu et al.(33), who found no significant association in men and only borderline significance in women after model adjustment. Such discrepancies may be due to differences in study populations.
Subcutaneous fat thickness (SCFT) is a commonly used measure to evaluate subcutaneous adiposity, which can serve as an indicator of overall body adipose tissue distribution(22). When comparing cases and controls with respect to subcutaneous fat thickness (SCFT) in our study, a p-value of 0.003 was obtained, indicating a statistically significant difference between the two groups. There was a strong positive association of SCFT with carotid atherosclerosis in cases (r = 0.69), whereas in controls, the association was weak (r = 0.08). These findings could suggest that SCFT may be more relevant for identifying or understanding atherosclerosis in individuals with higher BMI. Hazem et al.(16) similarly reported significant associations between SCFT and carotid atherosclerosis. In contrast, Radmard et al.(35) concluded that subcutaneous fat measures were poor indicators of CIMT, although their study did not specifically focus on individuals with high BMI. Jung et al.(26) found an inverse relationship between SCFT and CIMT, suggesting a protective effect of SCFT, but their study population consisted of older males with type 2 diabetes, which may have influenced the results. Given these conflicting results, further research is necessary to assess the role of SCFT in predicting atherosclerosis in high BMI populations.
The abdominal wall fat index (AFI) provides a measure of the distribution of fat within the abdominal wall layers(23). A higher AFI indicates more fat in the preperitoneal space relative to the subcutaneous layer, while a lower AFI suggests a thicker subcutaneous fat layer compared to preperitoneal fat. In our study, no significant difference in AFI was observed between cases and controls (p = 0.42). However, a positive correlation between AFI in cases and carotid atherosclerosis was obtained (p <0.05). We found a weak positive association between CIMT and AFI using correlation coefficient (r). Mixed findings regarding the utility of AFI have been published in previous studies. Notably, Kawamoto et al.(23) detected an association between IMT and AFI, however their study population consisted of non-obese men. Contradictory results were obtained by Yamamoto et al.(34), who found that the AFI was not correlated with intima-media thickness (IMT). This suggests that AFI may not be a strong predictor of CIMT as a standalone marker and its utility is, at best, complementary to other markers. However, further larger population studies are needed to investigate the relationship between AFI and CIMT.
Visceral fat thickness (VFT) helps quantify the amount of visceral fat surrounding abdominal organs. While subcutaneous adipose tissue has a limited metabolic impact according to previous studies, visceral adipose tissue is metabolically active, secreting adipokines that cause vascular inflammation and insulin resistance(4). Our study found a weak positive association between VFT and carotid atherosclerosis in both cases and controls (r = 0.2 and 0.3 respectively). These findings suggest that while VFT is a significant predictor of carotid atherosclerosis, the strength of the association is relatively weak. Our results align with those of Kim et al.(36) who also found an association between VFT and CIMT measured by USG. Hazem et al.(16) similarly concluded that increased VFT is helpful in detecting increased CIMT. However, our findings differ from those of Jung et al.(26), who concluded that VFT was not significantly correlated with carotid IMT which may due to differences in the ethnicity of study populations and the inclusion of diabetic males in their sample. Vlachos et al.(37) concluded that visceral fat thickness is directly related to CV risk in diabetic individuals and specific subgroups of healthy volunteers, and may be more sensitive than waist circumference and abdominal sagittal diameter.
In our study, cases exhibited significantly higher visceral adipose thickness (VAT) as compared to controls, with a p-value <0.001. We found that VAT has a weak association with carotid atherosclerosis in all study subjects, with a correlation coefficient of 0.22 and a significant p-value of 0.02 in cases. A meta-analysis by Ferreira et al.(38) reviewed four studies that used CT scans to quantify VAT and another that used MRI and concluded that VAT in 980 healthy Japanese individuals was independently associated with carotid plaques. Moreover, Tanaka et al.(39) reported that high VAT is directly correlated with severity of coronary artery plaques.
In summary, the strongest positive correlations with carotid atherosclerosis were observed for PRPFT and PPFT, likely due to their minimal operator-dependent variation, reduced respiratory influence, and no impact from probe compression. Associations were also noted for SCFT, VAT, and VFT, especially in patients with high BMI.
A major limitation of the study was the small sample size, with only hospital-based data taken into consideration, which may not fully represent the broader population. Further investigations involving a more extensive participant pool would be essential to corroborate and reinforce the validity of these findings.
As USG is operator-dependent, some parameters may be altered due to variations in operator techniques, causing bias. To eliminate this, all the measurements in the study were performed by a single radiologist to ensure consistency.
The study did not compare the results between males and females. Future studies with a focus on gender differences in CIMT and abdominal fat indices are suggested.
We conclude that ultrasonographic markers of visceral adipose tissue, especially PRPFT and PPFT, show a stronger association with carotid atherosclerosis compared to BMI, making them useful predictors, particularly in individuals with high BMI. These markers can be measured during routine abdominal ultrasounds to screen for atherosclerosis risk in patients with abdominal obesity. Further research with more participants is needed to better understand the clinical implications of these findings and to develop more targeted approaches for managing and preventing cardiovascular diseases.