

Figure 1
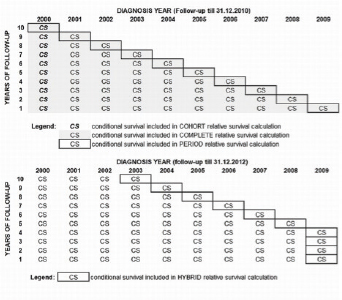
The illustration of the choice of patients diagnosed between the years 2000 and 2009 that contribute to a relative survival calculation with cohort, complete and period approaches (top: a follow up untill the end of 2010) and those that contribute to the hybrid approach (bottom: a follow up untill the end of 2012).
Table 1
The one- to ten-year relative survivals with 95% confidence intervals and Pohar Perme relative survival estimators for Slovenian female breast cancer patients diagnosed between 2000 and 2009* derived by cohort, complete, period and hybrid approaches.
| Follow-up time | COHORT all patients diagnosed in 2000 | COMPLETE all patients diagnosed from 2000 to 2009 | PERIOD some patients diagnosed from 2000 to 2009* | HYBRID some patients diagnosed from 2003 to 2009* | ||||
|---|---|---|---|---|---|---|---|---|
| Relative survival (95% confidence interval) | Pohar Perme estimator | Relative survival (95% confidence interval) | Pohar Perme estimator | Relative survival (95% confidence interval) | Pohar Perme estimator | Relative survival (95% confidence interval) | Pohar Perme estimator | |
| 1-year | 96 (94-97) | 96 | 95 (95-96) | 96 | 96 (92-99) | 97 | 96 (92-99) | 97 |
| 2-year | 90 (87-92) | 91 | 92 (91-92) | 92 | 93 (89-96) | 93 | 93 (89-96) | 93 |
| 3-year | 85 (82-87) | 85 | 88 (87-89) | 88 | 89 (85-92) | 90 | 89 (86-92) | 90 |
| 4-year | 80 (77-83) | 81 | 85 (84-86) | 86 | 87 (83-91) | 88 | 87 (84-90) | 88 |
| 5-year | 77 (74-80) | 77 | 83 (82-84) | 83 | 85 (81-89) | 85 | 85 (82-88) | 86 |
| 6-year | 73 (70-77) | 75 | 80 (79-81) | 81 | 83 (79-86) | 83 | 84 (80-87) | 83 |
| 7-year | 72 (68-75) | 72 | 79 (77-80) | 80 | 80 (76-84) | 82 | 82 (78-85) | 82 |
| 8-year | 71 (67-74) | 72 | 77 (75-78) | 78 | 78 (74-82) | 78 | 80 (76-83) | 79 |
| 9-year | 70 (66-74) | 72 | 76 (74-77) | 77 | 76 (72-80) | 76 | 79 (75-82) | 78 |
| 10-year | 69 (65-73) | 73 | 75 (73-76) | 77 | 75 (71-79) | 75 | 78 (74-81) | 77 |
* With period and hybrid approaches, only the most recently diagnosed survivors are included (the included incidence years are specified in Figure 1).
* With period and hybrid approaches, only the most recently diagnosed survivors are included (the included incidence years are specified in Figure 1).
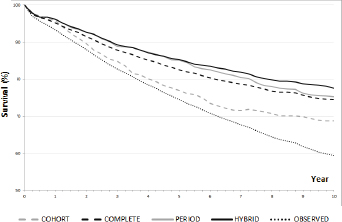
Figure 2
The relative survival curves derived by cohort, complete, period and hybrid approaches, and Kaplan-Meier observed survival for Slovenian female breast cancer patients diagnosed between 2000 and 2009.
Table 2
The differences in the relative survival calculation approaches between and within major population-based cancer survival studies, aiming to compare cancer care in several countries.
| Population-based relative survival follow-up | Diagnosis year of included patients | End of follow-up year | Relative survival approach |
|---|---|---|---|
| CONCORD-1 (3) | 1990-1994 | 1999 | cohort |
| CONCORD-2 (4) | 1995-2004 | 2009 | cohort |
| CONCORD-2 (4) | 2005-2009 | 2009 | period |
| EUROCARE-4 (5) | 1995-1999 | 2003 | cohort |
| EUROCARE-4 (5) | 1996-2002 | 2003 | period |
| EUROCARE-5 (6) | 2000-2007 | 2008 | complete |
| EUROCARE-5 (6) | 1999-2007 | 2008 | period |
| OECD HCQI 2011 (7) | 1995-2004 | 2009 | not specified |
| OECD HCQI 2013 (8) | 1995-2009 | 2012 | period or cohort |