
Along with the rising life expectancy, there occurs an increased interest in geriatric care and assessment of life quality in elderly persons [1,2]. Finding ways of health optimisation at an advanced age is key to reducing the effects of population ageing on health and social care systems [3].
Universities of the Third Age (UTAs) are institutions that offer various forms of physical, mental and social activity to senior citizens. Owing to gaining knowledge in various areas, developing useful skills, participating in physical activity classes, pursuing their interests as well as establishing social contacts, senior citizens may develop in a variety of ways. Simultaneously, a typical UTA student manifests a number of positive personality traits conducive to active ageing and leading an active lifestyle [4].
The World Health Organisation (WHO) defined the quality of life as an individual’s perception of their position in life in the context of the value system and culture in which they live. Furthermore, it is connected with their goals, expectations, standards and concerns [5].
The group of WHO Quality of Life (WHOQOL) developed a short version of the questionnaire aimed at assessing the quality of life (WHOQOL-BREF). This version consists of 26 items which measure four domains: physical health, psychological health, social relationships and environment. Psychometric examinations showed that WHOQOL-BREF is a cross-culturally valid assessment of life quality [6].
This aim of the study was to examine the effects of physical activity on the quality of life in UTA students. Another purpose was to determine correlations between physical activity at a young age and the level of health state and physical activity at the time of the research as well as assessing the effects of socio-demographic factors on the quality of life in elderly individuals.
The study was carried out in Warminsko-mazurskie region in 2017. It included 138 students from UTA in Olsztyn, Szczytno and Ketrzyn. The study group consisted of 113 female and 25 male participants aged 50 and above. Individuals aged 50-59 constituted 7% of the group (N = 10), those aged 60-69 accounted for 52% (N = 72), participants aged 70-74 constituted 26% (N = 35), while subjects aged 75 and above comprised 15% (N = 21) of all the students (fig. 1). The majority of the respondents came from urban areas, while as few as 11.6% of them lived in rural areas. 97.1% of the subjects had higher (53.6%) or secondary (43.5%) education, while only 2.9% had vocational education.
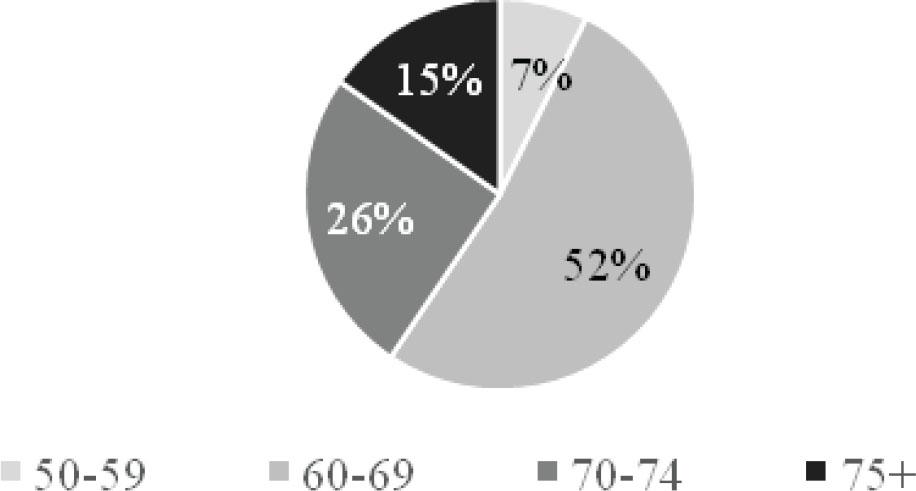
Percentage distribution of the study participants in particular age groups
A diagnostic survey was a method employed in the study. A questionnaire consisting of two parts was applied as a research tool. The first part included the authors’ own questionnaire with general (socio-demographic) questions as well as questions regarding physical activity levels at a young age and at the time of the research. The second part was made up of the standardised WHOQOL-BREF questionnaire (shorter version of WHOQOL) which was used to assess the subjects’ quality of life. When addressing the questions, the respondents made a subjective assessment of their overall perception of life quality and health state as well as physical, mental, social and environmental functioning. The responses were marked on a 5-point scale (scores ranged from 1 to 5). For each domain, a maximum of 20 points could be obtained. Domain scores were scaled in a positive direction, i.e. higher scores denoted higher quality of life. Raw scores were converted to transformed scores so that they would always range between 4 and 20. In this way they were comparable to the scores obtained by means of WHOQOL-100 [7].
Statistical analysis was performed using Excel 2013. The Student’s T-test was applied to assess statistical correlations for normally distributed variables, while the Mann-Whitney U test was used to compare two continuous variables. Correlations between categorical variables were evaluated with the chi-square test.
The results of the analysis regarding physical activity levels of the study participants at a young age and at the time of the research can be found below (fig. 2 and 3).
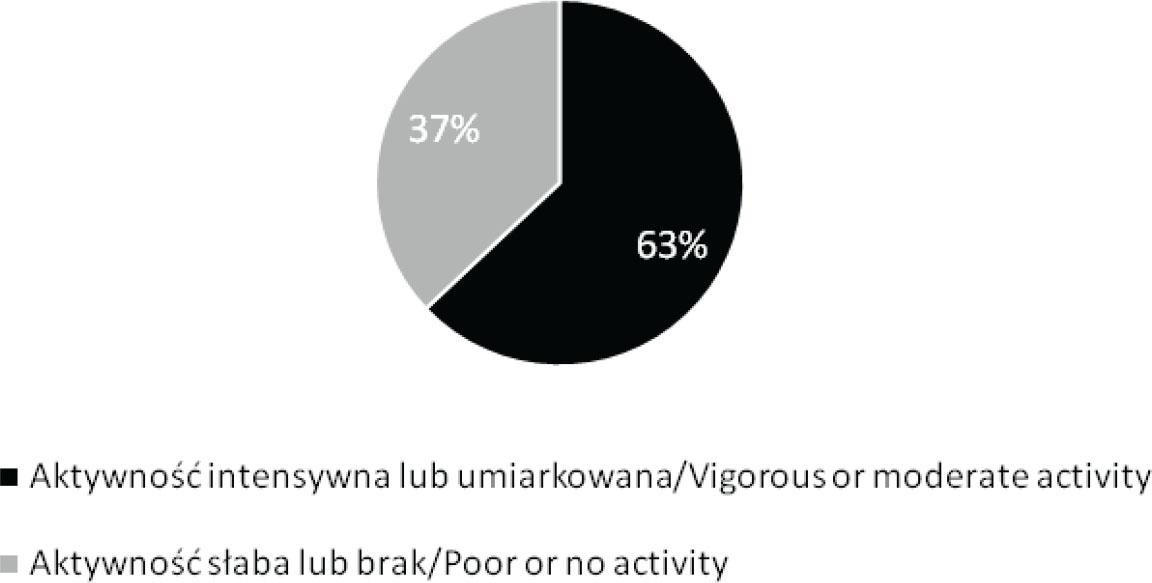
Physical activity levels of the study participants at a young age with regard to sex
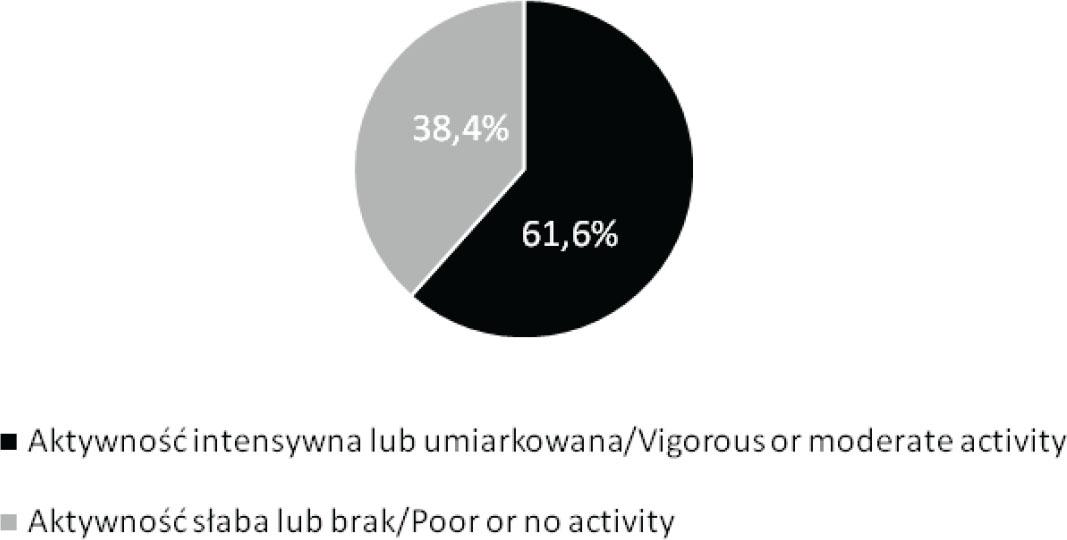
Physical activity levels of all the study participants at the time of the research
63% of the subjects claimed they had performed vigorous or moderate physical activity at a young age. In their opinion, this activity was good or very good and it was performed every day or a few times a week. No physical activity or its poor level at a young age was declared by 37% of the respondents.
Seventy out of 113 female participants (62%) and 17 out of 25 male respondents (68%) performed vigorous or moderate physical activity at a young age.
At the time of the research, 61.6% of the respondents performed vigorous or moderate physical activity, while 38.4% declared poor or no activity.
Seventy-four out of 113 females (65%) and 11 out of 25 males (44%) stated they performed vigorous and/or moderate physical activity at the time of the research.
The chi-square test of independence was employed to compare physical activity levels at a young age and at the time of the research in all the study participants (tab. 1) and with regard to sex.
Chi-square test of independence results comparing physical activity levels of all the study participants at a young age and at the time of the research
| Aktywność fizyczna / Physical activity | Intensywna lub umiarkowana / Vigorous or moderate | Słaba lub brak / Poor or none | χ2(1) | p | ||
|---|---|---|---|---|---|---|
| N | % | N | % | |||
| W młodości / At a young age | 87 | 63,0 | 51 | 37,0 | 0.0617 | 0.8038 |
| Obecnie / At the time of the research | 85 | 61,6 | 53 | 38,4 | ||
No significant differences were noted between physical activity levels at a young age and at the time of the research taking into account both all the participants (p < 0,05) and the division with regard to sex: females χ2 = 0.3062; p = 0.580001; males χ2 = 2.9221; p = 0.087375.
Moreover, it was checked whether the subjects who manifested vigorous or moderate physical activity levels were still more active than individuals who reported poor physical activity levels (Fig. 4).
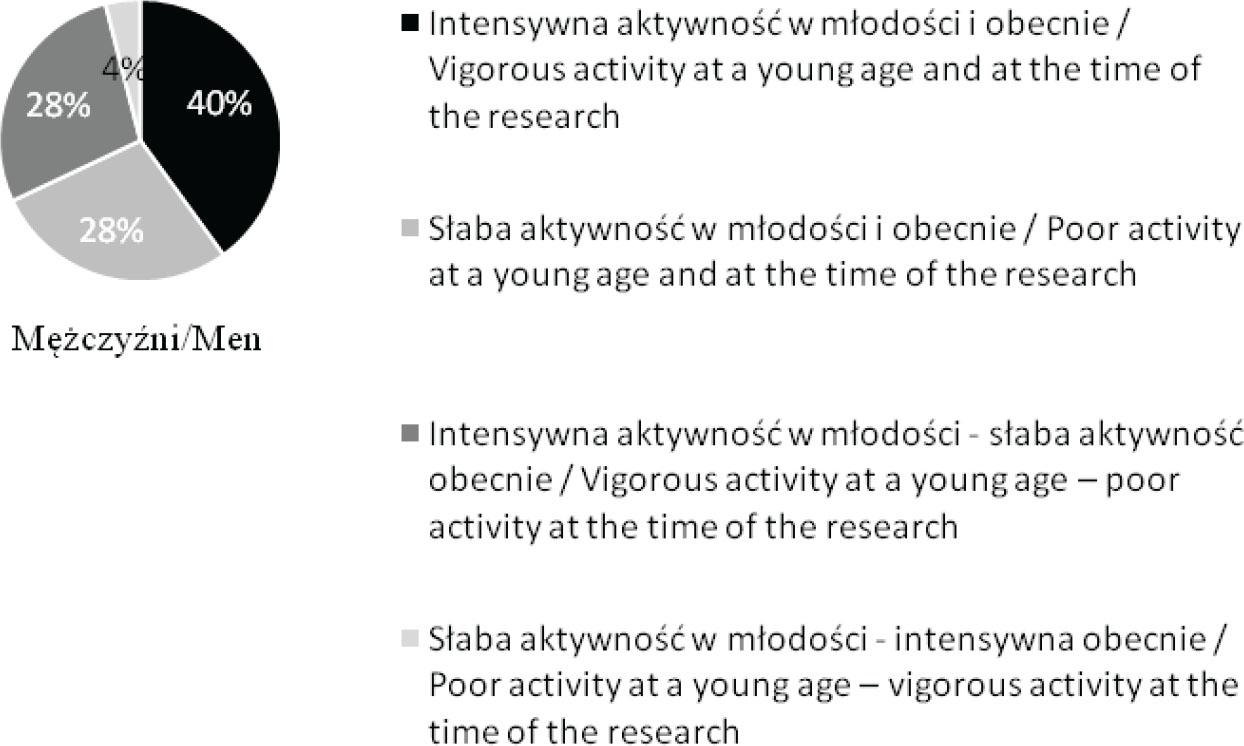
Physical activity levels of the study participants at a young age and at the time of the research with regard to sex
The examined women who performed vigorous or moderate physical activity at a young age (48%) are still more physically active than women who did it less frequently (20%). 14% of the female subjects stated that at the time of the research they were less active than at a young age, whereas 18% declared an improvement in physical activity levels compared to their activity in the past.
40% of the examined men who performed vigorous physical activity at a young age declared that at the time of the research they demonstrated similar activity levels. The men who revealed poor physical activity levels both in the past and at the time of the research constituted 28%. Compared to physical activity at a young age, a current reduction in its levels was declared by 28% of the respondents, while an improvement was reported by 4% of the study participants.
Figures 5 and 6 show the comparison of the forms of physical activity performed most frequently by the examined women and men at a young age and at the time of the research.
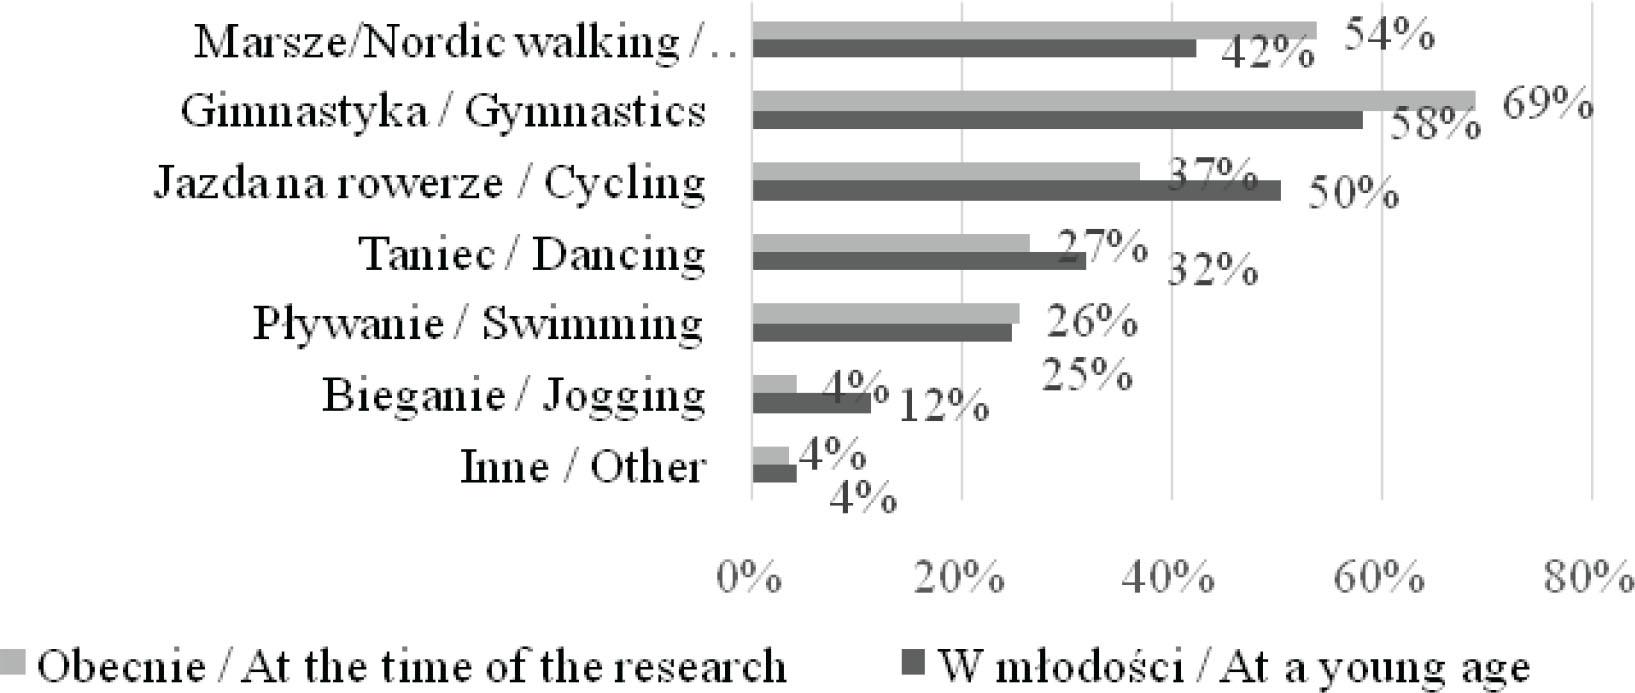
The comparison of the forms of physical activity performed most frequently by the examined women at a young age and at the time of the research
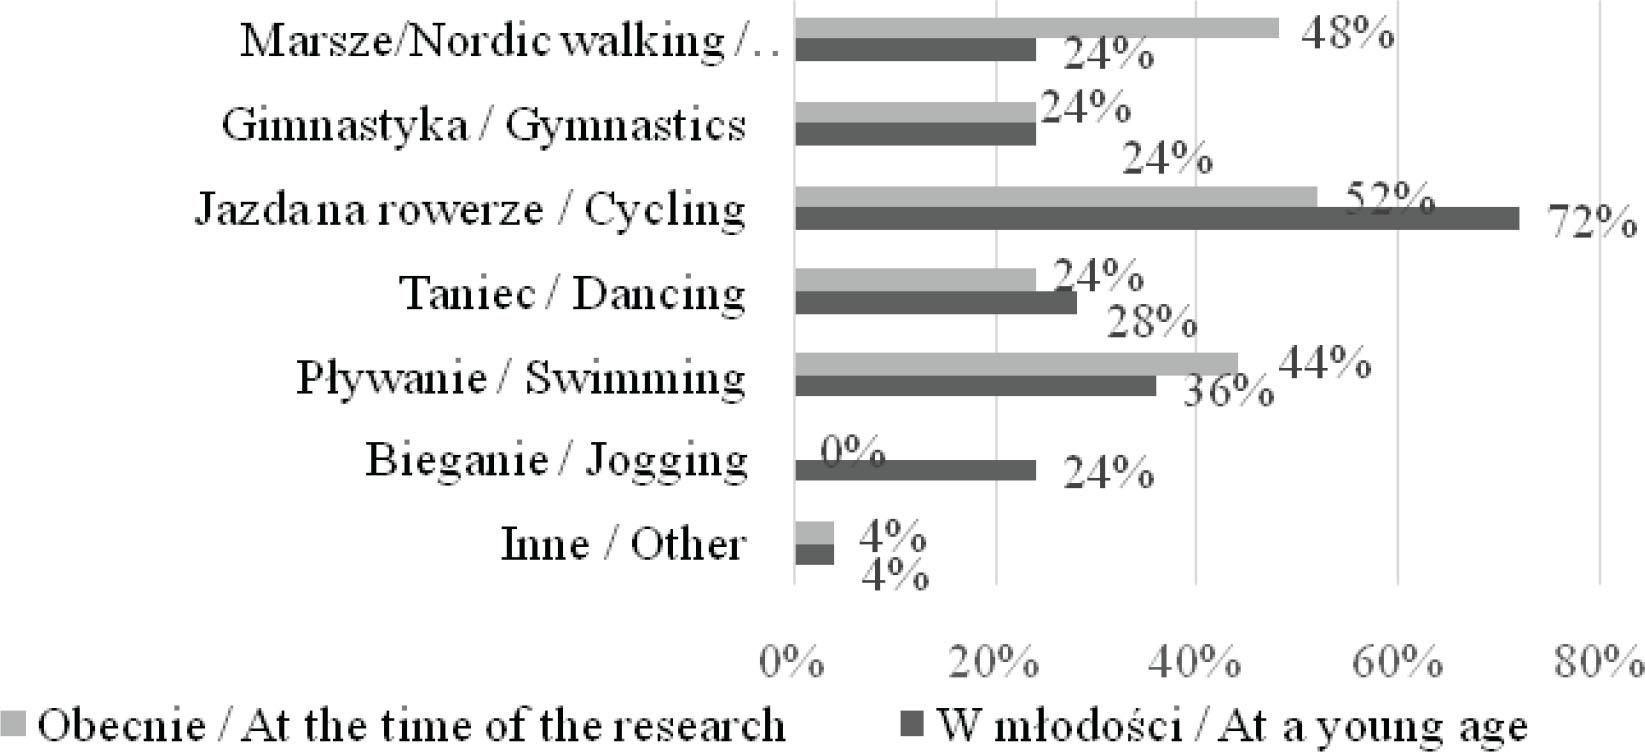
The comparison of the forms of physical activity performed most frequently by the examined men at a young age and at the time of the research
The forms of physical activity performed most frequently by the female study participants both at a young age and at the time of the research were gymnastics, walking/Nordic walking and cycling. In the case of men, it was also walking/Nordic walking and cycling as well as swimming.
The respondents expressed their opinions about sports activities offered by UTA. 65.9% of the participants stated that such classes encouraged them to exercise more. According to 50.0% of the subjects, there was a large variety of activities on offer. 13.0% of the respondents did not make use of sports activities offered by UTA for various reasons, while 10.0% claimed there were few such activities compared to other forms of activity.
The results of the analysis regarding the quality of life based on the data collected by means of the WHOQOL-BREF questionnaire are presented below.
Table 2 includes the results of the WHOQOL-BREF questionnaire in particular domains in the whole study group (n = 138).
Point assessment of current quality of life based on WHOQOL-BREF according to sex
| Kobiety / Women | Mężczyźni / Men | |||||||
|---|---|---|---|---|---|---|---|---|
| Dziedzina jakości życia / Quality of life domain | Min. | Max. | M | SD | Min. | Max. | M | SD |
| Ogólna jakość życia WHO1 / Overall quality of life WHO1 | 1 | 5 | 3,85 | 0,75 | 2 | 5 | 3,88 | 0,67 |
| Samoocena stanu zdrowia WHO2 / Self-evaluation of health state WHO2 | 1 | 5 | 3,58 | 0,81 | 1 | 5 | 3,24 | 1,09 |
| Dziedzina fizyczna DOM1 / Physical domain DOM1 | 9 | 17 | 13,05 | 1,68 | 11 | 15 | 13,16 | 1,31 |
| Dziedzina psychologiczna DOM2 / Psychological domain DOM2 | 9 | 20 | 14,71 | 1,93 | 7 | 17 | 14,6 | 2,1 |
| Dziedzina społeczna DOM3 / Social domain DOM3 | 4 | 20 | 14,88 | 2,57 | 11 | 20 | 14,84 | 2,34 |
In the scale of 1 to 5, a mean score for overall quality of life (WHO1) of the examined women was 3.85 ± 0.75, while in the case of men it was 3.88 ± 0.67. A mean score for self-evaluation of health state (WHO2) was 3.58 ± 0.81 in women and 3.24 ± 1.09 in men.
The Mann-Whitney U test was used to compare the quality of life in physically active and inactive participants both at a young age (tab. 3) and at the time of the research (tab. 4).
Comparison of results obtained by WHOQOL-BREF in the groups of physically active and inactive study participants at a young age
| Aktywni fizycznie / Physically active n = 87 | Nieaktywni fizycznie / Physically inactive n = 51 | |||||||||
|---|---|---|---|---|---|---|---|---|---|---|
| Dziedzina jakości życia / Quality of life domain | Min. | Max. | M | SD | Min. | Max. | M | SD | Z | p |
| Ogólna jakość życia WHO1 / Overall quality of life WHO | 1 | 5 | 3,91 | 0,69 | 1 | 5 | 3,76 | 0,87 | 0.93734 | 0,17361 |
| Samoocena stanu zdrowia WHO2 / Self-evaluation of health state WHO2 | 2 | 5 | 3,71 | 0,7 | 1 | 5 | 3,18 | 1,07 | 2.76791 | 0,0028 |
| Dziedzina fizyczna DOM1 / Physical domain DOM1 | 9 | 17 | 13,05 | 1,58 | 10 | 17 | 13,12 | 1,74 | -0.095 | 0,46414 |
| Dziedzina psychologiczna DOM2 / Psychological domain DOM2 | 9 | 20 | 14,83 | 1,92 | 7 | 19 | 14,45 | 2,24 | 1.13143 | 0,12924 |
| Dziedzina społeczna DOM3 / Social domain DOM3 | 11 | 20 | 15,01 | 2,19 | 4 | 20 | 14,63 | 3,34 | 0.68812 | 0,2451 |
Comparison of results obtained by WHOQOL-BREF in the groups of participants who were physically active and inactive at the time of the research
| Aktywni fizycznie / Physically active n = 85 | Nieaktywni fizycznie / Physically inactive n = 53 | |||||||||
|---|---|---|---|---|---|---|---|---|---|---|
| Dziedzina jakości życia / Quality of life domain | Min. | Max. | M | SD | Min. | Max. | M | SD | Z | p |
| Ogólna jakość życia WHO1 / Overall quality of life WHO1 | 1 | 5 | 4,02 | 0,67 | 1 | 5 | 3,58 | 0,75 | 3.13217 | 0,00087 |
| Samoocena stanu zdrowia WHO2 / Self-evaluation of health state WHO2 | 2 | 5 | 3,8 | 0,63 | 1 | 5 | 3,06 | 1,01 | 4.22657 | 0,00001 |
| Dziedzina fizyczna DOM1 / Physical domain DOM1 | 10 | 15 | 13,24 | 1,41 | 9 | 17 | 12,81 | 1,89 | 1.61752 | 0,05262 |
| Dziedzina psychologiczna DOM2 / Psychological domain DOM2 | 11 | 20 | 15,02 | 1,85 | 7 | 17 | 14,15 | 2,02 | 2.08811 | 0,01831 |
| Dziedzina społeczna DOM3 / Social domain DOM3 | 11 | 20 | 15,32 | 2,37 | 4 | 20 | 14,14 | 2,62 | 2.15159 | 0,01578 |
No significant differences in the quality of life were noted between the study participants who performed vigorous or moderate physical activity in the past and the respondents who did not do any physical activity or its level was poor (p > 0.05). Self-evaluation of health state was significantly higher among persons who were physically active at a young age (p = 0.0028).
Completely different results can be noted when comparing life quality of the study participants at the time of the research. Both self-evaluation of life quality and self-evaluation of health state were significantly higher in persons who performed vigorous or moderate physical activity (p < 0.05). Similar results were observed in the case of particular domains (p < 0.05 for psychological and social domains, p ≈ 0.05 – result at the limit of significance for physical domain).
Correlations of socio-demographic factors (sex, age, education, place of living) with the respondents’ quality of life were examined. Self-evaluation of health state among women (M = 3.58, SD = 0.81) was significantly higher than among men (M = 3.24, SD = 1.09) (t = 1.74988, p = 0.041197). No significant differences were found between women and men in the remaining domains of WHOQOL-BREF (p > 0.05). Compared to the age group of above 70 years, the subjects aged 50-69 demonstrated higher levels of self-evaluation of health state (t = 2.17534, p = 0.015667) and obtained higher scores in physical domain (t = 1.84193, p = 0.033832) and social domain (t = 2.35106, p = 0.010078). Quality of life assessment in the psychological domain was significantly higher in persons from rural areas (M = 15.75, SD = 1.98) than in those from urban areas (M = 14.55, SD = 1.92) (t = -2.34788; p = 0.010161). Education did not correlate with any of the life quality domains (p > 0.05).
The quality of life among elderly persons has become a crucial issue due to demographic changes that are brought about by population ageing. Studies indicate that senior citizens’ quality of life assessment scores differ significantly from general population [8]. Moreover, despite intensive research on the quality of life among elderly individuals in the last decade, there is a scarcity of publications on this issue.
The aim of the present study was, among other things, to define correlations between physical activity at a young age and physical fitness that determines the quality of life at an advanced age. The participants’ physical activity assessment depended on physical activity levels at a young age. Thus, as Pośpiech J. claims, physical education contributes to the development of the desired attitudes and habits connected with physical activity and leads to an improvement in current and future quality of life [9].
In the study, 16.7% of the respondents stated that their physical activity levels were currently lower than at a young age. In turn, 15.2% of the subjects exhibited an opposite tendency. According to Shiraly R. et al., changes in physical activity levels in the population of elderly persons were linked to physical, psychosocial and environmental determinants [10]. The authors noted correlations between inadequate physical activity and pain in lower extremities, hypertension, lack of motivation and a fear of injury.
Positive attitudes and behaviours conducive to active ageing are also developed owing to the Universities of the Third Age (UTAs). These organisations offer a variety of forms of physical, mental and social activity. In the group under examination, 65.9% of the respondents confirmed that UTAs in Warminsko-mazurskie region encouraged their students to undertake increased physical activity. The subjects preferred various forms of physical activity and pursued hobbies and interests they had at a young age. Gymnastics, walking/Nordic walking and cycling were the most common activities they engaged in. Similar forms of physical activity were preferred by UTA students from Wrocław and Bolesławiec [4].
The findings of the present study confirm significantly higher assessment of the quality of life in all the domains in physically active senior citizens. Krzepota J. et al. [11] pointed to a similar correlation among UTA students in Zachodniopomorskie region. Very active students declared high quality of life in the psychological and social domains. The authors reported that physical activity levels recommended by the WHO exerted a positive influence on results related to the quality of life. Possible differences were mainly noticeable in the assessment of various domains with regard to the presented levels of physical activity.
Haider S. et al. [12] revealed a correlation of daily physical activity, handgrip strength and balance with the quality of life in elderly persons (M = 83 years).
Moreover, Meneguci J. et al. [13] examined 3206 older adults in order to assess a correlation between sitting time and the quality of life. Those who sat the most during the day presented the worst scores in the physical and social domains.
The analysis of research results revealed higher self-evaluation of health state in women than in men (p < 0,05). A similar study (in terms of methodology) was carried out by Campos AC. et al. [14], who confirmed the influence of physical activity on the quality of life of elderly persons. They also reported significant similarities and differences in results depending on sex of the study participants. Women and men with high evaluation of physical and psychosocial health manifested higher levels of life quality. Socio-economic conditions were also significant determinants of high quality of life in the examined men.
In the present study, education did not correlate with the quality of life of the respondents. Constantinidou F et al. [15] also used the WHOQOL-BREF questionnaire to assess the quality of life with regard to demographic features in a large group of elderly individuals (n = 578). Demographic variables such as sex, age and education correlated significantly with the domains of life quality.
Other researchers also compared the scores of the quality of life in elderly persons according to the place of residence [16]. The participants residing in rural areas manifested considerably higher levels than those from urban areas in all the domains of WHOQOL-BREF. Our study confirms that UTA students from rural areas obtained significantly higher scores than their urban counterparts in the psychological domain.
Wenjun C. et al. [17] carried out research on a large group of older adults (n = 1168) aged ≥ 60 in order to determine correlations between the quality of life and depression. All the domains of WHOQOL-BREF except for the social one were negatively correlated with depression. In this group, 26.1% of the study participants met the criteria for depression. Furthermore, persons with depression were older, less educated, had a lower monthly income and reported insomnia more frequently.
In addition, Tavares DM. et al. [18] revealed significantly lower scores of life quality in all the domains of WHOQOL-BREF in the group of 1691 elderly persons from urban areas with low self-esteem.
Developing proper attitudes and habits related to physical activity at a young age leads to an improvement in the quality of life at an older age.
Physical activity of UTA students determines their quality of life and health state.
Socio-demographic factors such as sex, age and a place of living influence quality of life scores in WHOQOL-BREF domains.
Forms of physical activity offered by Universities of the Third Age encourage their students to undertake increased physical activity.