
Foot pain is one of the most common clinical symptoms of pes planus/flat foot/deformity reported by adults. For this reason, investigating the causes of flat foot as well as treatment methods is still an open issue. Borrelli is convinced of a multifactorial etiology of this complex foot pathology [1]; however, according to a number of authors, it results from the muscle and ligament system weakening (including tibialis posterior muscle) [2–4].
The primary goal of pes planus treatment is to improve the function of the feet. Depending on the level of morphological changes as well as pain intensity, the most common treatment procedures include surgeries [2,4,5], the use of orthotic devices [6] and physiotherapy. The available literature mainly consists of works that focus on exercises performed by children [7,8]. There is no uniform and clear concept regarding methods and protocols of flat foot therapy in adults.
The aim of the study was to assess the effects of selected exercises on an improvement in foot function and a reduction in foot pain through seeking answers to the following research questions: Do the selected exercises result in: (a) changes in plantar pressure distribution, (b) an improvement in functional tests results (a unipedal stance test with eyes open and closed as well as a bipedal calf raise test), (c) foot pain reduction?
The study group consisted of patients of the Traumatic Surgery and Orthopedic Clinic at the 5th Military Clinic Hospital with Policlinic in Krakow. The study participants were selected by an orthopaedist. Pes planus and foot pain were the main inclusion criteria. Fifteen females aged 22-81 (mean age – 56 years) were included in the study. The subjects differed substantially in terms of age, body weight and body height (tab. 1). No participant had ever undergone an operation of flat foot, hallux valgus or other foot deformities. None of the subjects had experienced any fractures of lower limb bones before.
Description of the study group with regard to body height, body weight, BMI and age
| minimum | 1 kwartyl/ | mediana/ | średnia/ | 3 kwartyl/ | maximum | +SD | |
|---|---|---|---|---|---|---|---|
| wzrost/height [m] | 1,48 | 1,58 | 1,6 | 1,603 | 1,64 | 1,71 | 0,1 |
| waga/weight [kg] | 51 | 72 | 74 | 79,08 | 86 | 103 | 16,4 |
| BMI [kg/m2] | 19,92 | 24,96 | 30,84 | 30,91 | 36,74 | 40,23 | 6,8 |
| wiek/age [rok/years] | 22 | 52 | 58 | 56,23 | 62 | 81 | 14,1 |
The data under analysis were collected from 13 participants. Two individuals were excluded from the analysis, i.e. one of them resigned from the exercise programme and did not turn up for the control test, while the other one performed exercises on certain days only (29% of the recommended exercise days). The individuals included in the analysis exercised at the level of over 50% of the recommended exercise days.
The exercise programme involved performing, unassisted at home, a daily set of 5 exercises for 6 weeks. The exercises included gastrocnemius stretching, tibialis posterior strengthening in a low and high position as well as balance exercises. Each patient was provided with detailed instructions (description of exercise performance, a photo and a number of repetitions) and a training diary (to record the details of performance). Moreover, each study participant was trained on how to perform the exercises. The number of exercise repetitions increased over time. All the subjects were also given necessary exercise tools. Prior to and following the programme, orthopaedic examinations were carried out by a doctor.
The Foot Posture Index (an examination performed by an orthopaedist), a plantar pressure distribution assessment performed on PEL 38 pedobarographic platform in ‘Zdrowie’ Rehabilitation Centre in Krakow), functional tests (unipedal stance test with eyes open and closed as well as a bipedal calf raise test) and the Foot and Ankle Outcome Score (FAOS), English version LK1.0 (translated into Polish by the authors of the present study) were applied to assess the results.
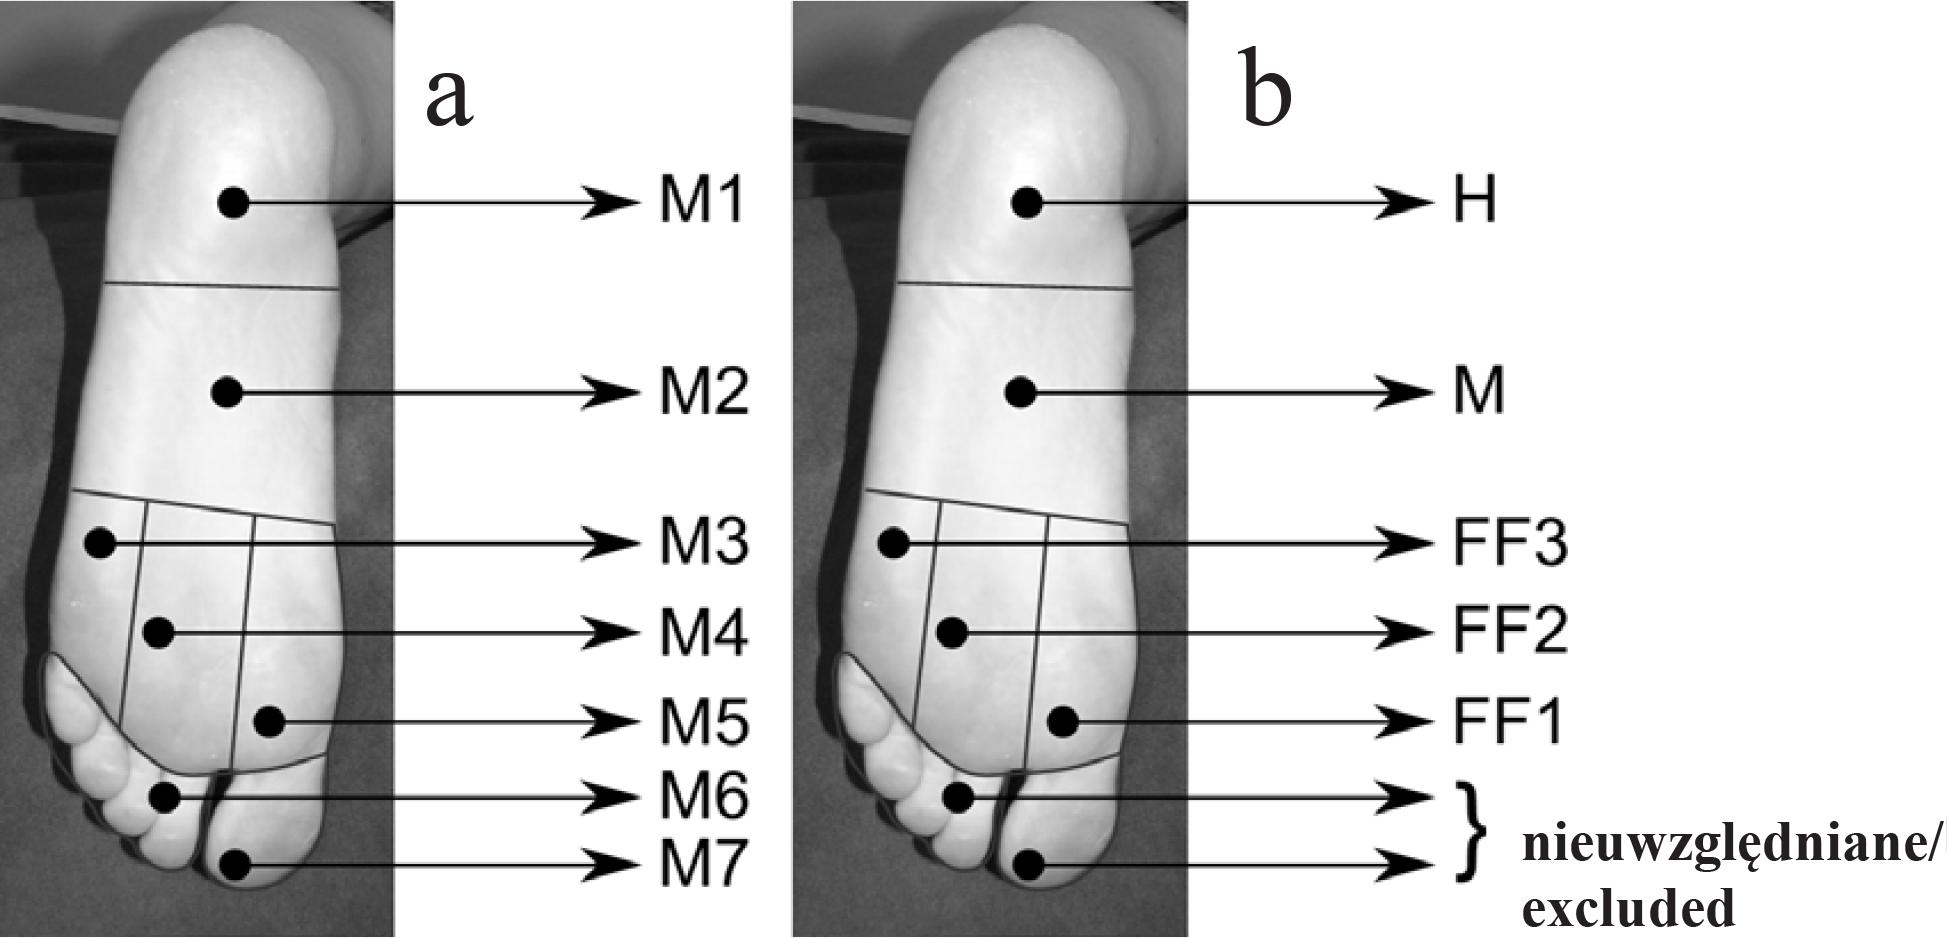
Plantar pressure distribution was determined with a 30-second postural examination on the PEL 38 pedobarographic platform. The examination was performed while the participant was standing barefoot in a bipedal position. To assess the results, Kernozek’s division of the plantar side of the foot into areas (fig. 1a) excluding toes (regions M6 and M7) was applied [9,10]. The following areas were taken into consideration: heel – H, midfoot – M, first metatarsal head – FF1, second and third metatarsal head – FF2 and fourth and fifth metatarsal head – FF3 (fig. 1b).
Maximum pressure, mean average pressure, total area as well as maximum pressures in particular foot areas were used in the analysis. To assess foot arch, pedobarographic criteria were applied, i.e. transverse arch (FF2< FF1 and FF3) and longitudinal arch (M<H and M<FF1, FF2 and FF3).
The unipedal stance test was done with eyes open and closed. The test involved performing three trials with eyes open and three trials with eyes closed on each leg. The study participants were asked to perform a unipedal stance and to maintain this position for as long as possible. Using a stopwatch, the examiner recorded the duration of each unipedal stance trial with an accuracy of 1 second. The test was stopped only if the participant lost balance, used the other leg or arm for support or managed to maintain the position for 60 seconds in the test with eyes open and for 30 seconds in the test with eyes closed. Afterwards, the results were compared with age norms (Springer et al.[11]).
In the bipedal calf raise test, the subjects performed bipedal calf raises in a standing position for 1 minute. The number of raises performed during 1 minute constituted the test result.
The Foot and Ankle Outcome Score (FAOS) was developed ‘to assess the patients opinion about a variety of foot and ankle-related problems’ [12]. The survey consists of 5 subscales: symptoms – 7 questions; pain – 9 questions; function, daily living (ADL) – 17 questions; function, sports and recreational activities (SR) – 5 questions; and quality of life (QOL) – 4 questions. When answering the questions, patients take the last week into consideration. In each question, they choose one answer (out of 5 possible options) which they find most appropriate. Each answer gets a score from 0 to 4 (according to the instructions provided) and a normalised score is calculated for each category. On a normalised scale, the score of 100 indicates no problems, while 0 points to extreme problems. Furthermore, in the course of this examination, the patients were asked to provide answers regarding the foot that caused greater problems.
The above-mentioned tools were employed prior to and following the exercise programme. Descriptive statistics and statistical tests were used to analyse the data. Shapiro-Wilk, Anderson-Darling, Pearson, Cramér-von Mises, Shapiro-Francia and Kolmogorov-Smirnov normality tests were applied to assess normality of distribution. Normal distribution data were analysed with the t-Student parametric test. The results whose distribution did not meet the normality criteria were analysed using the non-parametric Wilcoxon signed-rank test.
Based on the Foot Posture Index (FPI-6), three types of foot were distinguished in the examined individuals: highly pronated (10+), pronated (+6 to +9) and neutral (0 to +5) foot. The results are shown in table 2. After the therapy, the Foot Posture Index did not reveal any significant changes.
Description of the study group with regard to the Foot Posture Index
| liczba osób/number of participants | ||
|---|---|---|
| stopa lewa/ | bardzo pronująca/highly pronated | 1 |
| pronująca/pronated | 10 | |
| neutralna/neutral | 2 | |
| stopa prawa/right foot | bardzo pronująca/highly pronated | 2 |
| pronująca/pronated | 7 | |
| neutralna/neutral | 4 |
The obtained results concerning differences in pedobarographic parameters are illustrated in tables 3 and 4. The pedobarographic examination revealed a decrease in the values of maximum and average pressures and an increase in total area after the therapy. Except for two individuals, all study participants manifested a decrease in maximum and average pressures after the therapy. A maximum change in maximum pressure reached 187 g/cm2, while in the case of mean average pressure it was 55g/cm2.
Differences in the values of maximum pressure (Nmax), average pressure (Navg), in g/cm2, and total area (Area), in cm2, before and after the therapy
| minimum | 1 kwartyl/1st quartile | mediana/median | średnia/mean | 3 kwartyl/3rd quartile | maximum | +SD | |
|---|---|---|---|---|---|---|---|
| Nmax | -187 | -129 | -95 | -68,4 | -15 | 121 | 89,9 |
| Nśr/ Navg | -55 | -30 | -21 | -20,3 | -8 | 5 | 18,5 |
| Pow/Area | -7 | 4 | 18 | 21,2 | 34 | 71 | 22,4 |
Differences in pedobarographic parameters before and after the therapy (in g/cm2)
| strefa/ | minimum | 1 kwartyl/ | mediana/ | średnia/ | 3 kwartyl/ | maximum | +SD | |
|---|---|---|---|---|---|---|---|---|
| stopa lewa/left foot | H | -187 | -129 | -95 | -68,4 | -15 | 121 | 89,9 |
| M | -108 | -53 | -21 | -18,8 | 37 | 64 | 58,4 | |
| FF1 | -118 | -65 | -14 | -9,5 | 26 | 94 | 61,4 | |
| FF2 | -171 | -69 | -18 | -37,8 | 9 | 43 | 61,9 | |
| FF3 | -115 | -59 | -21 | -30,6 | 5 | 46 | 48,3 | |
| stopa prawa/right foot | H | -187 | -129 | -95 | -68,4 | -15 | 121 | 89,9 |
| M | -151 | -71 | -46 | -38,9 | 20 | 58 | 64,3 | |
| FF1 | -128 | -69 | -11 | -21,2 | 7 | 98 | 72,8 | |
| FF2 | -126 | -87 | -48 | -34,8 | 24 | 53 | 64,3 | |
| FF3 | -153 | -48 | -20 | -21,3 | 11 | 119 | 64,7 |
Depending on particular parameters, p-value in the t-Student test is as follows: maximum pressure (p=0.018), average pressure (p=0.002), total area (p=0.005) and maximum pressures in H (p=0.018), FF2 (p=0.048) and FF3 (p=0.041) for the left foot and H (p=0.018) and M (p=0.049) for the right foot. Therefore, we assume that differences for these parameters are statistically significant. Post-therapy values of maximum pressure, average pressure and maximum pressures in HL, FF2L, FF3L, HR and MR were found to be lower than pre-therapy values. However, total area increased after the therapy. In the case of such parameters as pressures in ML, FF1L, FF1R, FF2R and FF3R, there are no grounds for rejecting the null hypothesis.
Pre-therapy examination revealed that only one foot met the pedobarographic criterion of the transverse arch. After the therapy, the number of feet meeting this criterion increased to 3; however, there was not a single person who demonstrated proper transverse arch in both feet. As far as the longitudinal arch is concerned, the pedobarographic criterion before and after the therapy remained unchanged. Only two feet met the criterion and there was no participant whose both feet would be properly arched.
On average, an improvement was noted in all the tests, but it was only slight and not significant. Fifty percent of the study participants improved their scores in the unipedal stance test with eyes open both in the case of the right and left leg. Even more individuals made progress in the test with eyes closed. In the bipedal calf raise test, a score in post-therapy examination was higher by a maximum of 26 raises more than before the therapy. In the unipedal stance test with eyes open, the best result was improved by approx. 20 seconds.
The scores achieved in the unipedal stance test with eyes open and closed with reference to normative values documented by age and gender are shown in table 5. A slight increase was noted in the number of individuals who scored within the norms in all the tests with eyes open and closed. Following the therapy, almost 70% of the subjects met the standards in the tests with eyes open. The results of tests with eyes closed were more diverse.
Results of the unipedal stance test with eyes open and closed (expressed in percentage values) obtained by individuals who fell within normative values established by Springer et al [13]
| przed terapią/ | po terapii/ | ||||
|---|---|---|---|---|---|
| stanie jednonóż/unipedal stance | oczy otwarte/eyes open | P/R | najlepszy/best | 54 | 69 |
| średnia/mean | 54 | 69 | |||
| L | najlepszy/best | 69 | 69 | ||
| średnia/mean | 69 | 69 | |||
| oczy zamknię- te/ | P/R | najlepszy/best | 54 | 54 | |
| średnia/mean | 54 | 62 | |||
| L | najlepszy/best | 38 | 54 | ||
| średnia/mean | 46 | 62 |
The t-Student test is used for the following subscales: symptoms (p=0.057), ADL (p=0.013) and QOL (p=0.000002). Drawing on the obtained results, we assume that changes in two subscales, i.e. ADL and QOL are significant and that there occurs an improvement in these aspects. The Wilcoxon signed-rank test is applied in the case of pain (p=0.002) and SR (p=0.022). Based on the results of this test, we assume that there occurs an improvement in these subscales.
Table 6 shows FAOS results in a normalised scale. Progress was noted in all scales. The greatest improvement was found in QOL (by approx. 40 points in a normalised scale).
Differences in particular subscales of the FAOS survey before and after therapy (normalised scale)
| minimum | 1 kwartyl/ | mediana/ | średnia/ | 3 kwartyl/ | maximum | +SD | |
|---|---|---|---|---|---|---|---|
| objawy/symptoms | -7,1 | -3,6 | 3,6 | 6,0 | 14,3 | 25 | 10,3 |
| ból/pain | 0 | 5,6 | 8,3 | 15,8 | 22,2 | 41,7 | 15,2 |
| ADL | -5,9 | 0 | 11,8 | 14,3 | 27,9 | 47,1 | 17,6 |
| SR | 0 | 0 | 10 | 12,3 | 20 | 45 | 15,1 |
| QOL | 12 | 31,8 | 42 | 41,3 | 48,3 | 69 | 17,6 |
In all the study participants, foot pain and pes planus deformity coexisted. Even though it was foot pain (not flat foot) that constituted the inclusion criterion, the description of the study group showed that, in terms of pedobarography, there was not a single person with proper longitudinal and transverse arches in both feet.
Flat foot is a complex pathophysiomorphological condition that stems from the disturbed function of shank and foot muscles as well as from postural disorders. As a result of this pathology, there occurs a multiple pain syndrome with various clinical characteristics that is often ontogenetically conditioned. It can be experienced both in forefoot, midfoot and hindfoot. Together with deformity progression, the aforementioned complaints are accompanied with pains resulting from joint overload, development of degenerative changes or foot-shoe conflict. Due to the dependence on the deformity degree, it can be very hard to identify one painful area even in one patient. Moreover, the location of pain may change in the course of time and at successive stages of treatment, which was noted in the examined group.
In the available literature, there are very few studies that have focused on the assessment of exercise implementation in adults with foot pains that accompany flat foot. The effects of exercises in adults with flat foot were analysed by Panichawita et al., who conducted research on a small sample group, i.e. 5 persons [13]. A few more studies describe non-operative treatment procedures of posterior tibial tendon dysfunction. Some of them regard only the application of orthoses in conservative treatment of the dysfunction [14,15].
It is only in recent years that the relevance of implementing muscle-strengthening exercises in research protocols regarding conservative treatment of post erior tibial tendon dysfunction has been noted. The first report of this type was presented by Alvarez et al., who, when dealing with patients with stage I and II dysfunctions (as classified by Johnson and Strom), applied non-operative treatment protocol that included orthosis use alongside isokinetic exercises of ankle-related muscles and a high-repetition home exercise programme. On average, the rehabilitation programme lasted for 4 months and included about 10 physical therapy visits. The majority of patients had successful therapy outcomes, i.e. they experienced minimal pain or no pain at all, were not limited by walking distance and were able to perform a painless single support heel rise. The study also revealed that patients with stage I and II posterior tibial tendon dysfunction experienced weakness of long muscles of the foot and ankle. Therefore, it is justified to include strengthening exercises in the treatment programme [16].
A randomised controlled trial conducted by Kulig et al. is the only available study at a higher level of reliability that focuses on non-operative management of posterior tibial tendon dysfunction. Patients with stage I and II posterior tibial tendon dysfunctions (as classified by Johnson and Strom) were divided into three groups. Patients from group 1 had to wear orthoses and perform gastrocnemius and soleus muscle stretches. Patients from groups 2 and 3 followed the same procedure; however, the study participants from group 2 were additionally asked to follow a concentric resistive exercise programme, while those from group 3 performed eccentric resistive exercises. Afterwards, the effects of particular procedures were compared using the Foot Function Index (FFI), the 5-minute walk test and the analysis of pain experienced immediately after this test. The subjects performed concentric and eccentric exercises wearing shoes and using the TibPost Loader device. The programme lasted for 12 weeks, with patients doing home exercises twice a day. Moreover, they attended weekly control visits aimed at correcting exercise performance and adjusting loads. The adherence rate for wearing orthoses was 100%, while adherence to home exercise programme ranged from 39 to 98% (mean: 68%). Adherence to attending control visits was at a high level of 90-100%. A functional improvement and pain reduction were observed in all the participants, which proves the relevance of using orthoses in posterior tibial tendon dysfunction. Simultaneous participation in the rehabilitation programme that includes tibialis posterior exercises enhances therapy effectiveness. Patients who performed eccentric exercises were able to train with greater loads than individuals from the group where concentric exercises were applied. It is worth highlighting that in none of the patients did the symptoms exacerbate. The distance covered in 5 minutes did not increase, which probably resulted from the fact that no walking impairment was reported prior to the commencement of the programme [17].
The exercise programme implemented in the present study was supplemented with two exercises oriented at strengthening tibialis posterior and stretching gastrocnemius.
Due to insufficient scientific evidence, a study protocol for a randomised clinical trial (planning to evaluate non-operative treatment of pain associated with posterior tibial tendon dysfunction), with inclusion criteria similar to the research by Kulig [17], was published in 2015. It aims to randomly assign study participants to one of three different intervention groups. Group 1 will wear individualised foot orthoses only. Group 2 will wear foot orthoses and, additionally, perform eccentric exercises. Group 3 will receive sham foot orthoses only (without correcting to a neutral position of the foot). The intervention is intended to last for 12 weeks. The Foot Function Index (FFI), the Pain Disability Index (PDI), Visual Analogue Scale for pain (VAS) and a biomechanical examination with the use of force plates during standing as well as level and downstairs walking will be applied to assess the results. The planned study may contribute to enriching current knowledge regarding effectiveness and possibilities of conservative treatment of posterior tibial tendon dysfunction [18].
The study of Panichawita et al. included patients with pes planus aged 18-50. They received training three times a week (45 minutes per session) over a period of two months. The programme, supervised by a physiotherapist, involved calf muscle stretching exercises and strengthening tibialis posterior, peroneus longus, flexor digitorum longus, ankle dorsiflexors and intrinsic muscles as well as co-contraction of invertors and evertors. The study revealed increased tibialis posterior and peroneus longus strength, reduced pain and improved foot function. However, no significant differences were found in plantar pressure distribution when walking [13].
The findings of the present study also revealed significant changes in patients’ subjective opinions concerning pain, ADL, SR and QOL (based on the survey) despite shorter duration of the exercise programme. The fact that the participants performed regular daily exercises with an increasing number of repetitions may have been of essence. Still, changes in plantar pressure distribution were significant but not in all areas.
Considerable differences between the study participants concerning their age, body weight and body height were the major limitation of the study. Consequently, it was more difficult to draw conclusions. A complex clinical picture and the pathomechanism of changes within the foot and ankle joint, together with other simultaneous pathologies occurring in the remaining lower limb joints as well as in the spine and the temporomandibular joints constituted another difficulty. Despite the fact that home therapy is, to some extent, out of control, the use of appropriate monitoring tools (an exercise diary) makes it possible to record the course of the therapy. Functional assessment of the patients performed with the use of intrinsic foot muscle exercise programme can be a valuable addition to the research. McKeon [19,20] and Jam [21] emphasised the role of such exercises in terms of maintaining foot arch stability and its proper function. Without a doubt, further research is still needed to explore the effects of special exercises on foot pain and functioning.
Exercises applied in this study exert a positive influence on changes in plantar pressure distribution. They also improve functional capacity of the feet and reduce pain. The findings indicate that such exercises can be implemented in the therapy of adults with foot pain and flat foot and point to the need to carry out further research with a control group and randomisation.