
Figure 1
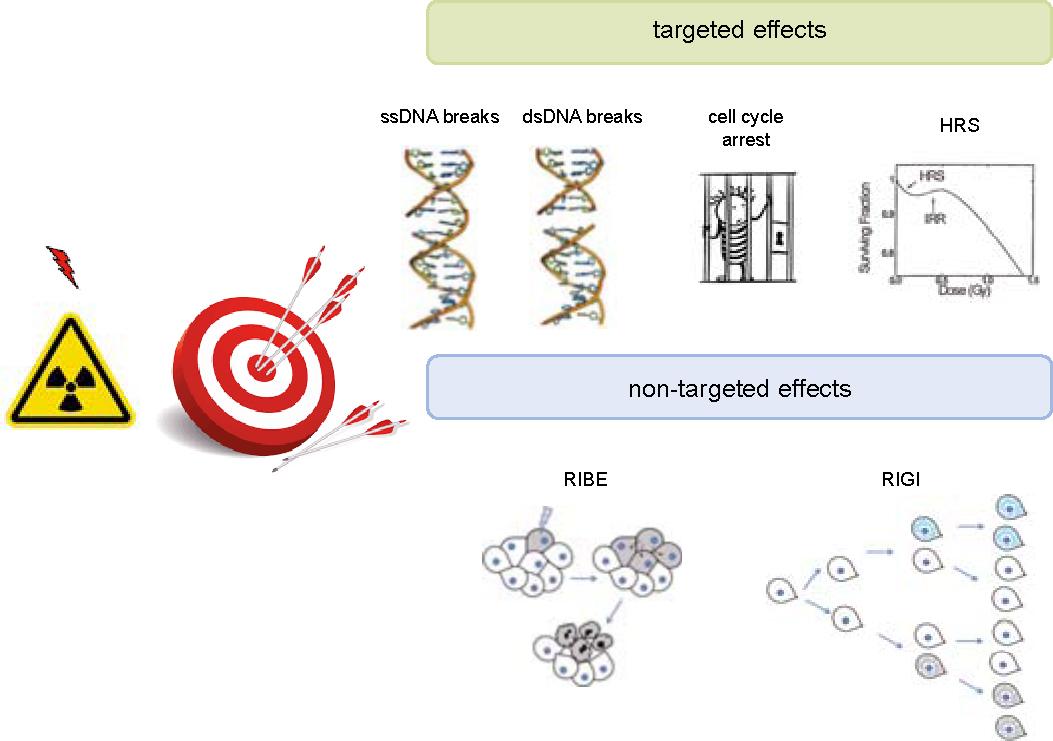
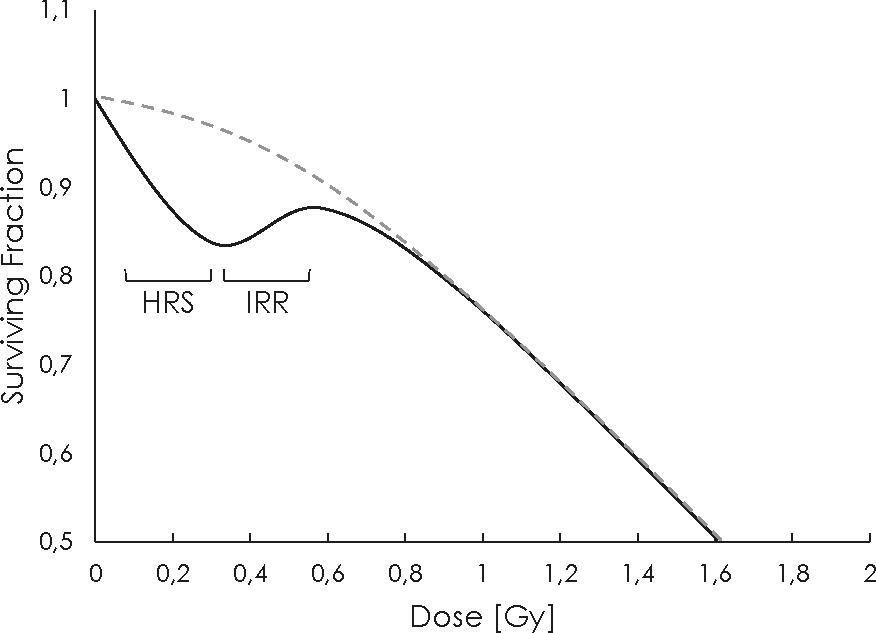
Figure 2
Dose ranges and sources of radiation exposure
| Dose range | Examples of exposure | |
|---|---|---|
| Very low doses | < 0.05 Gy | Mammography4, chest X-ray4 |
| Low doses | 0.05–0.5 Gy | Cardaic CT angiogram4 |
| Medium doses | 0.5–5 Gy | One fraction dose in standard fractionated radiotherapy5, dose absorbed by workers during Fukushima accident6 |
| High doses | 5–15 Gy | Intraoperative radiotherapy (as boost)7 |
| Very high doses | > 15 Gy | Intraoperative radiotherapy8, cumulative dose delivered during fractionated radiotherapy5 |