
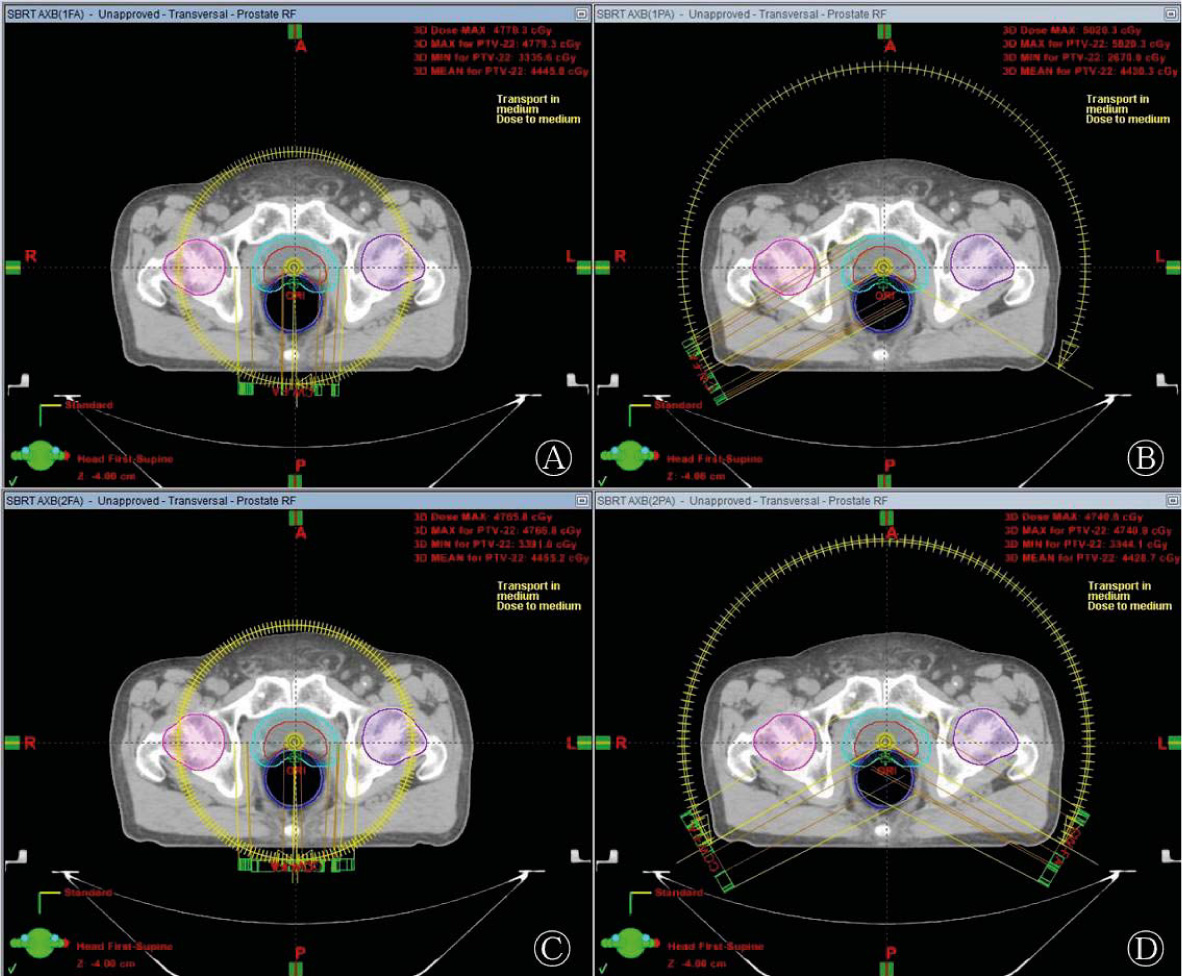
An arrangement of (A) one full arc (1FA), (B) one partial arc (1PA), (C) two full arcs (2FA), and (D) two partial arcs (2PA) in prostate SBRT-VMAT for the same patient.
Table 1
Dose volume constraints adopted for planning study.
| Volume | Rectum | Bladder | Femoral heads |
|---|---|---|---|
| V42.7Gy (100%) < 5% | V42.7Gy(100%) < 10% | V29.9Gy (70%) < 50% | |
| V38.4Gy (90%) < 15% | V34.7Gy (81%) < 25% | Dmax <29.9 Gy | |
| Constraints | V32.0Gy (75%) < 35% | V29.9 Gy(70%) < 50% | |
| V28.0Gy (65%) < 45% | |||
| V24.8Gy (58%) < 70% | |||
| V20.0Gy (47%) < 80% |
Dmax = the maximum dose; VxxGy = the volume receiving dose of xx Gy (x% of the prescription dose)
Table 2
Parameters used to calculated Niemierko’s EUD-based TCP and NTCP.
| Tissue | 100%dpf (Gy) | Fraction (#) | α | γ50 | TD50 (Gy) | TCD50 (Gy) | dpf (Gy) | α/β (Gy) |
|---|---|---|---|---|---|---|---|---|
| Prostate | 6.1 | 7 | -10 | 1.0 | 28.34 | 2 | 1.20 | |
| Rectum | 6.1 | 7 | 8.33 | 4 | 80 | 2 | 3.90 | |
| Bladder | 6.1 | 7 | 2 | 4 | 80 | 2 | 8.00 | |
| Femur | 6.1 | 7 | 4 | 4 | 65 | 2 | 0.85 |
= Alpha-beta ratio; 100%dpf = 100% dose per fraction; dpf = Parameters’ source data’s dose per fraction
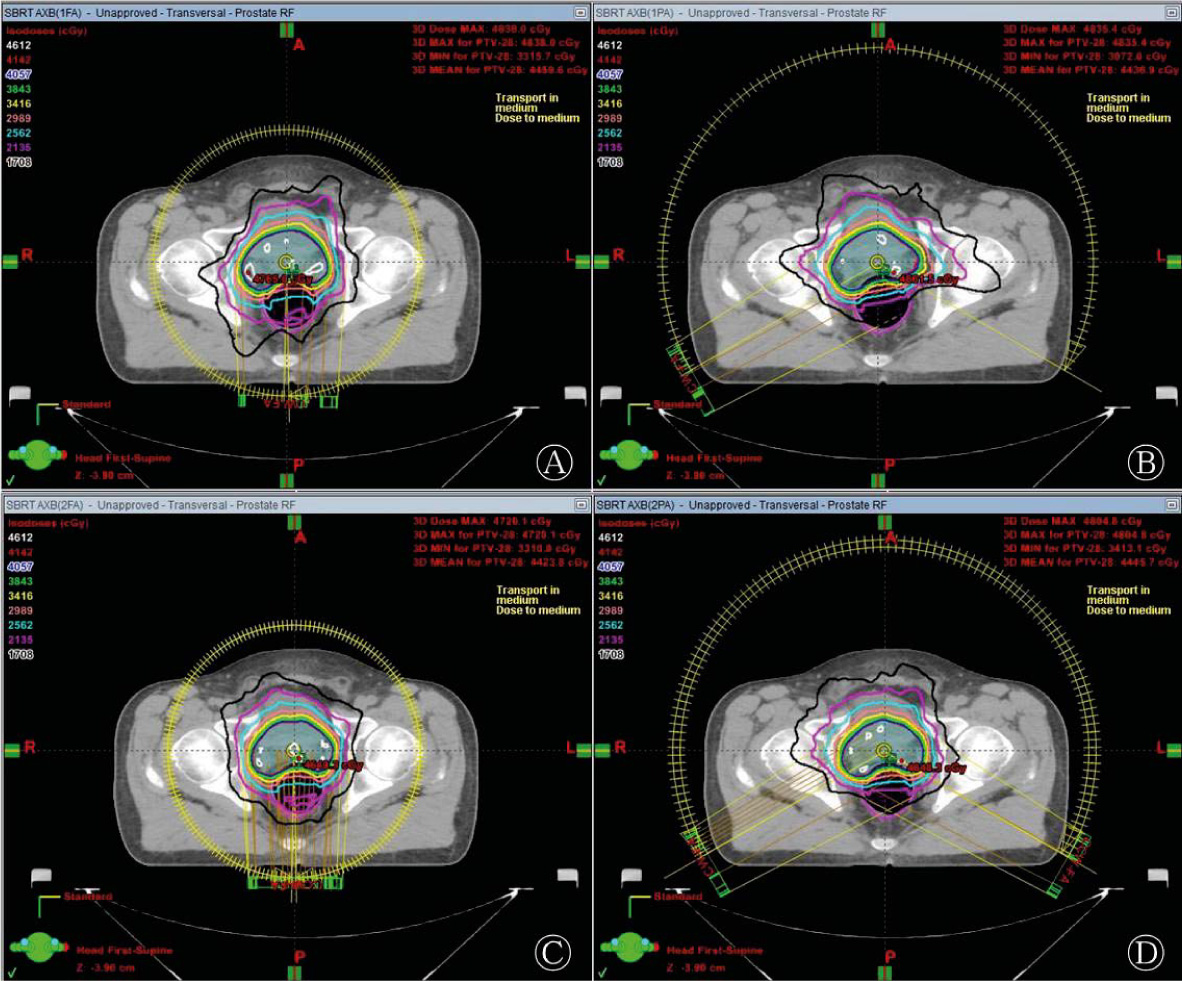
An example of the dose distributions achieved with (A) one full arc (1FA), (B) one partial arc (1PA), (C) two full arcs (2FA), and (D) two partial arcs (2PA) arrangement in prostate SBRT-VMAT for the same patient.
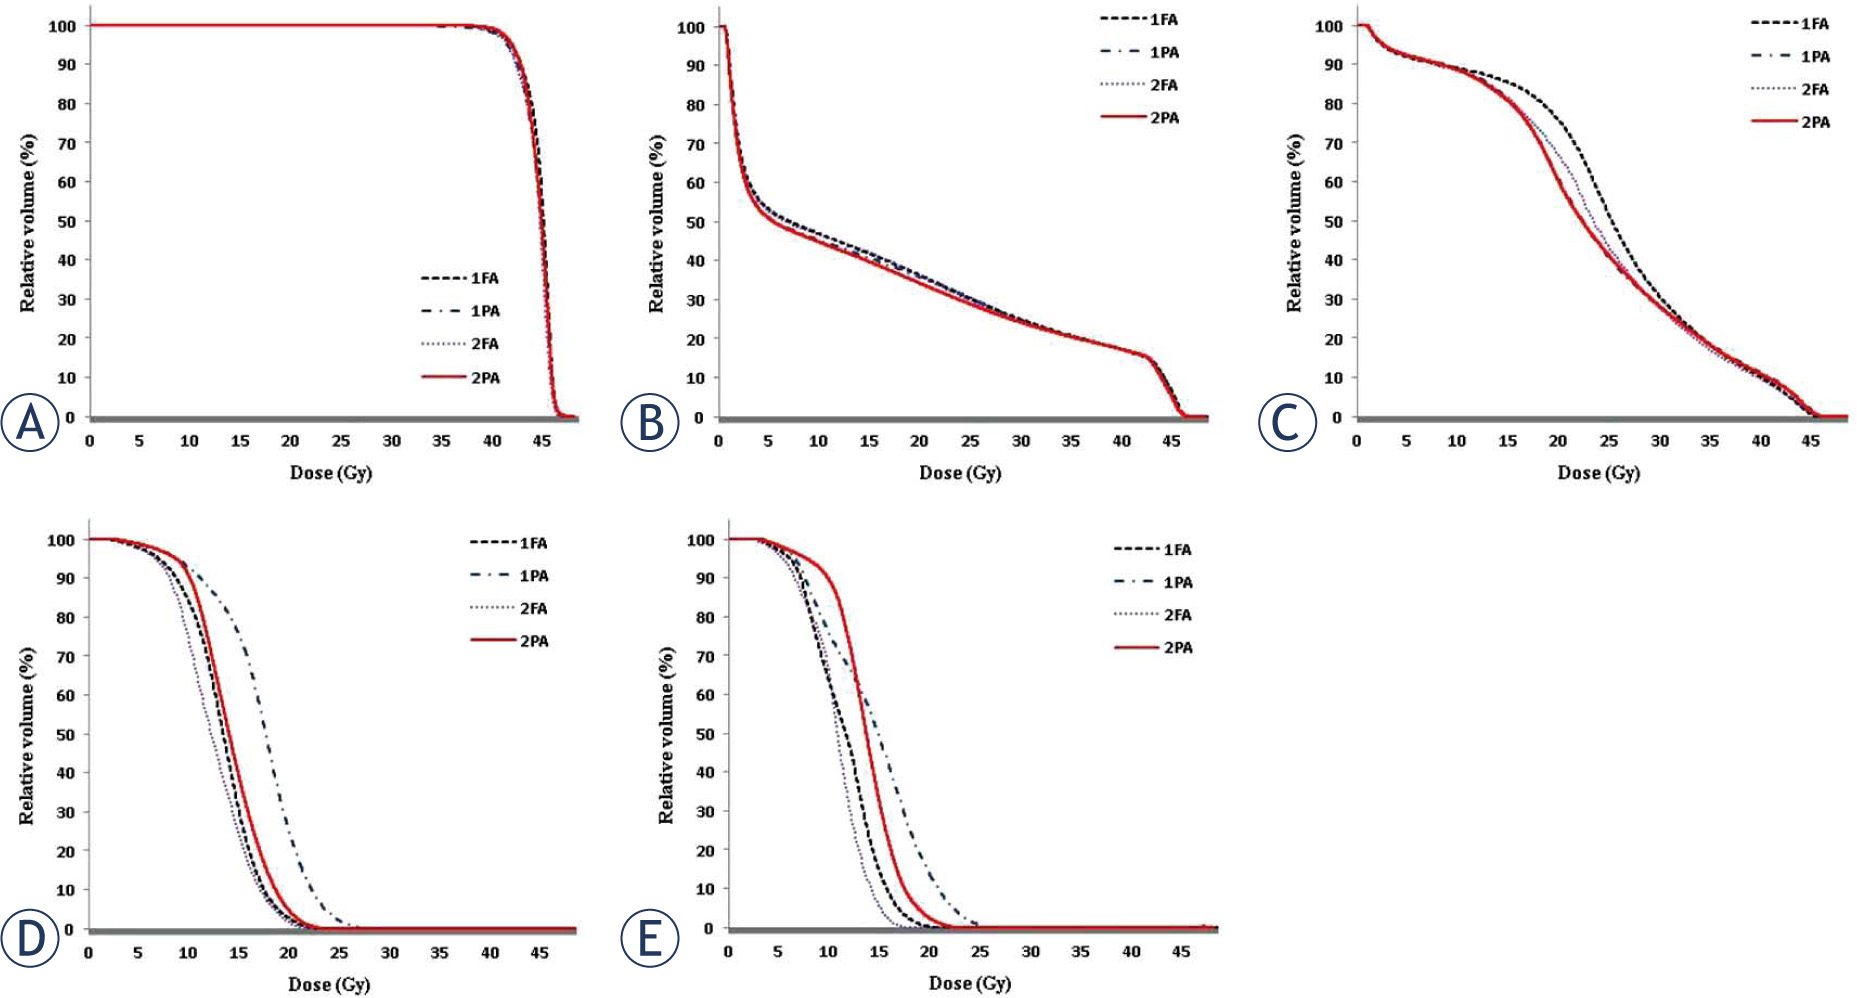
Average dose-volume histograms of the (A) PTV, (B) bladder, (C) rectum, (D) left femoral head, and (E) right femoral head from prostate SBRT-VMAT plans for four arc arrangements (1FA, 1PA, 2FA, and 2PA).
Table 3
Dosimetric results for target volumes in prostate SABR-VMAT plans using four arc arrangements.
| Avg ±SD (range) | ||||
|---|---|---|---|---|
| 1FA | 1PA | 2FA | 2PA | |
| CTV coverage | ||||
| D50% (Gy) | 44.9±0.4 | 44.6±0.5 | 44.5±0.5 | 44.4±0.3 |
| (44.4-45.4) | (44.1-45.1) | (44.0-45.3) | (44.0-44.7) | |
| D5% (Gy) | 46.0±0.1 | 45.9±0.1 | 45.9±0.1 | 45.8±0.2 |
| (45.9-46.1) | (45.7-46.0) | (45.8-46.0) | (45.7-45.9) | |
| D95% (Gy) | 43.5±0.5 | 43.1±0.4 | 43.1±0.6 | 42.8±0.2 |
| (43.0-44.2) | (42.8-43.5) | (42.6-43.9) | (42.7-43.1) | |
| V100% (%) | 98.4±1.8 | 97.9±0.0 | 97.8±3.8 | 97.6±2.0 |
| (95.5-100.0) | (95.0-99.8) | (95.2-100.0) | (94.2-99.9) | |
| PTV coverage | ||||
| Dmean | 44.3±0.2 | 44.2±0.1 | 44.1±0.3 | 44.3±0.1 |
| (44.2-44.6) | (44.0-44.4) | (44.0-44.6) | (44.2-44.5) | |
| Dmax | 48.8±0.8 | 49.5±0.9 | 48.5±1.1 | 49.0±1.4 |
| (47.8-49.8) | (48.4-50.5) | (47.2-50.0) | (47.4-50.5) | |
| Dmin | 33.0±0.4 | 32.3±0.0 | 32.8±0.8 | 33.7±0.3 |
| (32.4-33.2) | (31.9-33.7) | (32.1-33.9) | (33.4-34.1) | |
| D50% (Gy) | 44.6±0.3 | 44.5±0.2 | 44.4±0.4 | 44.5±0.2 |
| (44.2-45.0) | (44.3-44.8) | (44.1-45.0) | (44.3-44.8) | |
| D5% (Gy) | 46.1±0.2 | 46.1±0.1 | 46.1±0.2 | 46.0±0.1 |
| (45.9-46.3) | (45.9-46.2) | (45.9-46.3) | (45.9-46.2) | |
| D95% (Gy) | 41.5±0.3 | 41.4±0.2 | 41.3±0.3 | 41.7±0.1 |
| (41.1-41.8) | (41.2-41.8) | (41.0-41.7) | (41.6-41.9) | |
| V100% (%) | 87.5±1.9 | 86.6±1.2 | 87.7±1.5 | 88.1±1.0 |
| (85.1-90.2) | (85.0-87.8) | (85.8-89.3) | (87.1-89.9) | |
| Conformity | 1.05±0.00 | 1.04±0.01 | 1.03±0.01 | 1.05±0.01 |
| index | (1.02-1.03) | (1.02-1.04) | (1.02-1.04) | (1.02-1.03) |
| Conformation | 0.91±0.01 | 0.91±0.01 | 0.91±0.01 | 0.91±0.01 |
| number | (0.90-0.92) | (0.09-0.92) | (0.91-0.92) | (0.90-0.93) |
| Homogeneity | 0.10±0.01 | 0.11±0.00 | 0.11±0.01 | 0.10±0.00 |
| index | (0.09-0.12) | (0.10-0.11) | (0.10-0.12) | (0.09-0.10) |
Avg. = average; D5% = the dose received at least 5% volume; Dmean = the mean dose; Dmax = the maximum dose; Dmin = the minimum dose; D50% = the dose received at least 50% volume; D95% = the dose received at least 95% volume; SD = the standard deviation; V100% = the volume received 100% of prescription dose.
Table 4
Dosimetric results for organs at risk in prostate SABR-VMAT plans using four arc arrangements.
| Avg SD (range) | ||||
|---|---|---|---|---|
| IFA | 1PA | 2FA | 2PA | |
| Organs at risk | ||||
| Rectum Dmean (Gy) | 25.2±1.7 | 23.3±2.0 | 23.6±1.8 | 23.4±1.9 |
| (23.1-27.2) | (21.4-25.8) | (21.3-26.0) | (21.3-26.4) | |
| Rectum D2% (Gy) | 44.2±0.3 | 44.6±0.4 | 44.1±0.4 | 44.5±0.2 |
| (43.7-44.5) | (44.0-45.1) | (43.8-44.7) | (44.3-44.9) | |
| Rectum V95% (%) | 9.0±1.4 | 10.1±1.3 | 8.3±1.3 | 9.8±1.5 |
| (6.6-10.3) | (8.1-11.5) | (7.0-10.2) | (7.6-11.6) | |
| Rectum V80% (%) | 19.1±3.0 | 19.7±3.2 | 18.0±2.8 | 19.4±3.4 |
| (15.1-23.2) | (15.2-23.8) | (15.2-21.9) | (14.8-24.3) | |
| Rectum V50% (%) | 71.0±8.8 | 53.9±9.4 | 60.0±11.1 | 54.1±9.0 |
| (61.1-80.1) | (41.9-63.7) | (46.9-77.4) | (42.5-66.7) | |
| Rectum V20% (%) | 90.2±2.5 | 90.0±2.7 | 89.6±3.0 | 90.0±2.8 |
| (87.7-93.4) | (87.1-94.1) | (85.6-93.5) | (87.3-94.0) | |
| Bladder Dmean (Gy) | 19.0±6.9 | 18.7±7.1 | 18.5±6.1 | 18.3±6.9 |
| (13.4-31.1) | (13.2-31.0) | (15.7-29.0) | (12.9-30.4) | |
| Bladder D2% (Gy) | 45.6±0.2 | 45.6±0.2 | 45.5±0.3 | 45.6±0.4 |
| (45.5-45.8) | (45.3-45.9) | (45.0-45.8) | (45.3-46.4) | |
| Bladder V95% (%) | 21.2±11.1 | 21.4±11.1 | 20.9±10.5 | 21.4±11.3 |
| (10.5-39.3) | (10.6-39.4) | (10.3-37.7) | (10.7-39.9) | |
| Bladder V80% (%) | 25.6±11.9 | 26.2±11.9 | 25.7±11.1 | 26.0±12.0 |
| (16.6-46.4) | (16.5-46.3) | (16.6-44.6) | (16.3-46.2) | |
| Bladder V50% (%) | 40.4±13.6 | 38.6±12.6 | 39.5±12.4 | 38.2±12.9 |
| (29.4-64.1) | (28.5-60.5) | (29.2-60.7) | (27.5-60.6) | |
| Bladder V20% (%) | 54.4±17.0 | 52.5±16.1 | 54.1±17.4 | 52.1±16.1 |
| (37.2-79.1) | (36.4-76.5) | (37.0-79.4) | (36.2-76.1) | |
| Left femoral head | 12.8±1.8 | 18.7±2.3 | 12.7±2.4 | 13.9±1.4 |
| Dmean (Gy) | (10.5-15.1) | (16.9-22.7) | (9.3-14.9) | (11.7-15.3) |
| Left femoral head | 19.7±2.2 | 23.5±4.4 | 18.3±3.0 | 20.1±2.0 |
| D2% (Gy) | (16.9-21.8) | (15.6-26.1) | (13.4-20.7) | (16.7-21.8) |
| Right femoral | 10.8±0.9 | 13.3±2.5 | 12.4±1.7 | 13.7±2.1 |
| head Dmean (Gy) | (9.2-11.3) | (9.2-15.5) | (10.5-14.2) | (10.7-16.5) |
| Right femoral | 16.4±1.3 | 20.6±3.7 | 18.1±1.9 | 19.7±2.3 |
| head D2% (Gy) | (14.3-18.0) | (14.3-23.6) | (15.8-20.1) | (16.2-22.5) |
Avg. = average; D5% = the dose received at least 5% volume; Dmean = the mean dose; Dmax = the maximum dose; Dmin = the minimum dose; D50% = the dose received at least 50% volume; D95% = the dose received at least 95% volume; SD = the standard deviation; V100% = the volume received 100% of prescription dose.
Table 5
Average monitor unit and delivery time for prostate SBRT-VMAT plans using four arc arrangements.
| Beams | 1FA (Mean ± SD) | 1PA (Mean ± SD) | 2FA (Mean ± SD) | 2PA (Mean ± SD) |
|---|---|---|---|---|
| MU | 1575±63 | 1627±56 | 1646±97 | 1660±98 |
| Delivery time (min) | 1.01±0.02 | 0.69±0.01 | 2.00±0.01 | 1.36±0.02 |
Table 6
TCP of prostate tumor and NTCP of OARs for four arc arrangement plans.
| Beams | 1FA (Mean±SD) | 1PA (Mean±SD) | 2FA (Mean±SD) | 2PA (Mean±SD) |
|---|---|---|---|---|
| TCP (%) | ||||
| Prostate | 93.35±0.08 | 99.28±0.06 | 93.32±0.08 | 93.36±0.08 |
| NTCP (%) | ||||
| Rectum | 0.44±0.23 | 0.61±0.21 | 0.40±0.23 | 0.56±0.22 |
| Bladder | 0.01±0.02 | 0.01±0.03 | 0.00±0.01 | 0.00±0.02 |
| LT Femur | 0.00±0.00 | 0.00±0.00 | 0.00±0.00 | 0.00±0.00 |
| RT Femur | 0.00±0.00 | 0.00±0.00 | 0.00±0.00 | 0.00±0.00 |