
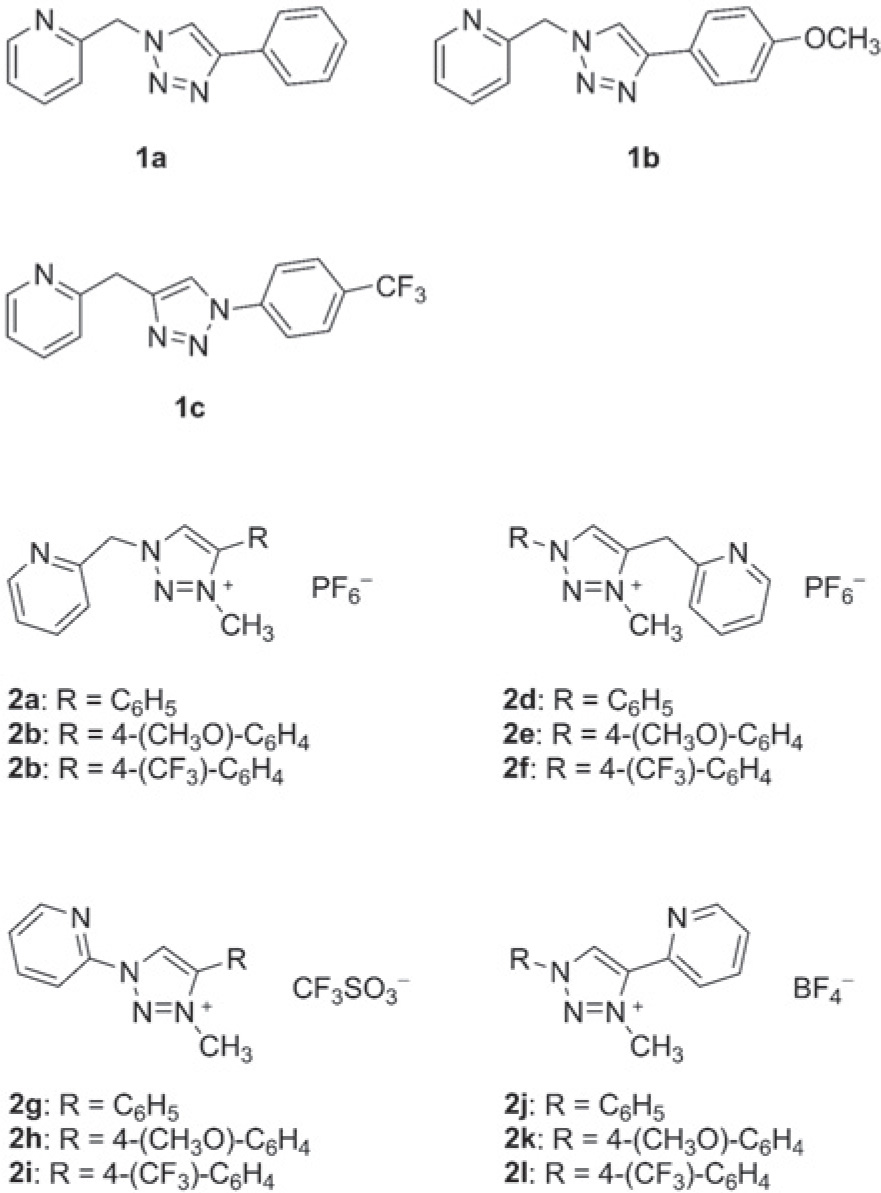
Figure 1
The structures of triazoles 1 and triazolium salts 2.
Table 1
IC50 values of triazolium salts and some parent triazoles against cervical carcinoma HeLa cells
| Cmpd | IC50 (μM)a |
|---|---|
| 1a | > 100 |
| 1b | > 100 |
| 1f | > 100 |
| 2a | 91.6 ± 3.9 |
| 2b | 57.0 ± 12.9 |
| 2c | > 100 |
| 2d | > 100 |
| 2e | 55.4 + 9.4 |
| 2f | –b |
| 2g | –c |
| 2h | 88.9 + 7.5 |
| 2i | 54.4 + 14.7 |
| 2j | 54.9 + 3.5 |
| 2k | > 100 |
| 2l | –c |
a IC50 is the concentration of the triazoles and triazolium salts inducing 50% cell growth inhibition after 72 h incubation. The results are shown as mean values of at least three experiments (± SD).
b Triazolium salt precipitated promptly after the addition to the growth medium and thus the cytotoxicity could not be measured accurately.
Table 2
Cytotoxic activity of 2b against different cell lines
| Cell line | IC50 (μM)b | T.I.c |
|---|---|---|
| HeLa | 57.0 ± 12.9 | 4.01 |
| HEp-2 | 87.0 ± 28.5 | 2.63 |
| 7T | 111.7 ± 7.6 | 2.05 |
| H460 | 29.7 + 4.5 | 7.69 |
| HCT-116 | 51.9 ± 7.2 | 4.40 |
| Fibroblasts | 228.5 ± 5.6 | – |
HeLa = cervical carcinoma cells; HEp-2 = laryngeal carcinoma cells; 7T = carboplatin and cisplatin-resistant HEp-2 subline; H460 = large cell lung carcinoma cells; HCT-116 = colorectal carcinoma cells; Fibroblasts = normal primary fibroblasts. The results are shown as mean values of three experiments (±SD).
Table 3
Effect of compound 2b on the cell cycle of H460 cells
| Conc. (μM) | 24 h | 48 h | 72 h | |||||||||
|---|---|---|---|---|---|---|---|---|---|---|---|---|
| G1 | S | G2/M | subG1 | G1 | S | G2/M | subG1 | G1 | S | G2/M | subG1 | |
| 0 | 54 | 31 | 15 | 2 | 59 | 26 | 15 | 2 | 73 | 13 | 14 | 2 |
| 29.7 | 61 | 24 | 15 | 2 | 61 | 26 | 13 | 5 | 65 | 17 | 18 | 6 |
| 110 | 78 | 9 | 13 | 3 | 78 | 9 | 13 | 15 | 79 | 5 | 16 | 35 |
H460 cells were treated for the indicated time period with 2b, stained with propidium iodide and analysed by flow cytometry. Cell cycle distribution was assessed as described in the Materials and methods section.
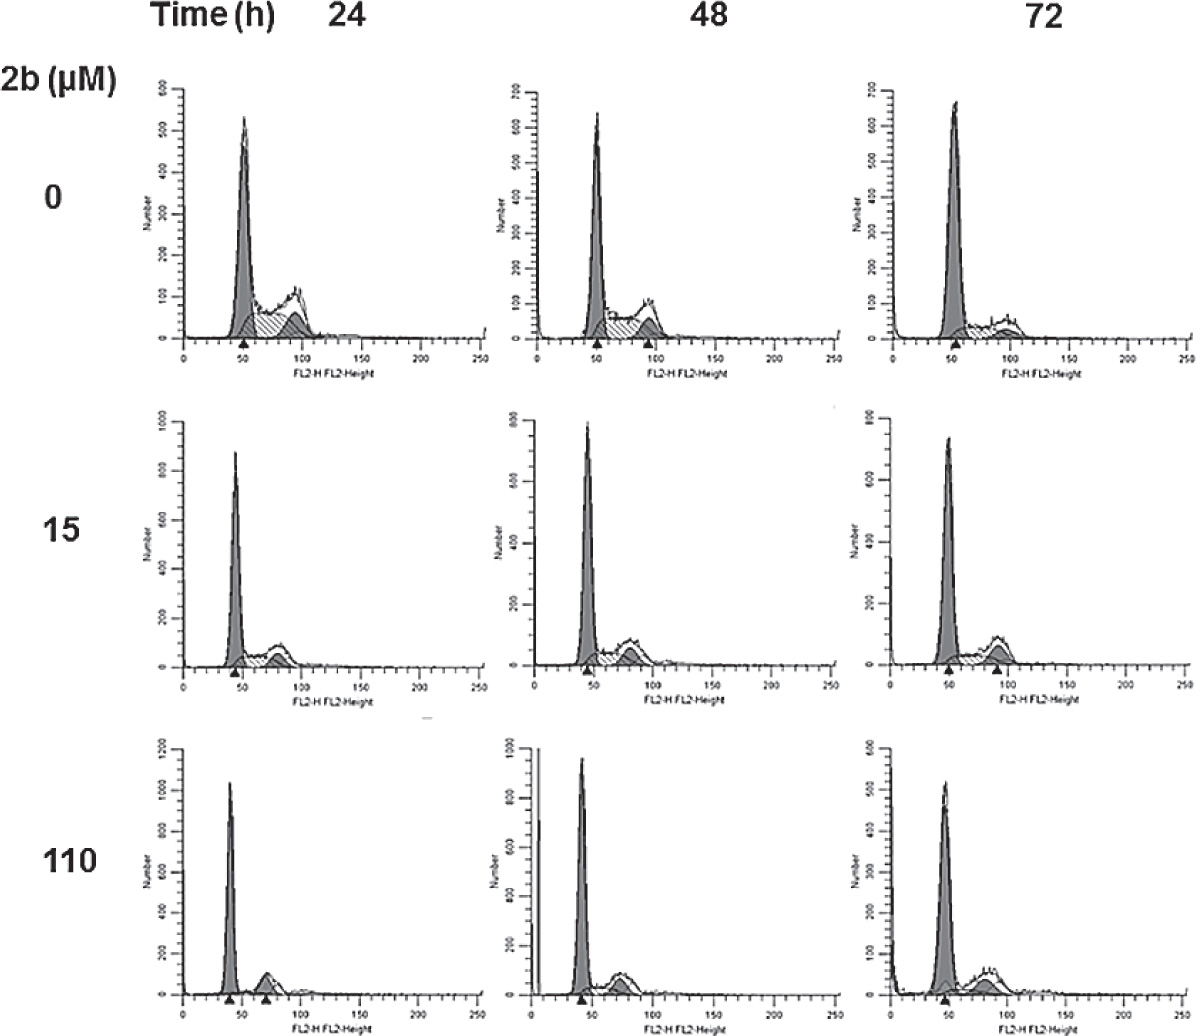
Figure 2
Effects of 2b on the cell cycle of H460 cells. Logarithmically growing H460 cells were treated with 29.7 and 110 μM of 2b for indicated period of time. Afterwards they were harvested for cell cycle analysis measured by FACS as described in Materials and methods. Representative data of three experiments are shown.
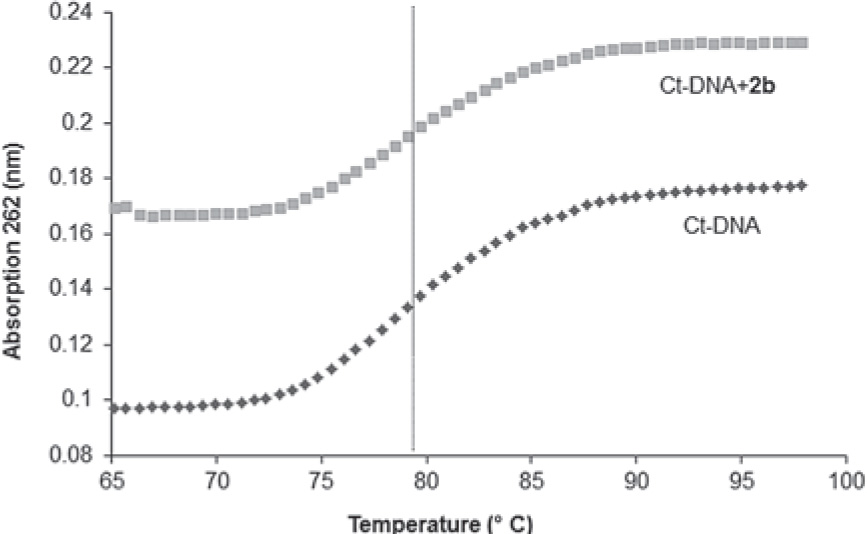
Figure 3
DNA as possible target of compound 2b. Thermal denaturation curves of ct-DNA (c(ct-DNA) = 2 x 10⁻⁵ M, r[compound]/[ct-DNA] =0.3) at pH 7.0 (sodium cacodylate buffer, I = 0.05 M) upon addition of compound 2b. Error in DTm values: ±0.5°C.
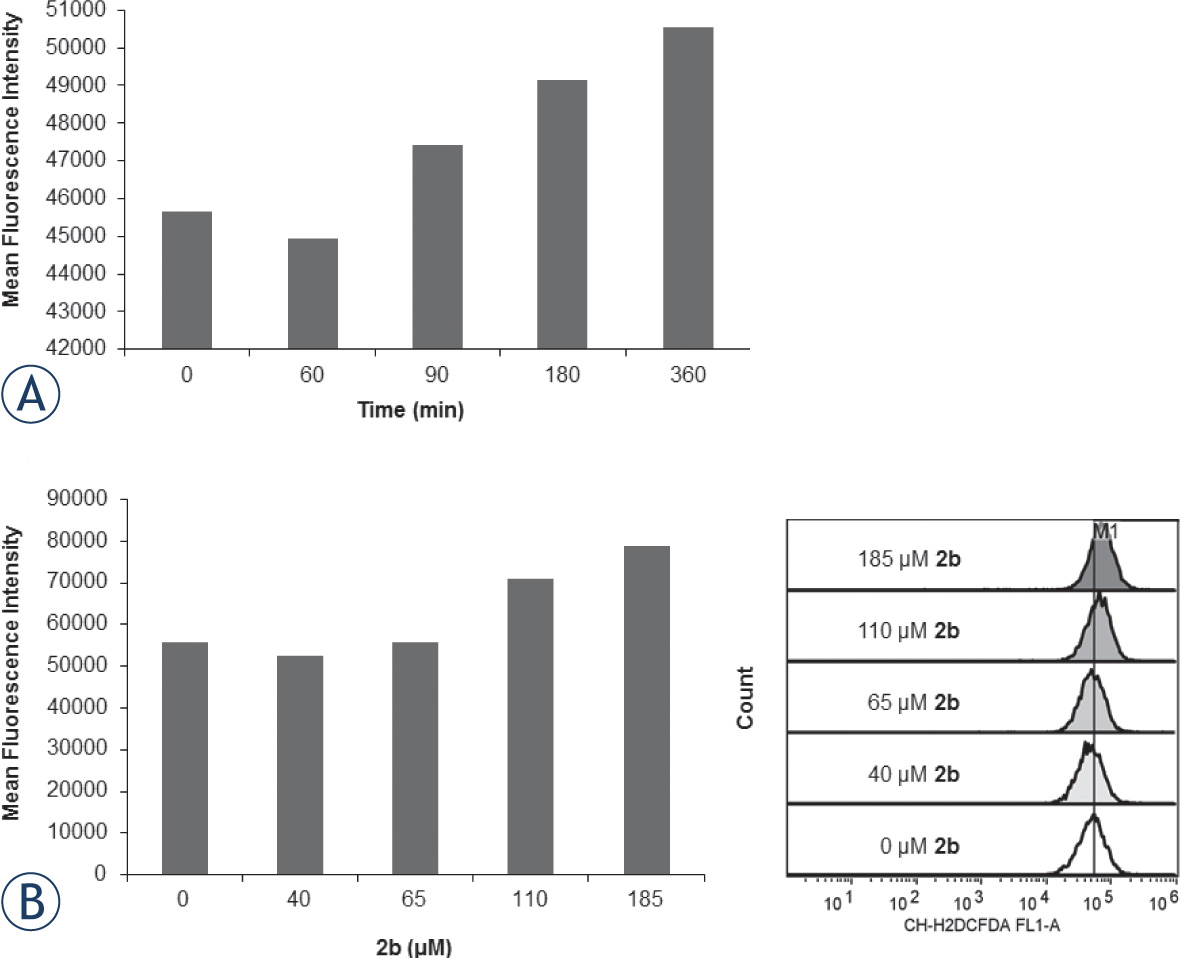
Figure 4
Formation of ROS by 2b in H460 cells. Logarithmically growing H460 cells were stained for 1 hour with 10 mM CM-H2DCFDA and then either treated with 110 μM 2b during indicated time points (A) or treated with indicated concentrations of 2b for 180 min (3 hours) (B). Afterward ROS formation was determined by flow cytometry as described in Materials and methods section. Dose-dependent formation of ROS was additionally presented by cell count and fluorescence intensity of CMH2DCFDA. M1 line is positioned to designate MFI value of the non-treated sample (white histogram) compared to signals obtained upon cell treatment with indicated concentrations of 2b.
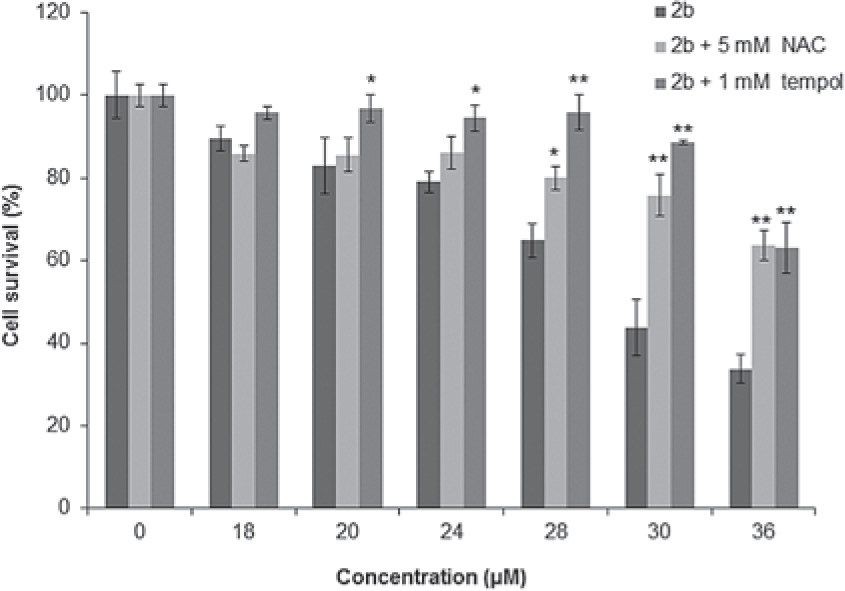
Figure 5
The effects of ROS scavenger on survival of H460 cells treated with 2b determined by MTT assay. H460 cells were seeded and next day pretreated for 2 hours with 5 mM of NAC or 1 mM tempol. Afterwards different concentrations of 2b were added. The cell survival was determined 72 hours later by MTT assay as described in Materials and methods section. Each point represents the mean ±SD of at least three independent experiments. All data are expressed as the average percentage of survival values relative to an untreated control ± SD or samples treated with antioxidants alone. The significance in differences is indicated (*, P < 0.05; **, P < 0.01).
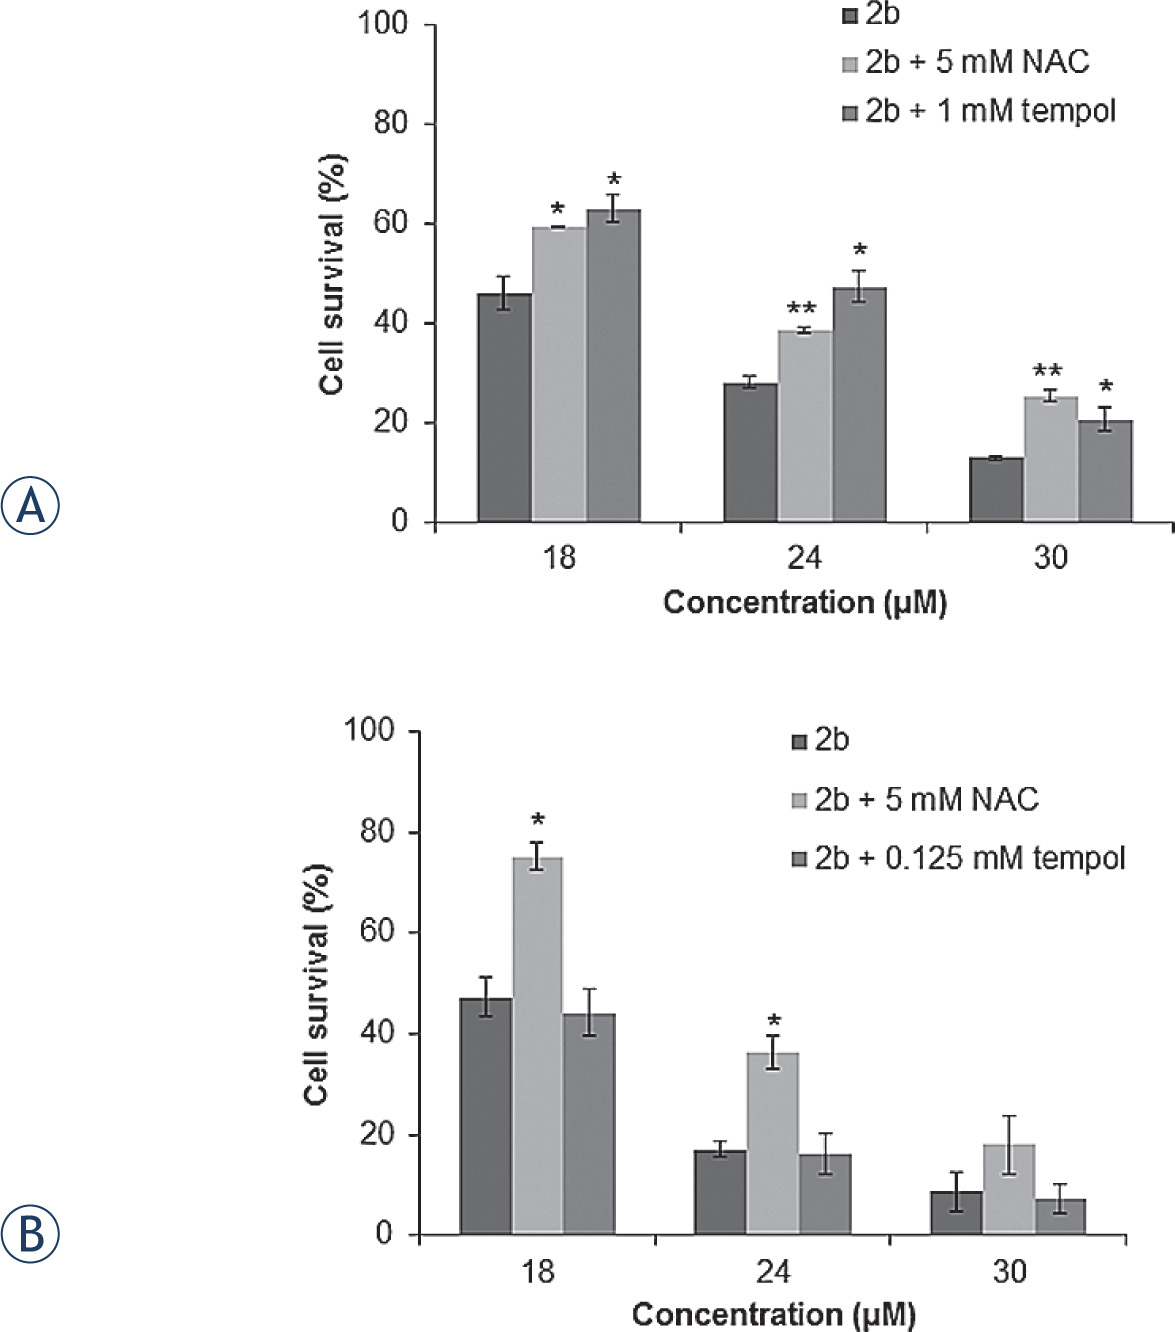
Figure 6
The effect of ROS scavenger on survival of HEp-2 (A) and H460 (B) cells treated with 2b determined by colony-forming assay. HEp-2 and H460 cells were seeded and next day pretreated for 2 hours with 5 mM of NAC or 1 mM (HEp-2 cells) or 0.125 mM (H460 cells) tempol. Afterwards different concentrations of 2b were added. Ten days later the colonies were counted. Non-treated cells and cells treated with antioxidants alone were used as controls. Each point represents the mean ±SD of at least three independent experiments. All data are expressed as the average percentage of survival values relative to an untreated control ± SD or samples treated with antioxidants alone. The significance in differences is indicated (*, P < 0.05; **, P < 0.01).