
Table 1
Comparison of patient and surgical characteristics between infected and non-infected group
| Characteristic | Total N=200 | No infection N=132 | Infection N=68 | p-value | Correctede p-value | |
|---|---|---|---|---|---|---|
| Age (years) | 62.8 (11.3) | 62.2 (11.0) | 63.8 (11.9) | 0.3787f | 1 | |
| Gender | male | 131 (65.5%) | 86 (65.2%) | 45 (66.2%) | 1g | 1 |
| female | 69 (34.5%) | 46 (34.8%) | 23 (33.8%) | |||
| ASAscore | I | 14 (7%) | 12 (9.1%) | 2 (2.9%) | 0.0503h | 0.8546 |
| II | 105 (52.5%) | 74 (56.1%) | 31 (45.6%) | |||
| III | 76 (38%) | 42 (31.8%) | 34 (50%) | |||
| IV | 5 (2.5%) | 4 (3%) | 1 (1.5%) | |||
| Diabetes mellitus | no | 161 (80.5%) | 110 (83.3%) | 51 (75%) | 0.2222g | 1 |
| yes | 39 (19.5%) | 22 (16.7%) | 17 (25%) | |||
| BMI (kg/m2) | 27.2 (4.3) | 27.3 (4.1) | 27.2 (4.6) | 0.8461f | 1 | |
| Phase anglea(°) | 5.4 (1.0) | 5.5 (1.0) | 5.3 (1.1) | 0.4632f | 1 | |
| Illness markera | 0.81 (0.04) | 0.81 (0.04) | 0.81 (0.04) | 0.8567f | 1 | |
| Dry lean body massa(kg) | 12.2 (9.8–16.5) | 12.8 (9.9–16.5) | 11.3 (8.8–16.5) | 0.1852† | 1 | |
| Hematocritb | ≥ 38% | 100 (50%) | 66 (50%) | 34 (50%) | 1h | 1 |
| 30–37% | 87 (43.5%) | 57 (43.2%) | 30 (44.1%) | |||
| 26–29% | 12 (6%) | 8 (6.0%) | 4 (5.9%) | |||
| 21–25% | 1 (0.5%) | 1 (0.8%) | 0 (0%) | |||
| Albuminb(g/l) | 42.1 (3.6) | 42.4 (3.3) | 41.6 (4.0) | 0.1583f | 1 | |
| Tumour site | rectum | 137 (68.5%) | 84 (63.6%) | 53 (77.9%) | 0.0909h | 1 |
| colon | 60 (30%) | 46 (34.8%) | 14 (20.6%) | |||
| rectum + colon | 3 (1.5%) | 2 (1.5%) | 1 (1.5%) | |||
| Stage (TNM) | 0 | 3 (1.5%) | 2 (1.5%) | 1 (1.5%) | 0.0265h | 0.477 |
| I | 27 (13.5%) | 21(15.9%) | 6 (8.8%) | |||
| II | 42 (21%) | 34 (25.8%) | 8 (11.8%) | |||
| III | 109 (54.5%) | 66 (50%) | 43 (63.2%) | |||
| IV | 19 (9.5%) | 9 (6.8%) | 10 (14.7%) | |||
| Preoperative RT/CTX | no | 82 (41%) | 62 (47%) | 20 (29.4%) | 0.0251g | 0.477 |
| yes | 118 (59%) | 70 (53%) | 48 (70.6%) | |||
| Antibiotic prophylaxis | < 24 hours | 54 (27%) | 35 (26.5%) | 19 (27.9%) | 0.9404h | 1 |
| 24 hours | 132 (66%) | 87 (65.9%) | 45 (66.2%) | |||
| > 24 hours | 14 (7%) | 10 (7.6%) | 4 (5.9%) | |||
| Surgical procedure Rectum resection | LAR | 86 (43%) | 62 (47%) | 24 (35.3%) | 0.0034h | 0.0749 |
| Miles + Hartmann | 50 (25%) | 23 (17.4%) | 27 (39.7%) | |||
| Colon resection | 64 (32%) | 47 (35.6%) | 17 (25%) | |||
| Synchronous resection of liver metastases | no | 186 (93%) | 126 (95.5%) | 60 (88.2%) | 0.0784h | 1 |
| yes | 14 (7%) | 6 (4.5%) | 8 (11.8%) | |||
| Duration of surgery (min) | 170 (130–220) | 160 (120–196.2) | 200 (150–242.5) | < 0.0001† | 0.0004 | |
| Loss of blood (ml) | 500 (300–800) | 400 (200–675) | 600 (400–1000) | < 0.0001† | 0.0003 | |
| Temperaturec(°C) | 35.3 (0.6) | 35.3 (0.5) | 35.3 (0.7) | 0.8719f | 1 | |
| Perioperatived transfusion of PRBC (ml) | 0 (0–606.2) | 0 (0–326.2) | 345 (0–842.5) | < 0.0001† | 0.0009 | |
| SIRS 1 (POD 1)no | 138 (71.1%) | 95 (74.8%) | 43 (64.2%) | 0.1657g | 1 | |
| yes | 56 (28.9%) | 32 (25.2%) | 24 (35.8%) | |||
| SIRS 2 (POD 2) | no | 147 (75.4%) | 100 (78.7%) | 47 (69.1%) | 0.1895g | 1 |
| yes | 48 (24.6%) | 27 (21.3%) | 21 (30.9%) | |||
| SIRS 3 (POD 3) | no | 161 (82.6%) | 107 (84.3%) | 54 (79.4%) | 0.5151g | 1 |
| yes | 34 (17.4%) | 20 (15.7%) | 14 (20.6%) | |||
| SIRS 4 (POD 4) | no | 149 (77.2%) | 104 (83.2%) | 45 (66.2%) | 0.012g | 0.2392 |
| yes | 44 (22.8%) | 21 (16.8%) | 23 (33.8%) | |||
| SIRS 5 (POD 5) | no | 144 (80.9%) | 99 (87.6%) | 45 (69.2%) | 0.005g | 0.1055 |
| yes | 34 (19.1%) | 14 (12.4%) | 20 (30.8%) | |||
| Re-operation | no | 188 (94%) | 132 (100%) | 56 (82.4%) | < 0.0001h | < 0.0001 |
| yes | 12 (6%) | 0 (0%) | 12 (17.6%) | |||
ASA = American Society of Anesthesiologists; BMI = body mass index; CTX – chemotherapy; Hartmann = proctosigmoidectomy; LAR = low anterior rectum resection; Miles = abdominoperineal rectum resection; POD = postoperative day; PRBC = packed red blood cells; RT = radiotherapy; SIRS = systemic inflammatory response syndrome; TNM = classification of malignant tumors (Tumour, Nodes, Metastasis)
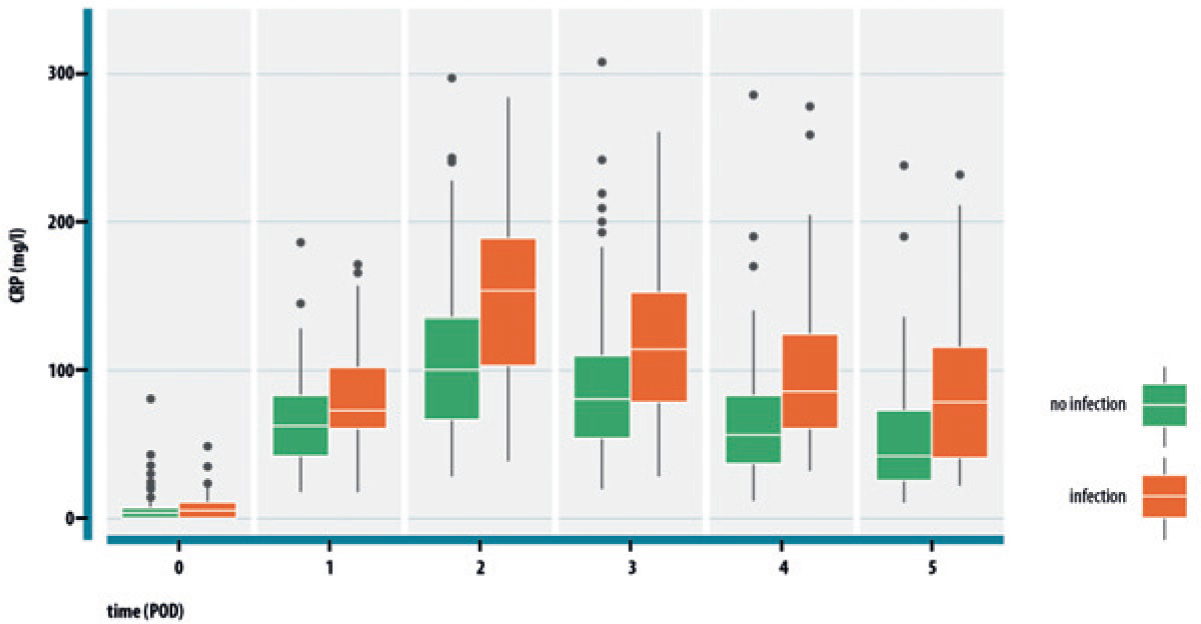
The dynamics of CRP shown with median for infected/non-infected group 5 days after colorectal surgery. The width of the box shows the interquartile range. The distal points of vertical line show the highest and the lowest values of CRP.
CRP = C-reactive protein; POD = postoperative day
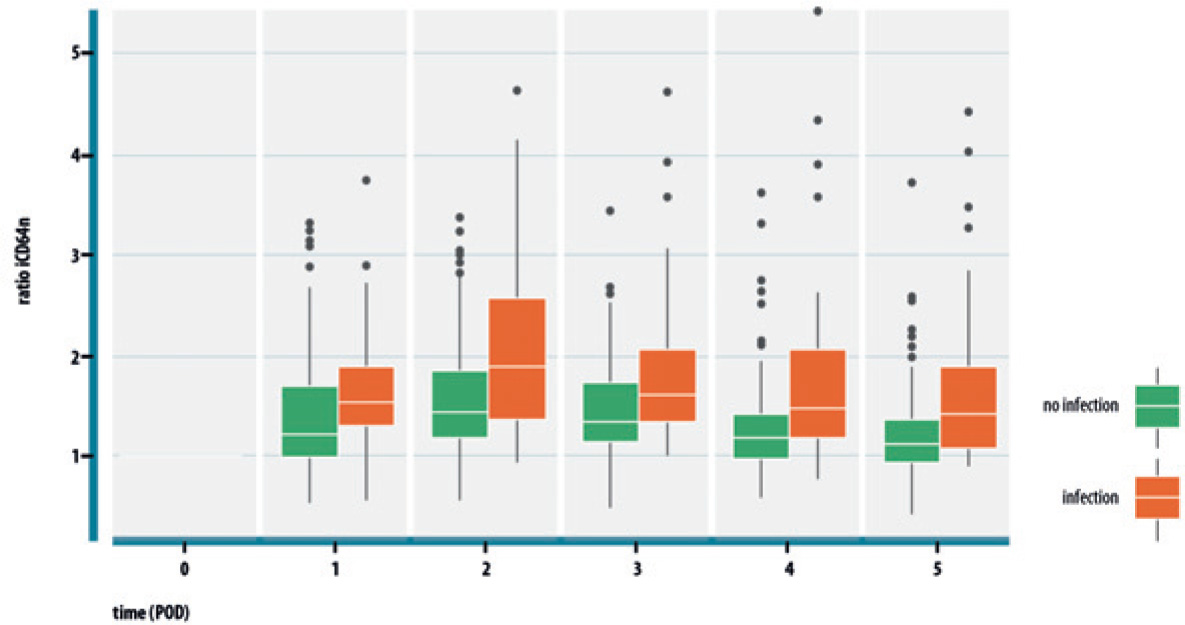
The dynamics of the ratio iCD64n shown with median 5 days after colorectal surgery. The width of the box shows the interquartile range. The distal points of vertical line show the highest and the lowest values of the ratio iCD64n.
iCD64n = index CD64n
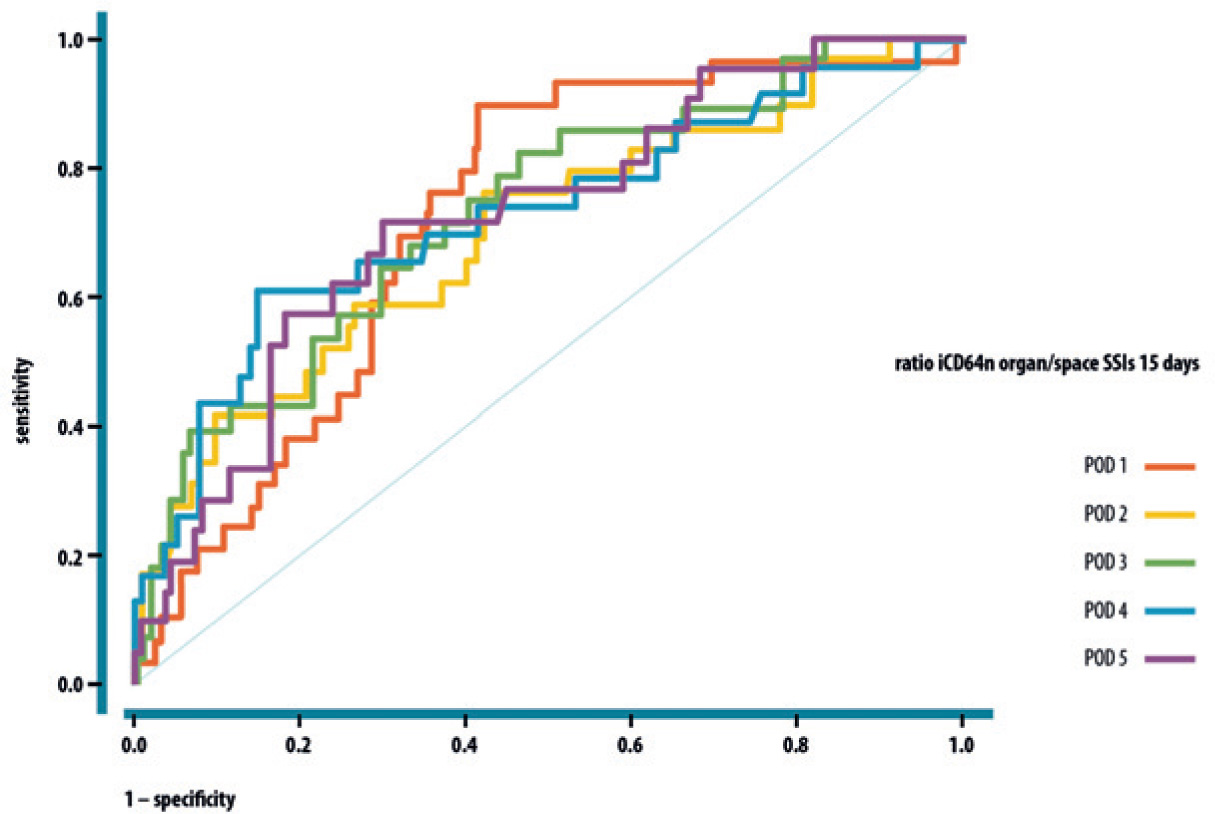
ROC curve for the ratio iCD64n POD1-POD5 as a predictor of organ/space SSIs 15 days after colorectal surgery.
iCD64n = index CD64n; POD = postoperative day; ROC = receiver operating characteristic; SSIs = surgical site infections
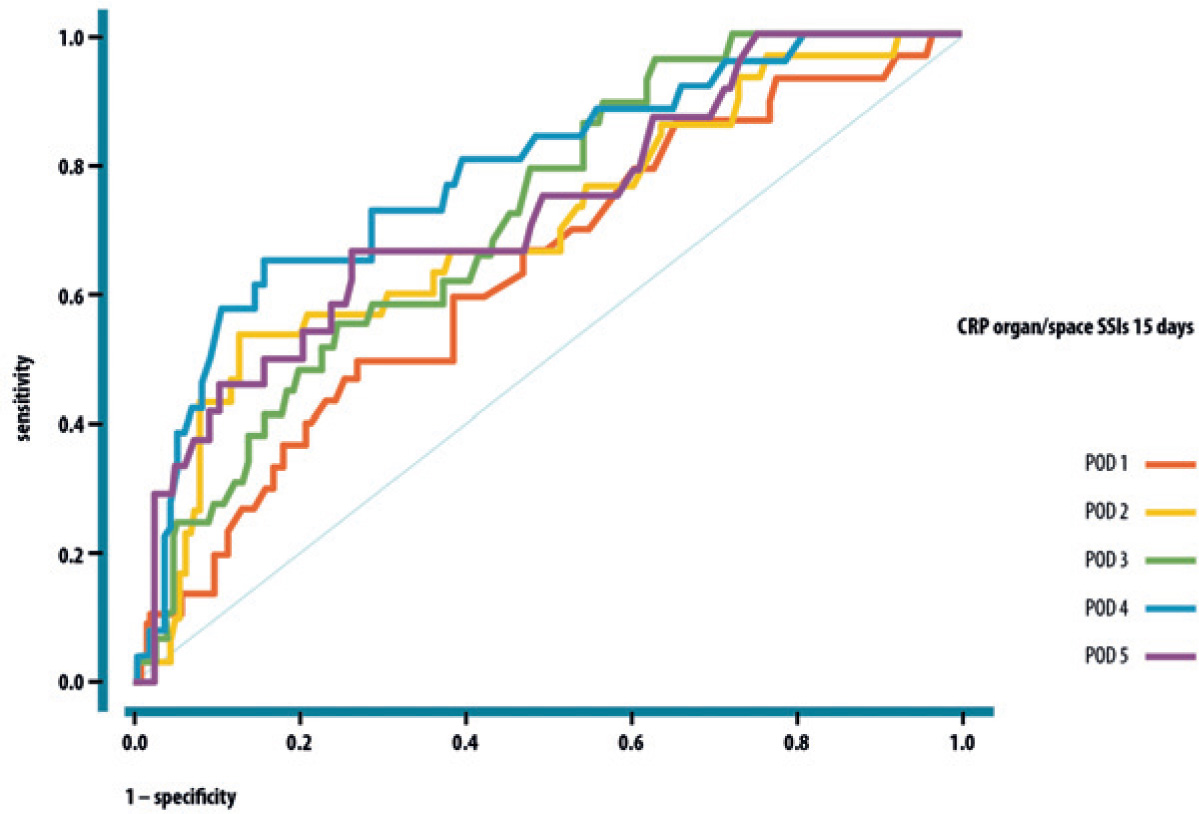
ROC curve for CRP POD1-POD5 as a predictor of organ/space SSIs 15 days after colorectal surgery.
CRP = C-reactive protein; POD = postoperative day; ROC = receiver operating characteristic; SSIs = surgical site infections
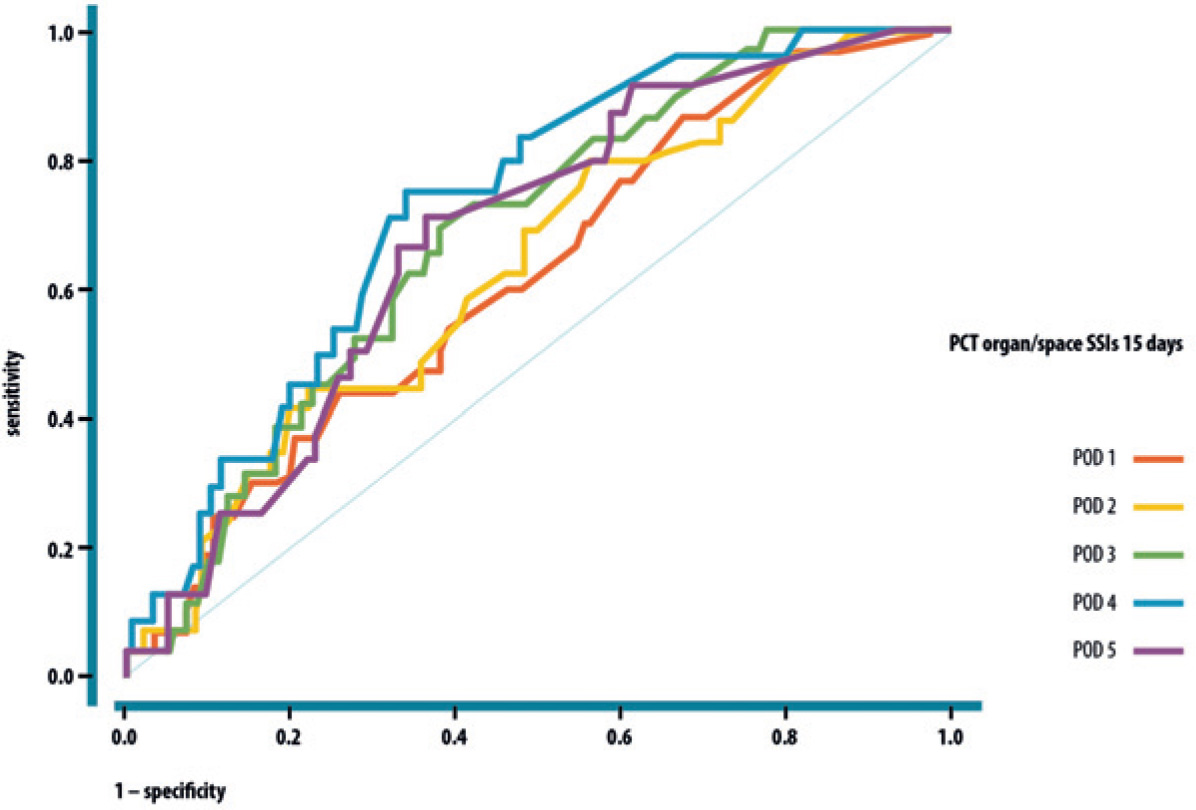
ROC curve for PCT POD1-POD5 as a predictor of organ/space SSIs 15 days after colorectal surgery.
POD = postoperative day; PCT = procalcitonin; ROC = receiver operating characteristic; SSIs = surgical site infections
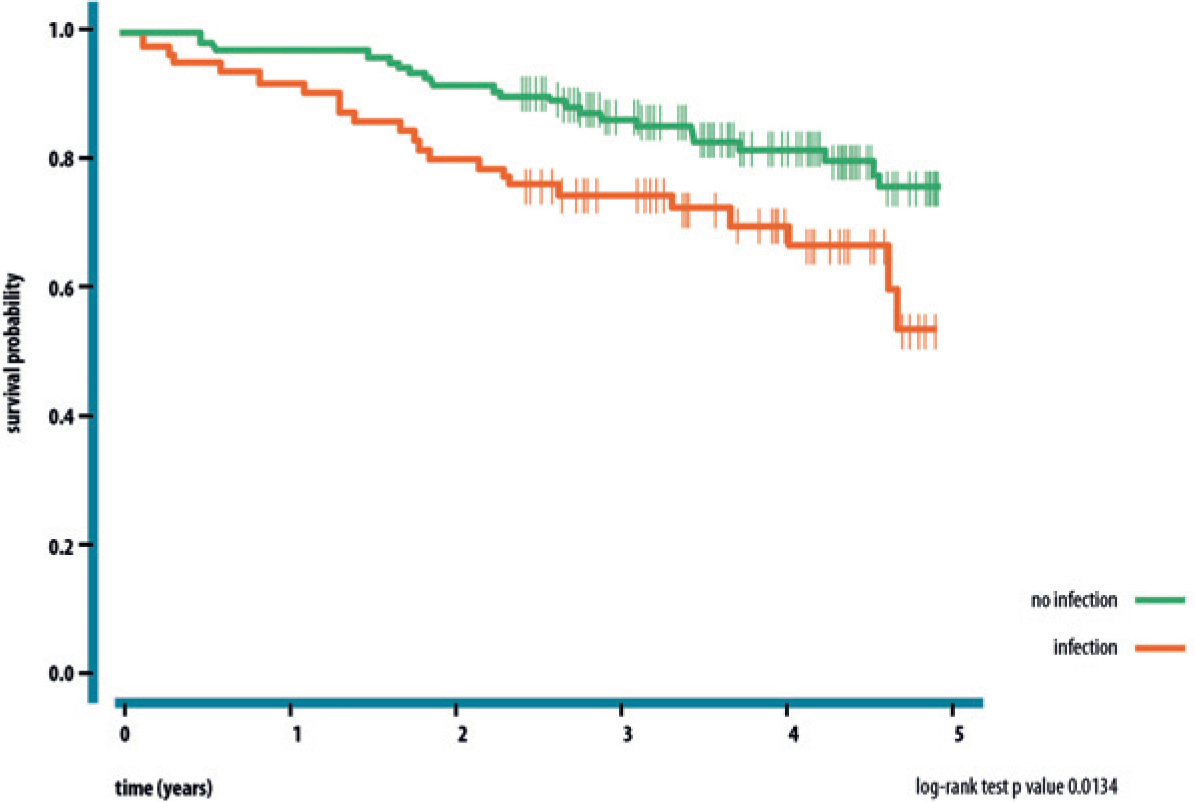
Kaplan-Meier survival curve for infected and non-infected group. Patients have been followed up for a minimum of 28 months.