Figure 1:
![Effect of steel fiber content on flow diameter of 3DPCM [38], 39], 43], [47], [48], [49].](https://sciendo-parsed.s3.eu-central-1.amazonaws.com/69388d63a2cfbc128b1cffde/j_rams-2025-0181_fig_001.jpg?X-Amz-Algorithm=AWS4-HMAC-SHA256&X-Amz-Content-Sha256=UNSIGNED-PAYLOAD&X-Amz-Credential=ASIA6AP2G7AKAV7KI53H%2F20251212%2Feu-central-1%2Fs3%2Faws4_request&X-Amz-Date=20251212T231138Z&X-Amz-Expires=3600&X-Amz-Security-Token=IQoJb3JpZ2luX2VjEEQaDGV1LWNlbnRyYWwtMSJHMEUCIQDKNa8y2lc0a0FpyiYuha1NvRqEFP6UmSLtJsox%2FjOcIAIgRf1VR%2F2z9TtrnD%2B1m2Vt%2FH2zcHfFeVyHGIPoaWRACgAqvQUIDRACGgw5NjMxMzQyODk5NDAiDGtbhLw3Wdws79NonSqaBSZ07EiTRHs0TsJ4mpDSApsikNHNkUTsM6tJ1ypQquKDvIFlQRWUtKwuwfFC6Z9Qjqyv5HM13kIXVXrEfdepp9Sy2MUd9XWK25MTx2V7uXsAKua6N5eb4zfBa1ghq2egZ1WQl6SIHLSrw8S6DOT0VWnaz5FJHfarUCokR9qmEoVUEIOTO%2BUlQBSNauCvKzRSmxNmp0zpnVi5kwv9%2FXMQaGOwMuaM4LiYhTmCy9fsWWVk0NEFeaRA3yg8tZX2FfuRlyoHQ2YW5czGNxIGHEgUSg4lwM8AQyAFVAParGUKmL9SBQ4TzugsER1xEppRIfLyhzerzwVQQ526PaVDEKXvMFyMtw7ONZkZqAGpa0M2aDWbZWg0joTQL8pg8CBNOTZFM%2BR86mEUFRNAuCWGBteSKHcxE%2Fw3ls7L36RPgR9DkvxJoCyUd5o4gf95iUetR3UURlD8BlQ9of9Z4WXGHnMB0Lm%2F4qObTUUdkb789UT2ua01I%2FfhTSeJuAnD%2B5GxBSK7sShhxxe2XdkCkexV1A8aF83TOZp%2F58wJ6CIcqtLrqKHbYPfxeH2HHyRXH5K1QiMD3i8ox69eW9Mf4M%2FwCiuGkWN43%2FvfGCtH7dkna4HWEhRl26So0CAYKedoZ%2FI8ekFkXmVOoC%2BMS02UD%2FIljhtZTDV71oUTPougTD69Dh5LZSaNSkymyDsrigqCueg6yIV6gyJv%2FzWWxRFzNsz9oSuDRyGO1ONrYYf7XRpii%2Bp1QDQjiYt4zjHmYIvY2bE4Z9JrjJARwNe2iEbwXxdjK%2FtBRGGzo5nQiWVCDW54y3UWyJ3gF4FOZy2xoDTCHnlcio49EGimyfuS9yhd9E6es3lOis5SgYkN7hLQfXavcHqC17Db3LzMvnedwuBpSDCm6%2FHJBjqxAdh7oddhjlgp8XvcZM%2Fwz76vAR7667PA6svUpsHSgIi0Eecm3ayDY8IZ2m3nbkGe6Y6XbroL2Ty3B8JFqSZKoqIAznrHvmk5ALuNzWf5Xo6Gf%2FMOh2hLVoK1sflhAjVz2sstjGqy6%2F0ETMaKS6O%2FJBnfcpmBfX6h1djmwbWmBsF389tmKZ1pB3Ew5SohucOZY2c8wsrkU1hQnz5aVOUoAYjPd0rOTek6eirHpxCi%2B2uv3g%3D%3D&X-Amz-Signature=b726bff90e9a5d5466aa70e540d9b701979cadaf6f201247859d7479dc08974a&X-Amz-SignedHeaders=host&x-amz-checksum-mode=ENABLED&x-id=GetObject)
Figure 2:
![Effect of steel fiber content on static yield stress of 3DPCM as reported by (a) Jia, Zhou [40]; (b) Xia, Geng [38].](https://sciendo-parsed.s3.eu-central-1.amazonaws.com/69388d63a2cfbc128b1cffde/j_rams-2025-0181_fig_002.jpg?X-Amz-Algorithm=AWS4-HMAC-SHA256&X-Amz-Content-Sha256=UNSIGNED-PAYLOAD&X-Amz-Credential=ASIA6AP2G7AKAV7KI53H%2F20251212%2Feu-central-1%2Fs3%2Faws4_request&X-Amz-Date=20251212T231138Z&X-Amz-Expires=3600&X-Amz-Security-Token=IQoJb3JpZ2luX2VjEEQaDGV1LWNlbnRyYWwtMSJHMEUCIQDKNa8y2lc0a0FpyiYuha1NvRqEFP6UmSLtJsox%2FjOcIAIgRf1VR%2F2z9TtrnD%2B1m2Vt%2FH2zcHfFeVyHGIPoaWRACgAqvQUIDRACGgw5NjMxMzQyODk5NDAiDGtbhLw3Wdws79NonSqaBSZ07EiTRHs0TsJ4mpDSApsikNHNkUTsM6tJ1ypQquKDvIFlQRWUtKwuwfFC6Z9Qjqyv5HM13kIXVXrEfdepp9Sy2MUd9XWK25MTx2V7uXsAKua6N5eb4zfBa1ghq2egZ1WQl6SIHLSrw8S6DOT0VWnaz5FJHfarUCokR9qmEoVUEIOTO%2BUlQBSNauCvKzRSmxNmp0zpnVi5kwv9%2FXMQaGOwMuaM4LiYhTmCy9fsWWVk0NEFeaRA3yg8tZX2FfuRlyoHQ2YW5czGNxIGHEgUSg4lwM8AQyAFVAParGUKmL9SBQ4TzugsER1xEppRIfLyhzerzwVQQ526PaVDEKXvMFyMtw7ONZkZqAGpa0M2aDWbZWg0joTQL8pg8CBNOTZFM%2BR86mEUFRNAuCWGBteSKHcxE%2Fw3ls7L36RPgR9DkvxJoCyUd5o4gf95iUetR3UURlD8BlQ9of9Z4WXGHnMB0Lm%2F4qObTUUdkb789UT2ua01I%2FfhTSeJuAnD%2B5GxBSK7sShhxxe2XdkCkexV1A8aF83TOZp%2F58wJ6CIcqtLrqKHbYPfxeH2HHyRXH5K1QiMD3i8ox69eW9Mf4M%2FwCiuGkWN43%2FvfGCtH7dkna4HWEhRl26So0CAYKedoZ%2FI8ekFkXmVOoC%2BMS02UD%2FIljhtZTDV71oUTPougTD69Dh5LZSaNSkymyDsrigqCueg6yIV6gyJv%2FzWWxRFzNsz9oSuDRyGO1ONrYYf7XRpii%2Bp1QDQjiYt4zjHmYIvY2bE4Z9JrjJARwNe2iEbwXxdjK%2FtBRGGzo5nQiWVCDW54y3UWyJ3gF4FOZy2xoDTCHnlcio49EGimyfuS9yhd9E6es3lOis5SgYkN7hLQfXavcHqC17Db3LzMvnedwuBpSDCm6%2FHJBjqxAdh7oddhjlgp8XvcZM%2Fwz76vAR7667PA6svUpsHSgIi0Eecm3ayDY8IZ2m3nbkGe6Y6XbroL2Ty3B8JFqSZKoqIAznrHvmk5ALuNzWf5Xo6Gf%2FMOh2hLVoK1sflhAjVz2sstjGqy6%2F0ETMaKS6O%2FJBnfcpmBfX6h1djmwbWmBsF389tmKZ1pB3Ew5SohucOZY2c8wsrkU1hQnz5aVOUoAYjPd0rOTek6eirHpxCi%2B2uv3g%3D%3D&X-Amz-Signature=8203def9ba8860cc342965f788c5bd3b8157adc87f2849ac7c4ce127486f5b52&X-Amz-SignedHeaders=host&x-amz-checksum-mode=ENABLED&x-id=GetObject)
Figure 3:
![Effect of fibers on yield stress buildup of 3DPCM with rest time [49].](https://sciendo-parsed.s3.eu-central-1.amazonaws.com/69388d63a2cfbc128b1cffde/j_rams-2025-0181_fig_003.jpg?X-Amz-Algorithm=AWS4-HMAC-SHA256&X-Amz-Content-Sha256=UNSIGNED-PAYLOAD&X-Amz-Credential=ASIA6AP2G7AKAV7KI53H%2F20251212%2Feu-central-1%2Fs3%2Faws4_request&X-Amz-Date=20251212T231138Z&X-Amz-Expires=3600&X-Amz-Security-Token=IQoJb3JpZ2luX2VjEEQaDGV1LWNlbnRyYWwtMSJHMEUCIQDKNa8y2lc0a0FpyiYuha1NvRqEFP6UmSLtJsox%2FjOcIAIgRf1VR%2F2z9TtrnD%2B1m2Vt%2FH2zcHfFeVyHGIPoaWRACgAqvQUIDRACGgw5NjMxMzQyODk5NDAiDGtbhLw3Wdws79NonSqaBSZ07EiTRHs0TsJ4mpDSApsikNHNkUTsM6tJ1ypQquKDvIFlQRWUtKwuwfFC6Z9Qjqyv5HM13kIXVXrEfdepp9Sy2MUd9XWK25MTx2V7uXsAKua6N5eb4zfBa1ghq2egZ1WQl6SIHLSrw8S6DOT0VWnaz5FJHfarUCokR9qmEoVUEIOTO%2BUlQBSNauCvKzRSmxNmp0zpnVi5kwv9%2FXMQaGOwMuaM4LiYhTmCy9fsWWVk0NEFeaRA3yg8tZX2FfuRlyoHQ2YW5czGNxIGHEgUSg4lwM8AQyAFVAParGUKmL9SBQ4TzugsER1xEppRIfLyhzerzwVQQ526PaVDEKXvMFyMtw7ONZkZqAGpa0M2aDWbZWg0joTQL8pg8CBNOTZFM%2BR86mEUFRNAuCWGBteSKHcxE%2Fw3ls7L36RPgR9DkvxJoCyUd5o4gf95iUetR3UURlD8BlQ9of9Z4WXGHnMB0Lm%2F4qObTUUdkb789UT2ua01I%2FfhTSeJuAnD%2B5GxBSK7sShhxxe2XdkCkexV1A8aF83TOZp%2F58wJ6CIcqtLrqKHbYPfxeH2HHyRXH5K1QiMD3i8ox69eW9Mf4M%2FwCiuGkWN43%2FvfGCtH7dkna4HWEhRl26So0CAYKedoZ%2FI8ekFkXmVOoC%2BMS02UD%2FIljhtZTDV71oUTPougTD69Dh5LZSaNSkymyDsrigqCueg6yIV6gyJv%2FzWWxRFzNsz9oSuDRyGO1ONrYYf7XRpii%2Bp1QDQjiYt4zjHmYIvY2bE4Z9JrjJARwNe2iEbwXxdjK%2FtBRGGzo5nQiWVCDW54y3UWyJ3gF4FOZy2xoDTCHnlcio49EGimyfuS9yhd9E6es3lOis5SgYkN7hLQfXavcHqC17Db3LzMvnedwuBpSDCm6%2FHJBjqxAdh7oddhjlgp8XvcZM%2Fwz76vAR7667PA6svUpsHSgIi0Eecm3ayDY8IZ2m3nbkGe6Y6XbroL2Ty3B8JFqSZKoqIAznrHvmk5ALuNzWf5Xo6Gf%2FMOh2hLVoK1sflhAjVz2sstjGqy6%2F0ETMaKS6O%2FJBnfcpmBfX6h1djmwbWmBsF389tmKZ1pB3Ew5SohucOZY2c8wsrkU1hQnz5aVOUoAYjPd0rOTek6eirHpxCi%2B2uv3g%3D%3D&X-Amz-Signature=6621a6445625873303da9c76866264e7c36de4855c9a9bedf00f798805a10883&X-Amz-SignedHeaders=host&x-amz-checksum-mode=ENABLED&x-id=GetObject)
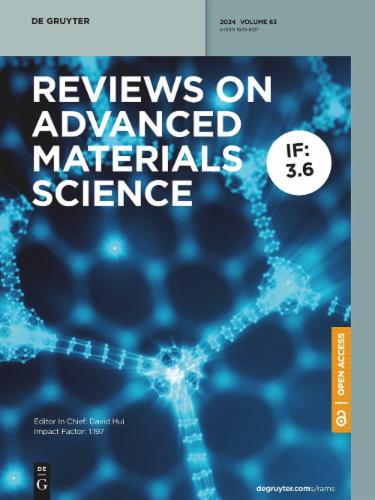
Figure 4:
![Dynamic yield stress versus varying fiber content [38], 39], 43], 49].](https://sciendo-parsed.s3.eu-central-1.amazonaws.com/69388d63a2cfbc128b1cffde/j_rams-2025-0181_fig_004.jpg?X-Amz-Algorithm=AWS4-HMAC-SHA256&X-Amz-Content-Sha256=UNSIGNED-PAYLOAD&X-Amz-Credential=ASIA6AP2G7AKAV7KI53H%2F20251212%2Feu-central-1%2Fs3%2Faws4_request&X-Amz-Date=20251212T231138Z&X-Amz-Expires=3600&X-Amz-Security-Token=IQoJb3JpZ2luX2VjEEQaDGV1LWNlbnRyYWwtMSJHMEUCIQDKNa8y2lc0a0FpyiYuha1NvRqEFP6UmSLtJsox%2FjOcIAIgRf1VR%2F2z9TtrnD%2B1m2Vt%2FH2zcHfFeVyHGIPoaWRACgAqvQUIDRACGgw5NjMxMzQyODk5NDAiDGtbhLw3Wdws79NonSqaBSZ07EiTRHs0TsJ4mpDSApsikNHNkUTsM6tJ1ypQquKDvIFlQRWUtKwuwfFC6Z9Qjqyv5HM13kIXVXrEfdepp9Sy2MUd9XWK25MTx2V7uXsAKua6N5eb4zfBa1ghq2egZ1WQl6SIHLSrw8S6DOT0VWnaz5FJHfarUCokR9qmEoVUEIOTO%2BUlQBSNauCvKzRSmxNmp0zpnVi5kwv9%2FXMQaGOwMuaM4LiYhTmCy9fsWWVk0NEFeaRA3yg8tZX2FfuRlyoHQ2YW5czGNxIGHEgUSg4lwM8AQyAFVAParGUKmL9SBQ4TzugsER1xEppRIfLyhzerzwVQQ526PaVDEKXvMFyMtw7ONZkZqAGpa0M2aDWbZWg0joTQL8pg8CBNOTZFM%2BR86mEUFRNAuCWGBteSKHcxE%2Fw3ls7L36RPgR9DkvxJoCyUd5o4gf95iUetR3UURlD8BlQ9of9Z4WXGHnMB0Lm%2F4qObTUUdkb789UT2ua01I%2FfhTSeJuAnD%2B5GxBSK7sShhxxe2XdkCkexV1A8aF83TOZp%2F58wJ6CIcqtLrqKHbYPfxeH2HHyRXH5K1QiMD3i8ox69eW9Mf4M%2FwCiuGkWN43%2FvfGCtH7dkna4HWEhRl26So0CAYKedoZ%2FI8ekFkXmVOoC%2BMS02UD%2FIljhtZTDV71oUTPougTD69Dh5LZSaNSkymyDsrigqCueg6yIV6gyJv%2FzWWxRFzNsz9oSuDRyGO1ONrYYf7XRpii%2Bp1QDQjiYt4zjHmYIvY2bE4Z9JrjJARwNe2iEbwXxdjK%2FtBRGGzo5nQiWVCDW54y3UWyJ3gF4FOZy2xoDTCHnlcio49EGimyfuS9yhd9E6es3lOis5SgYkN7hLQfXavcHqC17Db3LzMvnedwuBpSDCm6%2FHJBjqxAdh7oddhjlgp8XvcZM%2Fwz76vAR7667PA6svUpsHSgIi0Eecm3ayDY8IZ2m3nbkGe6Y6XbroL2Ty3B8JFqSZKoqIAznrHvmk5ALuNzWf5Xo6Gf%2FMOh2hLVoK1sflhAjVz2sstjGqy6%2F0ETMaKS6O%2FJBnfcpmBfX6h1djmwbWmBsF389tmKZ1pB3Ew5SohucOZY2c8wsrkU1hQnz5aVOUoAYjPd0rOTek6eirHpxCi%2B2uv3g%3D%3D&X-Amz-Signature=574b67309cca6fd226fb9d06d31e7a8c40858f1a9ed9514126998d85922691d1&X-Amz-SignedHeaders=host&x-amz-checksum-mode=ENABLED&x-id=GetObject)
Figure 5:
![Effect of steel fiber content on width of printed filament [53].](https://sciendo-parsed.s3.eu-central-1.amazonaws.com/69388d63a2cfbc128b1cffde/j_rams-2025-0181_fig_005.jpg?X-Amz-Algorithm=AWS4-HMAC-SHA256&X-Amz-Content-Sha256=UNSIGNED-PAYLOAD&X-Amz-Credential=ASIA6AP2G7AKAV7KI53H%2F20251212%2Feu-central-1%2Fs3%2Faws4_request&X-Amz-Date=20251212T231138Z&X-Amz-Expires=3600&X-Amz-Security-Token=IQoJb3JpZ2luX2VjEEQaDGV1LWNlbnRyYWwtMSJHMEUCIQDKNa8y2lc0a0FpyiYuha1NvRqEFP6UmSLtJsox%2FjOcIAIgRf1VR%2F2z9TtrnD%2B1m2Vt%2FH2zcHfFeVyHGIPoaWRACgAqvQUIDRACGgw5NjMxMzQyODk5NDAiDGtbhLw3Wdws79NonSqaBSZ07EiTRHs0TsJ4mpDSApsikNHNkUTsM6tJ1ypQquKDvIFlQRWUtKwuwfFC6Z9Qjqyv5HM13kIXVXrEfdepp9Sy2MUd9XWK25MTx2V7uXsAKua6N5eb4zfBa1ghq2egZ1WQl6SIHLSrw8S6DOT0VWnaz5FJHfarUCokR9qmEoVUEIOTO%2BUlQBSNauCvKzRSmxNmp0zpnVi5kwv9%2FXMQaGOwMuaM4LiYhTmCy9fsWWVk0NEFeaRA3yg8tZX2FfuRlyoHQ2YW5czGNxIGHEgUSg4lwM8AQyAFVAParGUKmL9SBQ4TzugsER1xEppRIfLyhzerzwVQQ526PaVDEKXvMFyMtw7ONZkZqAGpa0M2aDWbZWg0joTQL8pg8CBNOTZFM%2BR86mEUFRNAuCWGBteSKHcxE%2Fw3ls7L36RPgR9DkvxJoCyUd5o4gf95iUetR3UURlD8BlQ9of9Z4WXGHnMB0Lm%2F4qObTUUdkb789UT2ua01I%2FfhTSeJuAnD%2B5GxBSK7sShhxxe2XdkCkexV1A8aF83TOZp%2F58wJ6CIcqtLrqKHbYPfxeH2HHyRXH5K1QiMD3i8ox69eW9Mf4M%2FwCiuGkWN43%2FvfGCtH7dkna4HWEhRl26So0CAYKedoZ%2FI8ekFkXmVOoC%2BMS02UD%2FIljhtZTDV71oUTPougTD69Dh5LZSaNSkymyDsrigqCueg6yIV6gyJv%2FzWWxRFzNsz9oSuDRyGO1ONrYYf7XRpii%2Bp1QDQjiYt4zjHmYIvY2bE4Z9JrjJARwNe2iEbwXxdjK%2FtBRGGzo5nQiWVCDW54y3UWyJ3gF4FOZy2xoDTCHnlcio49EGimyfuS9yhd9E6es3lOis5SgYkN7hLQfXavcHqC17Db3LzMvnedwuBpSDCm6%2FHJBjqxAdh7oddhjlgp8XvcZM%2Fwz76vAR7667PA6svUpsHSgIi0Eecm3ayDY8IZ2m3nbkGe6Y6XbroL2Ty3B8JFqSZKoqIAznrHvmk5ALuNzWf5Xo6Gf%2FMOh2hLVoK1sflhAjVz2sstjGqy6%2F0ETMaKS6O%2FJBnfcpmBfX6h1djmwbWmBsF389tmKZ1pB3Ew5SohucOZY2c8wsrkU1hQnz5aVOUoAYjPd0rOTek6eirHpxCi%2B2uv3g%3D%3D&X-Amz-Signature=dbfcfaba9fe1a0bf31f2a94efa044f51552409ef8569cf8184759dd351d34dc4&X-Amz-SignedHeaders=host&x-amz-checksum-mode=ENABLED&x-id=GetObject)
Figure 6:
![Extrudability of 50 cm long filament with different types of fibers [38].](https://sciendo-parsed.s3.eu-central-1.amazonaws.com/69388d63a2cfbc128b1cffde/j_rams-2025-0181_fig_006.jpg?X-Amz-Algorithm=AWS4-HMAC-SHA256&X-Amz-Content-Sha256=UNSIGNED-PAYLOAD&X-Amz-Credential=ASIA6AP2G7AKAV7KI53H%2F20251212%2Feu-central-1%2Fs3%2Faws4_request&X-Amz-Date=20251212T231138Z&X-Amz-Expires=3600&X-Amz-Security-Token=IQoJb3JpZ2luX2VjEEQaDGV1LWNlbnRyYWwtMSJHMEUCIQDKNa8y2lc0a0FpyiYuha1NvRqEFP6UmSLtJsox%2FjOcIAIgRf1VR%2F2z9TtrnD%2B1m2Vt%2FH2zcHfFeVyHGIPoaWRACgAqvQUIDRACGgw5NjMxMzQyODk5NDAiDGtbhLw3Wdws79NonSqaBSZ07EiTRHs0TsJ4mpDSApsikNHNkUTsM6tJ1ypQquKDvIFlQRWUtKwuwfFC6Z9Qjqyv5HM13kIXVXrEfdepp9Sy2MUd9XWK25MTx2V7uXsAKua6N5eb4zfBa1ghq2egZ1WQl6SIHLSrw8S6DOT0VWnaz5FJHfarUCokR9qmEoVUEIOTO%2BUlQBSNauCvKzRSmxNmp0zpnVi5kwv9%2FXMQaGOwMuaM4LiYhTmCy9fsWWVk0NEFeaRA3yg8tZX2FfuRlyoHQ2YW5czGNxIGHEgUSg4lwM8AQyAFVAParGUKmL9SBQ4TzugsER1xEppRIfLyhzerzwVQQ526PaVDEKXvMFyMtw7ONZkZqAGpa0M2aDWbZWg0joTQL8pg8CBNOTZFM%2BR86mEUFRNAuCWGBteSKHcxE%2Fw3ls7L36RPgR9DkvxJoCyUd5o4gf95iUetR3UURlD8BlQ9of9Z4WXGHnMB0Lm%2F4qObTUUdkb789UT2ua01I%2FfhTSeJuAnD%2B5GxBSK7sShhxxe2XdkCkexV1A8aF83TOZp%2F58wJ6CIcqtLrqKHbYPfxeH2HHyRXH5K1QiMD3i8ox69eW9Mf4M%2FwCiuGkWN43%2FvfGCtH7dkna4HWEhRl26So0CAYKedoZ%2FI8ekFkXmVOoC%2BMS02UD%2FIljhtZTDV71oUTPougTD69Dh5LZSaNSkymyDsrigqCueg6yIV6gyJv%2FzWWxRFzNsz9oSuDRyGO1ONrYYf7XRpii%2Bp1QDQjiYt4zjHmYIvY2bE4Z9JrjJARwNe2iEbwXxdjK%2FtBRGGzo5nQiWVCDW54y3UWyJ3gF4FOZy2xoDTCHnlcio49EGimyfuS9yhd9E6es3lOis5SgYkN7hLQfXavcHqC17Db3LzMvnedwuBpSDCm6%2FHJBjqxAdh7oddhjlgp8XvcZM%2Fwz76vAR7667PA6svUpsHSgIi0Eecm3ayDY8IZ2m3nbkGe6Y6XbroL2Ty3B8JFqSZKoqIAznrHvmk5ALuNzWf5Xo6Gf%2FMOh2hLVoK1sflhAjVz2sstjGqy6%2F0ETMaKS6O%2FJBnfcpmBfX6h1djmwbWmBsF389tmKZ1pB3Ew5SohucOZY2c8wsrkU1hQnz5aVOUoAYjPd0rOTek6eirHpxCi%2B2uv3g%3D%3D&X-Amz-Signature=78d15f5c06469e74ff13b10e46e58e050bcac6b6fdd6707b0603edad7421593d&X-Amz-SignedHeaders=host&x-amz-checksum-mode=ENABLED&x-id=GetObject)
Figure 7:
![Effect of steel fibers on bottom layer deformation (a) sand/binder = 1.4 (b) sand/binder = 1.8 [37].](https://sciendo-parsed.s3.eu-central-1.amazonaws.com/69388d63a2cfbc128b1cffde/j_rams-2025-0181_fig_007.jpg?X-Amz-Algorithm=AWS4-HMAC-SHA256&X-Amz-Content-Sha256=UNSIGNED-PAYLOAD&X-Amz-Credential=ASIA6AP2G7AKAV7KI53H%2F20251212%2Feu-central-1%2Fs3%2Faws4_request&X-Amz-Date=20251212T231138Z&X-Amz-Expires=3600&X-Amz-Security-Token=IQoJb3JpZ2luX2VjEEQaDGV1LWNlbnRyYWwtMSJHMEUCIQDKNa8y2lc0a0FpyiYuha1NvRqEFP6UmSLtJsox%2FjOcIAIgRf1VR%2F2z9TtrnD%2B1m2Vt%2FH2zcHfFeVyHGIPoaWRACgAqvQUIDRACGgw5NjMxMzQyODk5NDAiDGtbhLw3Wdws79NonSqaBSZ07EiTRHs0TsJ4mpDSApsikNHNkUTsM6tJ1ypQquKDvIFlQRWUtKwuwfFC6Z9Qjqyv5HM13kIXVXrEfdepp9Sy2MUd9XWK25MTx2V7uXsAKua6N5eb4zfBa1ghq2egZ1WQl6SIHLSrw8S6DOT0VWnaz5FJHfarUCokR9qmEoVUEIOTO%2BUlQBSNauCvKzRSmxNmp0zpnVi5kwv9%2FXMQaGOwMuaM4LiYhTmCy9fsWWVk0NEFeaRA3yg8tZX2FfuRlyoHQ2YW5czGNxIGHEgUSg4lwM8AQyAFVAParGUKmL9SBQ4TzugsER1xEppRIfLyhzerzwVQQ526PaVDEKXvMFyMtw7ONZkZqAGpa0M2aDWbZWg0joTQL8pg8CBNOTZFM%2BR86mEUFRNAuCWGBteSKHcxE%2Fw3ls7L36RPgR9DkvxJoCyUd5o4gf95iUetR3UURlD8BlQ9of9Z4WXGHnMB0Lm%2F4qObTUUdkb789UT2ua01I%2FfhTSeJuAnD%2B5GxBSK7sShhxxe2XdkCkexV1A8aF83TOZp%2F58wJ6CIcqtLrqKHbYPfxeH2HHyRXH5K1QiMD3i8ox69eW9Mf4M%2FwCiuGkWN43%2FvfGCtH7dkna4HWEhRl26So0CAYKedoZ%2FI8ekFkXmVOoC%2BMS02UD%2FIljhtZTDV71oUTPougTD69Dh5LZSaNSkymyDsrigqCueg6yIV6gyJv%2FzWWxRFzNsz9oSuDRyGO1ONrYYf7XRpii%2Bp1QDQjiYt4zjHmYIvY2bE4Z9JrjJARwNe2iEbwXxdjK%2FtBRGGzo5nQiWVCDW54y3UWyJ3gF4FOZy2xoDTCHnlcio49EGimyfuS9yhd9E6es3lOis5SgYkN7hLQfXavcHqC17Db3LzMvnedwuBpSDCm6%2FHJBjqxAdh7oddhjlgp8XvcZM%2Fwz76vAR7667PA6svUpsHSgIi0Eecm3ayDY8IZ2m3nbkGe6Y6XbroL2Ty3B8JFqSZKoqIAznrHvmk5ALuNzWf5Xo6Gf%2FMOh2hLVoK1sflhAjVz2sstjGqy6%2F0ETMaKS6O%2FJBnfcpmBfX6h1djmwbWmBsF389tmKZ1pB3Ew5SohucOZY2c8wsrkU1hQnz5aVOUoAYjPd0rOTek6eirHpxCi%2B2uv3g%3D%3D&X-Amz-Signature=60b96bab9be0b18ea9d684c8d559a05f792f4910a6b7d79633d8d76bf6009393&X-Amz-SignedHeaders=host&x-amz-checksum-mode=ENABLED&x-id=GetObject)
Figure 8:
![Effect of steel fiber length on printability of 3DPCM [36].](https://sciendo-parsed.s3.eu-central-1.amazonaws.com/69388d63a2cfbc128b1cffde/j_rams-2025-0181_fig_008.jpg?X-Amz-Algorithm=AWS4-HMAC-SHA256&X-Amz-Content-Sha256=UNSIGNED-PAYLOAD&X-Amz-Credential=ASIA6AP2G7AKAV7KI53H%2F20251212%2Feu-central-1%2Fs3%2Faws4_request&X-Amz-Date=20251212T231138Z&X-Amz-Expires=3600&X-Amz-Security-Token=IQoJb3JpZ2luX2VjEEQaDGV1LWNlbnRyYWwtMSJHMEUCIQDKNa8y2lc0a0FpyiYuha1NvRqEFP6UmSLtJsox%2FjOcIAIgRf1VR%2F2z9TtrnD%2B1m2Vt%2FH2zcHfFeVyHGIPoaWRACgAqvQUIDRACGgw5NjMxMzQyODk5NDAiDGtbhLw3Wdws79NonSqaBSZ07EiTRHs0TsJ4mpDSApsikNHNkUTsM6tJ1ypQquKDvIFlQRWUtKwuwfFC6Z9Qjqyv5HM13kIXVXrEfdepp9Sy2MUd9XWK25MTx2V7uXsAKua6N5eb4zfBa1ghq2egZ1WQl6SIHLSrw8S6DOT0VWnaz5FJHfarUCokR9qmEoVUEIOTO%2BUlQBSNauCvKzRSmxNmp0zpnVi5kwv9%2FXMQaGOwMuaM4LiYhTmCy9fsWWVk0NEFeaRA3yg8tZX2FfuRlyoHQ2YW5czGNxIGHEgUSg4lwM8AQyAFVAParGUKmL9SBQ4TzugsER1xEppRIfLyhzerzwVQQ526PaVDEKXvMFyMtw7ONZkZqAGpa0M2aDWbZWg0joTQL8pg8CBNOTZFM%2BR86mEUFRNAuCWGBteSKHcxE%2Fw3ls7L36RPgR9DkvxJoCyUd5o4gf95iUetR3UURlD8BlQ9of9Z4WXGHnMB0Lm%2F4qObTUUdkb789UT2ua01I%2FfhTSeJuAnD%2B5GxBSK7sShhxxe2XdkCkexV1A8aF83TOZp%2F58wJ6CIcqtLrqKHbYPfxeH2HHyRXH5K1QiMD3i8ox69eW9Mf4M%2FwCiuGkWN43%2FvfGCtH7dkna4HWEhRl26So0CAYKedoZ%2FI8ekFkXmVOoC%2BMS02UD%2FIljhtZTDV71oUTPougTD69Dh5LZSaNSkymyDsrigqCueg6yIV6gyJv%2FzWWxRFzNsz9oSuDRyGO1ONrYYf7XRpii%2Bp1QDQjiYt4zjHmYIvY2bE4Z9JrjJARwNe2iEbwXxdjK%2FtBRGGzo5nQiWVCDW54y3UWyJ3gF4FOZy2xoDTCHnlcio49EGimyfuS9yhd9E6es3lOis5SgYkN7hLQfXavcHqC17Db3LzMvnedwuBpSDCm6%2FHJBjqxAdh7oddhjlgp8XvcZM%2Fwz76vAR7667PA6svUpsHSgIi0Eecm3ayDY8IZ2m3nbkGe6Y6XbroL2Ty3B8JFqSZKoqIAznrHvmk5ALuNzWf5Xo6Gf%2FMOh2hLVoK1sflhAjVz2sstjGqy6%2F0ETMaKS6O%2FJBnfcpmBfX6h1djmwbWmBsF389tmKZ1pB3Ew5SohucOZY2c8wsrkU1hQnz5aVOUoAYjPd0rOTek6eirHpxCi%2B2uv3g%3D%3D&X-Amz-Signature=fbaa7d7ba8440e4a1d8e122033595b1eae8bad7d474c5810c1f3a08b94e83234&X-Amz-SignedHeaders=host&x-amz-checksum-mode=ENABLED&x-id=GetObject)
Figure 9:

Figure 10:
![Effect of steel fiber content on compressive strength in X direction [21], 33], 34], 36], 38], 40], 41], 47], 55], 56].](https://sciendo-parsed.s3.eu-central-1.amazonaws.com/69388d63a2cfbc128b1cffde/j_rams-2025-0181_fig_010.jpg?X-Amz-Algorithm=AWS4-HMAC-SHA256&X-Amz-Content-Sha256=UNSIGNED-PAYLOAD&X-Amz-Credential=ASIA6AP2G7AKAV7KI53H%2F20251212%2Feu-central-1%2Fs3%2Faws4_request&X-Amz-Date=20251212T231138Z&X-Amz-Expires=3600&X-Amz-Security-Token=IQoJb3JpZ2luX2VjEEQaDGV1LWNlbnRyYWwtMSJHMEUCIQDKNa8y2lc0a0FpyiYuha1NvRqEFP6UmSLtJsox%2FjOcIAIgRf1VR%2F2z9TtrnD%2B1m2Vt%2FH2zcHfFeVyHGIPoaWRACgAqvQUIDRACGgw5NjMxMzQyODk5NDAiDGtbhLw3Wdws79NonSqaBSZ07EiTRHs0TsJ4mpDSApsikNHNkUTsM6tJ1ypQquKDvIFlQRWUtKwuwfFC6Z9Qjqyv5HM13kIXVXrEfdepp9Sy2MUd9XWK25MTx2V7uXsAKua6N5eb4zfBa1ghq2egZ1WQl6SIHLSrw8S6DOT0VWnaz5FJHfarUCokR9qmEoVUEIOTO%2BUlQBSNauCvKzRSmxNmp0zpnVi5kwv9%2FXMQaGOwMuaM4LiYhTmCy9fsWWVk0NEFeaRA3yg8tZX2FfuRlyoHQ2YW5czGNxIGHEgUSg4lwM8AQyAFVAParGUKmL9SBQ4TzugsER1xEppRIfLyhzerzwVQQ526PaVDEKXvMFyMtw7ONZkZqAGpa0M2aDWbZWg0joTQL8pg8CBNOTZFM%2BR86mEUFRNAuCWGBteSKHcxE%2Fw3ls7L36RPgR9DkvxJoCyUd5o4gf95iUetR3UURlD8BlQ9of9Z4WXGHnMB0Lm%2F4qObTUUdkb789UT2ua01I%2FfhTSeJuAnD%2B5GxBSK7sShhxxe2XdkCkexV1A8aF83TOZp%2F58wJ6CIcqtLrqKHbYPfxeH2HHyRXH5K1QiMD3i8ox69eW9Mf4M%2FwCiuGkWN43%2FvfGCtH7dkna4HWEhRl26So0CAYKedoZ%2FI8ekFkXmVOoC%2BMS02UD%2FIljhtZTDV71oUTPougTD69Dh5LZSaNSkymyDsrigqCueg6yIV6gyJv%2FzWWxRFzNsz9oSuDRyGO1ONrYYf7XRpii%2Bp1QDQjiYt4zjHmYIvY2bE4Z9JrjJARwNe2iEbwXxdjK%2FtBRGGzo5nQiWVCDW54y3UWyJ3gF4FOZy2xoDTCHnlcio49EGimyfuS9yhd9E6es3lOis5SgYkN7hLQfXavcHqC17Db3LzMvnedwuBpSDCm6%2FHJBjqxAdh7oddhjlgp8XvcZM%2Fwz76vAR7667PA6svUpsHSgIi0Eecm3ayDY8IZ2m3nbkGe6Y6XbroL2Ty3B8JFqSZKoqIAznrHvmk5ALuNzWf5Xo6Gf%2FMOh2hLVoK1sflhAjVz2sstjGqy6%2F0ETMaKS6O%2FJBnfcpmBfX6h1djmwbWmBsF389tmKZ1pB3Ew5SohucOZY2c8wsrkU1hQnz5aVOUoAYjPd0rOTek6eirHpxCi%2B2uv3g%3D%3D&X-Amz-Signature=cbc7b45a41289bcee87ee5321732e36ca00c69aac63fd764785f06a960752cdb&X-Amz-SignedHeaders=host&x-amz-checksum-mode=ENABLED&x-id=GetObject)
Figure 11:
![Effect of steel fiber content on compressive strength in Y direction [21], 33], 34], 36], 38], 40], 41], 55], 56].](https://sciendo-parsed.s3.eu-central-1.amazonaws.com/69388d63a2cfbc128b1cffde/j_rams-2025-0181_fig_011.jpg?X-Amz-Algorithm=AWS4-HMAC-SHA256&X-Amz-Content-Sha256=UNSIGNED-PAYLOAD&X-Amz-Credential=ASIA6AP2G7AKAV7KI53H%2F20251212%2Feu-central-1%2Fs3%2Faws4_request&X-Amz-Date=20251212T231138Z&X-Amz-Expires=3600&X-Amz-Security-Token=IQoJb3JpZ2luX2VjEEQaDGV1LWNlbnRyYWwtMSJHMEUCIQDKNa8y2lc0a0FpyiYuha1NvRqEFP6UmSLtJsox%2FjOcIAIgRf1VR%2F2z9TtrnD%2B1m2Vt%2FH2zcHfFeVyHGIPoaWRACgAqvQUIDRACGgw5NjMxMzQyODk5NDAiDGtbhLw3Wdws79NonSqaBSZ07EiTRHs0TsJ4mpDSApsikNHNkUTsM6tJ1ypQquKDvIFlQRWUtKwuwfFC6Z9Qjqyv5HM13kIXVXrEfdepp9Sy2MUd9XWK25MTx2V7uXsAKua6N5eb4zfBa1ghq2egZ1WQl6SIHLSrw8S6DOT0VWnaz5FJHfarUCokR9qmEoVUEIOTO%2BUlQBSNauCvKzRSmxNmp0zpnVi5kwv9%2FXMQaGOwMuaM4LiYhTmCy9fsWWVk0NEFeaRA3yg8tZX2FfuRlyoHQ2YW5czGNxIGHEgUSg4lwM8AQyAFVAParGUKmL9SBQ4TzugsER1xEppRIfLyhzerzwVQQ526PaVDEKXvMFyMtw7ONZkZqAGpa0M2aDWbZWg0joTQL8pg8CBNOTZFM%2BR86mEUFRNAuCWGBteSKHcxE%2Fw3ls7L36RPgR9DkvxJoCyUd5o4gf95iUetR3UURlD8BlQ9of9Z4WXGHnMB0Lm%2F4qObTUUdkb789UT2ua01I%2FfhTSeJuAnD%2B5GxBSK7sShhxxe2XdkCkexV1A8aF83TOZp%2F58wJ6CIcqtLrqKHbYPfxeH2HHyRXH5K1QiMD3i8ox69eW9Mf4M%2FwCiuGkWN43%2FvfGCtH7dkna4HWEhRl26So0CAYKedoZ%2FI8ekFkXmVOoC%2BMS02UD%2FIljhtZTDV71oUTPougTD69Dh5LZSaNSkymyDsrigqCueg6yIV6gyJv%2FzWWxRFzNsz9oSuDRyGO1ONrYYf7XRpii%2Bp1QDQjiYt4zjHmYIvY2bE4Z9JrjJARwNe2iEbwXxdjK%2FtBRGGzo5nQiWVCDW54y3UWyJ3gF4FOZy2xoDTCHnlcio49EGimyfuS9yhd9E6es3lOis5SgYkN7hLQfXavcHqC17Db3LzMvnedwuBpSDCm6%2FHJBjqxAdh7oddhjlgp8XvcZM%2Fwz76vAR7667PA6svUpsHSgIi0Eecm3ayDY8IZ2m3nbkGe6Y6XbroL2Ty3B8JFqSZKoqIAznrHvmk5ALuNzWf5Xo6Gf%2FMOh2hLVoK1sflhAjVz2sstjGqy6%2F0ETMaKS6O%2FJBnfcpmBfX6h1djmwbWmBsF389tmKZ1pB3Ew5SohucOZY2c8wsrkU1hQnz5aVOUoAYjPd0rOTek6eirHpxCi%2B2uv3g%3D%3D&X-Amz-Signature=3fa2bf2f865f80a7981572ae5a5079bf1bbeb0988a379d8c4db6820d1350ef18&X-Amz-SignedHeaders=host&x-amz-checksum-mode=ENABLED&x-id=GetObject)
Figure 12:
![Effect of steel fiber content on compressive strength in Z direction [21], [33], [34], [35], [36], [37], [38], [39], [40], [41, 47], 55], 56].](https://sciendo-parsed.s3.eu-central-1.amazonaws.com/69388d63a2cfbc128b1cffde/j_rams-2025-0181_fig_012.jpg?X-Amz-Algorithm=AWS4-HMAC-SHA256&X-Amz-Content-Sha256=UNSIGNED-PAYLOAD&X-Amz-Credential=ASIA6AP2G7AKAV7KI53H%2F20251212%2Feu-central-1%2Fs3%2Faws4_request&X-Amz-Date=20251212T231138Z&X-Amz-Expires=3600&X-Amz-Security-Token=IQoJb3JpZ2luX2VjEEQaDGV1LWNlbnRyYWwtMSJHMEUCIQDKNa8y2lc0a0FpyiYuha1NvRqEFP6UmSLtJsox%2FjOcIAIgRf1VR%2F2z9TtrnD%2B1m2Vt%2FH2zcHfFeVyHGIPoaWRACgAqvQUIDRACGgw5NjMxMzQyODk5NDAiDGtbhLw3Wdws79NonSqaBSZ07EiTRHs0TsJ4mpDSApsikNHNkUTsM6tJ1ypQquKDvIFlQRWUtKwuwfFC6Z9Qjqyv5HM13kIXVXrEfdepp9Sy2MUd9XWK25MTx2V7uXsAKua6N5eb4zfBa1ghq2egZ1WQl6SIHLSrw8S6DOT0VWnaz5FJHfarUCokR9qmEoVUEIOTO%2BUlQBSNauCvKzRSmxNmp0zpnVi5kwv9%2FXMQaGOwMuaM4LiYhTmCy9fsWWVk0NEFeaRA3yg8tZX2FfuRlyoHQ2YW5czGNxIGHEgUSg4lwM8AQyAFVAParGUKmL9SBQ4TzugsER1xEppRIfLyhzerzwVQQ526PaVDEKXvMFyMtw7ONZkZqAGpa0M2aDWbZWg0joTQL8pg8CBNOTZFM%2BR86mEUFRNAuCWGBteSKHcxE%2Fw3ls7L36RPgR9DkvxJoCyUd5o4gf95iUetR3UURlD8BlQ9of9Z4WXGHnMB0Lm%2F4qObTUUdkb789UT2ua01I%2FfhTSeJuAnD%2B5GxBSK7sShhxxe2XdkCkexV1A8aF83TOZp%2F58wJ6CIcqtLrqKHbYPfxeH2HHyRXH5K1QiMD3i8ox69eW9Mf4M%2FwCiuGkWN43%2FvfGCtH7dkna4HWEhRl26So0CAYKedoZ%2FI8ekFkXmVOoC%2BMS02UD%2FIljhtZTDV71oUTPougTD69Dh5LZSaNSkymyDsrigqCueg6yIV6gyJv%2FzWWxRFzNsz9oSuDRyGO1ONrYYf7XRpii%2Bp1QDQjiYt4zjHmYIvY2bE4Z9JrjJARwNe2iEbwXxdjK%2FtBRGGzo5nQiWVCDW54y3UWyJ3gF4FOZy2xoDTCHnlcio49EGimyfuS9yhd9E6es3lOis5SgYkN7hLQfXavcHqC17Db3LzMvnedwuBpSDCm6%2FHJBjqxAdh7oddhjlgp8XvcZM%2Fwz76vAR7667PA6svUpsHSgIi0Eecm3ayDY8IZ2m3nbkGe6Y6XbroL2Ty3B8JFqSZKoqIAznrHvmk5ALuNzWf5Xo6Gf%2FMOh2hLVoK1sflhAjVz2sstjGqy6%2F0ETMaKS6O%2FJBnfcpmBfX6h1djmwbWmBsF389tmKZ1pB3Ew5SohucOZY2c8wsrkU1hQnz5aVOUoAYjPd0rOTek6eirHpxCi%2B2uv3g%3D%3D&X-Amz-Signature=ce5c91fe36126c3f029e2b26be47629244ee337f805400d685a5b0150d625948&X-Amz-SignedHeaders=host&x-amz-checksum-mode=ENABLED&x-id=GetObject)
Figure 13:
![Percentage improvement in compressive strength and optimum fiber content [21], [33], [34], [35], [36], [37], [38], [39], [40], [41, 47], 55], 56].](https://sciendo-parsed.s3.eu-central-1.amazonaws.com/69388d63a2cfbc128b1cffde/j_rams-2025-0181_fig_013.jpg?X-Amz-Algorithm=AWS4-HMAC-SHA256&X-Amz-Content-Sha256=UNSIGNED-PAYLOAD&X-Amz-Credential=ASIA6AP2G7AKAV7KI53H%2F20251212%2Feu-central-1%2Fs3%2Faws4_request&X-Amz-Date=20251212T231138Z&X-Amz-Expires=3600&X-Amz-Security-Token=IQoJb3JpZ2luX2VjEEQaDGV1LWNlbnRyYWwtMSJHMEUCIQDKNa8y2lc0a0FpyiYuha1NvRqEFP6UmSLtJsox%2FjOcIAIgRf1VR%2F2z9TtrnD%2B1m2Vt%2FH2zcHfFeVyHGIPoaWRACgAqvQUIDRACGgw5NjMxMzQyODk5NDAiDGtbhLw3Wdws79NonSqaBSZ07EiTRHs0TsJ4mpDSApsikNHNkUTsM6tJ1ypQquKDvIFlQRWUtKwuwfFC6Z9Qjqyv5HM13kIXVXrEfdepp9Sy2MUd9XWK25MTx2V7uXsAKua6N5eb4zfBa1ghq2egZ1WQl6SIHLSrw8S6DOT0VWnaz5FJHfarUCokR9qmEoVUEIOTO%2BUlQBSNauCvKzRSmxNmp0zpnVi5kwv9%2FXMQaGOwMuaM4LiYhTmCy9fsWWVk0NEFeaRA3yg8tZX2FfuRlyoHQ2YW5czGNxIGHEgUSg4lwM8AQyAFVAParGUKmL9SBQ4TzugsER1xEppRIfLyhzerzwVQQ526PaVDEKXvMFyMtw7ONZkZqAGpa0M2aDWbZWg0joTQL8pg8CBNOTZFM%2BR86mEUFRNAuCWGBteSKHcxE%2Fw3ls7L36RPgR9DkvxJoCyUd5o4gf95iUetR3UURlD8BlQ9of9Z4WXGHnMB0Lm%2F4qObTUUdkb789UT2ua01I%2FfhTSeJuAnD%2B5GxBSK7sShhxxe2XdkCkexV1A8aF83TOZp%2F58wJ6CIcqtLrqKHbYPfxeH2HHyRXH5K1QiMD3i8ox69eW9Mf4M%2FwCiuGkWN43%2FvfGCtH7dkna4HWEhRl26So0CAYKedoZ%2FI8ekFkXmVOoC%2BMS02UD%2FIljhtZTDV71oUTPougTD69Dh5LZSaNSkymyDsrigqCueg6yIV6gyJv%2FzWWxRFzNsz9oSuDRyGO1ONrYYf7XRpii%2Bp1QDQjiYt4zjHmYIvY2bE4Z9JrjJARwNe2iEbwXxdjK%2FtBRGGzo5nQiWVCDW54y3UWyJ3gF4FOZy2xoDTCHnlcio49EGimyfuS9yhd9E6es3lOis5SgYkN7hLQfXavcHqC17Db3LzMvnedwuBpSDCm6%2FHJBjqxAdh7oddhjlgp8XvcZM%2Fwz76vAR7667PA6svUpsHSgIi0Eecm3ayDY8IZ2m3nbkGe6Y6XbroL2Ty3B8JFqSZKoqIAznrHvmk5ALuNzWf5Xo6Gf%2FMOh2hLVoK1sflhAjVz2sstjGqy6%2F0ETMaKS6O%2FJBnfcpmBfX6h1djmwbWmBsF389tmKZ1pB3Ew5SohucOZY2c8wsrkU1hQnz5aVOUoAYjPd0rOTek6eirHpxCi%2B2uv3g%3D%3D&X-Amz-Signature=467bd1999ff26cb0e6e2ebc9e9028feb89937ef29a8ed201aef1f796a74d0ec5&X-Amz-SignedHeaders=host&x-amz-checksum-mode=ENABLED&x-id=GetObject)
Figure 14:
![Effect of steel fiber content on flexural strength of 3DPCM [21], [34], [35], [36], [37], [38, 41], [55], [56], [57].](https://sciendo-parsed.s3.eu-central-1.amazonaws.com/69388d63a2cfbc128b1cffde/j_rams-2025-0181_fig_014.jpg?X-Amz-Algorithm=AWS4-HMAC-SHA256&X-Amz-Content-Sha256=UNSIGNED-PAYLOAD&X-Amz-Credential=ASIA6AP2G7AKAV7KI53H%2F20251212%2Feu-central-1%2Fs3%2Faws4_request&X-Amz-Date=20251212T231138Z&X-Amz-Expires=3600&X-Amz-Security-Token=IQoJb3JpZ2luX2VjEEQaDGV1LWNlbnRyYWwtMSJHMEUCIQDKNa8y2lc0a0FpyiYuha1NvRqEFP6UmSLtJsox%2FjOcIAIgRf1VR%2F2z9TtrnD%2B1m2Vt%2FH2zcHfFeVyHGIPoaWRACgAqvQUIDRACGgw5NjMxMzQyODk5NDAiDGtbhLw3Wdws79NonSqaBSZ07EiTRHs0TsJ4mpDSApsikNHNkUTsM6tJ1ypQquKDvIFlQRWUtKwuwfFC6Z9Qjqyv5HM13kIXVXrEfdepp9Sy2MUd9XWK25MTx2V7uXsAKua6N5eb4zfBa1ghq2egZ1WQl6SIHLSrw8S6DOT0VWnaz5FJHfarUCokR9qmEoVUEIOTO%2BUlQBSNauCvKzRSmxNmp0zpnVi5kwv9%2FXMQaGOwMuaM4LiYhTmCy9fsWWVk0NEFeaRA3yg8tZX2FfuRlyoHQ2YW5czGNxIGHEgUSg4lwM8AQyAFVAParGUKmL9SBQ4TzugsER1xEppRIfLyhzerzwVQQ526PaVDEKXvMFyMtw7ONZkZqAGpa0M2aDWbZWg0joTQL8pg8CBNOTZFM%2BR86mEUFRNAuCWGBteSKHcxE%2Fw3ls7L36RPgR9DkvxJoCyUd5o4gf95iUetR3UURlD8BlQ9of9Z4WXGHnMB0Lm%2F4qObTUUdkb789UT2ua01I%2FfhTSeJuAnD%2B5GxBSK7sShhxxe2XdkCkexV1A8aF83TOZp%2F58wJ6CIcqtLrqKHbYPfxeH2HHyRXH5K1QiMD3i8ox69eW9Mf4M%2FwCiuGkWN43%2FvfGCtH7dkna4HWEhRl26So0CAYKedoZ%2FI8ekFkXmVOoC%2BMS02UD%2FIljhtZTDV71oUTPougTD69Dh5LZSaNSkymyDsrigqCueg6yIV6gyJv%2FzWWxRFzNsz9oSuDRyGO1ONrYYf7XRpii%2Bp1QDQjiYt4zjHmYIvY2bE4Z9JrjJARwNe2iEbwXxdjK%2FtBRGGzo5nQiWVCDW54y3UWyJ3gF4FOZy2xoDTCHnlcio49EGimyfuS9yhd9E6es3lOis5SgYkN7hLQfXavcHqC17Db3LzMvnedwuBpSDCm6%2FHJBjqxAdh7oddhjlgp8XvcZM%2Fwz76vAR7667PA6svUpsHSgIi0Eecm3ayDY8IZ2m3nbkGe6Y6XbroL2Ty3B8JFqSZKoqIAznrHvmk5ALuNzWf5Xo6Gf%2FMOh2hLVoK1sflhAjVz2sstjGqy6%2F0ETMaKS6O%2FJBnfcpmBfX6h1djmwbWmBsF389tmKZ1pB3Ew5SohucOZY2c8wsrkU1hQnz5aVOUoAYjPd0rOTek6eirHpxCi%2B2uv3g%3D%3D&X-Amz-Signature=f5164704a889d825f8d71bb39aea45ca833983308af9c4f805221e14a6ebff02&X-Amz-SignedHeaders=host&x-amz-checksum-mode=ENABLED&x-id=GetObject)
Figure 15:
![Percentage improvement in compressive strength and optimum fiber content [21], [34], [35], [36], [37], [38, 41], [55], [56], [57].](https://sciendo-parsed.s3.eu-central-1.amazonaws.com/69388d63a2cfbc128b1cffde/j_rams-2025-0181_fig_015.jpg?X-Amz-Algorithm=AWS4-HMAC-SHA256&X-Amz-Content-Sha256=UNSIGNED-PAYLOAD&X-Amz-Credential=ASIA6AP2G7AKAV7KI53H%2F20251212%2Feu-central-1%2Fs3%2Faws4_request&X-Amz-Date=20251212T231138Z&X-Amz-Expires=3600&X-Amz-Security-Token=IQoJb3JpZ2luX2VjEEQaDGV1LWNlbnRyYWwtMSJHMEUCIQDKNa8y2lc0a0FpyiYuha1NvRqEFP6UmSLtJsox%2FjOcIAIgRf1VR%2F2z9TtrnD%2B1m2Vt%2FH2zcHfFeVyHGIPoaWRACgAqvQUIDRACGgw5NjMxMzQyODk5NDAiDGtbhLw3Wdws79NonSqaBSZ07EiTRHs0TsJ4mpDSApsikNHNkUTsM6tJ1ypQquKDvIFlQRWUtKwuwfFC6Z9Qjqyv5HM13kIXVXrEfdepp9Sy2MUd9XWK25MTx2V7uXsAKua6N5eb4zfBa1ghq2egZ1WQl6SIHLSrw8S6DOT0VWnaz5FJHfarUCokR9qmEoVUEIOTO%2BUlQBSNauCvKzRSmxNmp0zpnVi5kwv9%2FXMQaGOwMuaM4LiYhTmCy9fsWWVk0NEFeaRA3yg8tZX2FfuRlyoHQ2YW5czGNxIGHEgUSg4lwM8AQyAFVAParGUKmL9SBQ4TzugsER1xEppRIfLyhzerzwVQQ526PaVDEKXvMFyMtw7ONZkZqAGpa0M2aDWbZWg0joTQL8pg8CBNOTZFM%2BR86mEUFRNAuCWGBteSKHcxE%2Fw3ls7L36RPgR9DkvxJoCyUd5o4gf95iUetR3UURlD8BlQ9of9Z4WXGHnMB0Lm%2F4qObTUUdkb789UT2ua01I%2FfhTSeJuAnD%2B5GxBSK7sShhxxe2XdkCkexV1A8aF83TOZp%2F58wJ6CIcqtLrqKHbYPfxeH2HHyRXH5K1QiMD3i8ox69eW9Mf4M%2FwCiuGkWN43%2FvfGCtH7dkna4HWEhRl26So0CAYKedoZ%2FI8ekFkXmVOoC%2BMS02UD%2FIljhtZTDV71oUTPougTD69Dh5LZSaNSkymyDsrigqCueg6yIV6gyJv%2FzWWxRFzNsz9oSuDRyGO1ONrYYf7XRpii%2Bp1QDQjiYt4zjHmYIvY2bE4Z9JrjJARwNe2iEbwXxdjK%2FtBRGGzo5nQiWVCDW54y3UWyJ3gF4FOZy2xoDTCHnlcio49EGimyfuS9yhd9E6es3lOis5SgYkN7hLQfXavcHqC17Db3LzMvnedwuBpSDCm6%2FHJBjqxAdh7oddhjlgp8XvcZM%2Fwz76vAR7667PA6svUpsHSgIi0Eecm3ayDY8IZ2m3nbkGe6Y6XbroL2Ty3B8JFqSZKoqIAznrHvmk5ALuNzWf5Xo6Gf%2FMOh2hLVoK1sflhAjVz2sstjGqy6%2F0ETMaKS6O%2FJBnfcpmBfX6h1djmwbWmBsF389tmKZ1pB3Ew5SohucOZY2c8wsrkU1hQnz5aVOUoAYjPd0rOTek6eirHpxCi%2B2uv3g%3D%3D&X-Amz-Signature=0853f11bc0b1bf7c346993b7bf716965fa709ce9482a63444690979ccec5112d&X-Amz-SignedHeaders=host&x-amz-checksum-mode=ENABLED&x-id=GetObject)
Figure 16:
![Effect of steel fibers on post-crack performance of 3DPCM (a) without fibers; (b) with 0.5 % steel fibers; (c) 1.0 % steel fibers; (d) 2.0 % steel fibers [47].](https://sciendo-parsed.s3.eu-central-1.amazonaws.com/69388d63a2cfbc128b1cffde/j_rams-2025-0181_fig_016.jpg?X-Amz-Algorithm=AWS4-HMAC-SHA256&X-Amz-Content-Sha256=UNSIGNED-PAYLOAD&X-Amz-Credential=ASIA6AP2G7AKAV7KI53H%2F20251212%2Feu-central-1%2Fs3%2Faws4_request&X-Amz-Date=20251212T231138Z&X-Amz-Expires=3600&X-Amz-Security-Token=IQoJb3JpZ2luX2VjEEQaDGV1LWNlbnRyYWwtMSJHMEUCIQDKNa8y2lc0a0FpyiYuha1NvRqEFP6UmSLtJsox%2FjOcIAIgRf1VR%2F2z9TtrnD%2B1m2Vt%2FH2zcHfFeVyHGIPoaWRACgAqvQUIDRACGgw5NjMxMzQyODk5NDAiDGtbhLw3Wdws79NonSqaBSZ07EiTRHs0TsJ4mpDSApsikNHNkUTsM6tJ1ypQquKDvIFlQRWUtKwuwfFC6Z9Qjqyv5HM13kIXVXrEfdepp9Sy2MUd9XWK25MTx2V7uXsAKua6N5eb4zfBa1ghq2egZ1WQl6SIHLSrw8S6DOT0VWnaz5FJHfarUCokR9qmEoVUEIOTO%2BUlQBSNauCvKzRSmxNmp0zpnVi5kwv9%2FXMQaGOwMuaM4LiYhTmCy9fsWWVk0NEFeaRA3yg8tZX2FfuRlyoHQ2YW5czGNxIGHEgUSg4lwM8AQyAFVAParGUKmL9SBQ4TzugsER1xEppRIfLyhzerzwVQQ526PaVDEKXvMFyMtw7ONZkZqAGpa0M2aDWbZWg0joTQL8pg8CBNOTZFM%2BR86mEUFRNAuCWGBteSKHcxE%2Fw3ls7L36RPgR9DkvxJoCyUd5o4gf95iUetR3UURlD8BlQ9of9Z4WXGHnMB0Lm%2F4qObTUUdkb789UT2ua01I%2FfhTSeJuAnD%2B5GxBSK7sShhxxe2XdkCkexV1A8aF83TOZp%2F58wJ6CIcqtLrqKHbYPfxeH2HHyRXH5K1QiMD3i8ox69eW9Mf4M%2FwCiuGkWN43%2FvfGCtH7dkna4HWEhRl26So0CAYKedoZ%2FI8ekFkXmVOoC%2BMS02UD%2FIljhtZTDV71oUTPougTD69Dh5LZSaNSkymyDsrigqCueg6yIV6gyJv%2FzWWxRFzNsz9oSuDRyGO1ONrYYf7XRpii%2Bp1QDQjiYt4zjHmYIvY2bE4Z9JrjJARwNe2iEbwXxdjK%2FtBRGGzo5nQiWVCDW54y3UWyJ3gF4FOZy2xoDTCHnlcio49EGimyfuS9yhd9E6es3lOis5SgYkN7hLQfXavcHqC17Db3LzMvnedwuBpSDCm6%2FHJBjqxAdh7oddhjlgp8XvcZM%2Fwz76vAR7667PA6svUpsHSgIi0Eecm3ayDY8IZ2m3nbkGe6Y6XbroL2Ty3B8JFqSZKoqIAznrHvmk5ALuNzWf5Xo6Gf%2FMOh2hLVoK1sflhAjVz2sstjGqy6%2F0ETMaKS6O%2FJBnfcpmBfX6h1djmwbWmBsF389tmKZ1pB3Ew5SohucOZY2c8wsrkU1hQnz5aVOUoAYjPd0rOTek6eirHpxCi%2B2uv3g%3D%3D&X-Amz-Signature=52cc76691d1c691673e20c63b2e6fc78becc0b7b17ab55a3c2d0ed516bae1dbb&X-Amz-SignedHeaders=host&x-amz-checksum-mode=ENABLED&x-id=GetObject)
Figure 17:
![Comparison of post-crack behavior of 3d printed matrix (without steel fibers) and composite (with steel fibers) [54].](https://sciendo-parsed.s3.eu-central-1.amazonaws.com/69388d63a2cfbc128b1cffde/j_rams-2025-0181_fig_017.jpg?X-Amz-Algorithm=AWS4-HMAC-SHA256&X-Amz-Content-Sha256=UNSIGNED-PAYLOAD&X-Amz-Credential=ASIA6AP2G7AKAV7KI53H%2F20251212%2Feu-central-1%2Fs3%2Faws4_request&X-Amz-Date=20251212T231138Z&X-Amz-Expires=3600&X-Amz-Security-Token=IQoJb3JpZ2luX2VjEEQaDGV1LWNlbnRyYWwtMSJHMEUCIQDKNa8y2lc0a0FpyiYuha1NvRqEFP6UmSLtJsox%2FjOcIAIgRf1VR%2F2z9TtrnD%2B1m2Vt%2FH2zcHfFeVyHGIPoaWRACgAqvQUIDRACGgw5NjMxMzQyODk5NDAiDGtbhLw3Wdws79NonSqaBSZ07EiTRHs0TsJ4mpDSApsikNHNkUTsM6tJ1ypQquKDvIFlQRWUtKwuwfFC6Z9Qjqyv5HM13kIXVXrEfdepp9Sy2MUd9XWK25MTx2V7uXsAKua6N5eb4zfBa1ghq2egZ1WQl6SIHLSrw8S6DOT0VWnaz5FJHfarUCokR9qmEoVUEIOTO%2BUlQBSNauCvKzRSmxNmp0zpnVi5kwv9%2FXMQaGOwMuaM4LiYhTmCy9fsWWVk0NEFeaRA3yg8tZX2FfuRlyoHQ2YW5czGNxIGHEgUSg4lwM8AQyAFVAParGUKmL9SBQ4TzugsER1xEppRIfLyhzerzwVQQ526PaVDEKXvMFyMtw7ONZkZqAGpa0M2aDWbZWg0joTQL8pg8CBNOTZFM%2BR86mEUFRNAuCWGBteSKHcxE%2Fw3ls7L36RPgR9DkvxJoCyUd5o4gf95iUetR3UURlD8BlQ9of9Z4WXGHnMB0Lm%2F4qObTUUdkb789UT2ua01I%2FfhTSeJuAnD%2B5GxBSK7sShhxxe2XdkCkexV1A8aF83TOZp%2F58wJ6CIcqtLrqKHbYPfxeH2HHyRXH5K1QiMD3i8ox69eW9Mf4M%2FwCiuGkWN43%2FvfGCtH7dkna4HWEhRl26So0CAYKedoZ%2FI8ekFkXmVOoC%2BMS02UD%2FIljhtZTDV71oUTPougTD69Dh5LZSaNSkymyDsrigqCueg6yIV6gyJv%2FzWWxRFzNsz9oSuDRyGO1ONrYYf7XRpii%2Bp1QDQjiYt4zjHmYIvY2bE4Z9JrjJARwNe2iEbwXxdjK%2FtBRGGzo5nQiWVCDW54y3UWyJ3gF4FOZy2xoDTCHnlcio49EGimyfuS9yhd9E6es3lOis5SgYkN7hLQfXavcHqC17Db3LzMvnedwuBpSDCm6%2FHJBjqxAdh7oddhjlgp8XvcZM%2Fwz76vAR7667PA6svUpsHSgIi0Eecm3ayDY8IZ2m3nbkGe6Y6XbroL2Ty3B8JFqSZKoqIAznrHvmk5ALuNzWf5Xo6Gf%2FMOh2hLVoK1sflhAjVz2sstjGqy6%2F0ETMaKS6O%2FJBnfcpmBfX6h1djmwbWmBsF389tmKZ1pB3Ew5SohucOZY2c8wsrkU1hQnz5aVOUoAYjPd0rOTek6eirHpxCi%2B2uv3g%3D%3D&X-Amz-Signature=64c00e05fce3622e9199de767771006e63874ec154f605f6578bbe85202cb0fa&X-Amz-SignedHeaders=host&x-amz-checksum-mode=ENABLED&x-id=GetObject)
Figure 18:
![Morphology of steel fiber-matrix ITZ: (a) Mold cast with hooked fibers; (b) 3DPC with hooked fibers; (c) mold cast with straight fibers (d) 3DPC with hooked fibers [40].](https://sciendo-parsed.s3.eu-central-1.amazonaws.com/69388d63a2cfbc128b1cffde/j_rams-2025-0181_fig_018.jpg?X-Amz-Algorithm=AWS4-HMAC-SHA256&X-Amz-Content-Sha256=UNSIGNED-PAYLOAD&X-Amz-Credential=ASIA6AP2G7AKAV7KI53H%2F20251212%2Feu-central-1%2Fs3%2Faws4_request&X-Amz-Date=20251212T231138Z&X-Amz-Expires=3600&X-Amz-Security-Token=IQoJb3JpZ2luX2VjEEQaDGV1LWNlbnRyYWwtMSJHMEUCIQDKNa8y2lc0a0FpyiYuha1NvRqEFP6UmSLtJsox%2FjOcIAIgRf1VR%2F2z9TtrnD%2B1m2Vt%2FH2zcHfFeVyHGIPoaWRACgAqvQUIDRACGgw5NjMxMzQyODk5NDAiDGtbhLw3Wdws79NonSqaBSZ07EiTRHs0TsJ4mpDSApsikNHNkUTsM6tJ1ypQquKDvIFlQRWUtKwuwfFC6Z9Qjqyv5HM13kIXVXrEfdepp9Sy2MUd9XWK25MTx2V7uXsAKua6N5eb4zfBa1ghq2egZ1WQl6SIHLSrw8S6DOT0VWnaz5FJHfarUCokR9qmEoVUEIOTO%2BUlQBSNauCvKzRSmxNmp0zpnVi5kwv9%2FXMQaGOwMuaM4LiYhTmCy9fsWWVk0NEFeaRA3yg8tZX2FfuRlyoHQ2YW5czGNxIGHEgUSg4lwM8AQyAFVAParGUKmL9SBQ4TzugsER1xEppRIfLyhzerzwVQQ526PaVDEKXvMFyMtw7ONZkZqAGpa0M2aDWbZWg0joTQL8pg8CBNOTZFM%2BR86mEUFRNAuCWGBteSKHcxE%2Fw3ls7L36RPgR9DkvxJoCyUd5o4gf95iUetR3UURlD8BlQ9of9Z4WXGHnMB0Lm%2F4qObTUUdkb789UT2ua01I%2FfhTSeJuAnD%2B5GxBSK7sShhxxe2XdkCkexV1A8aF83TOZp%2F58wJ6CIcqtLrqKHbYPfxeH2HHyRXH5K1QiMD3i8ox69eW9Mf4M%2FwCiuGkWN43%2FvfGCtH7dkna4HWEhRl26So0CAYKedoZ%2FI8ekFkXmVOoC%2BMS02UD%2FIljhtZTDV71oUTPougTD69Dh5LZSaNSkymyDsrigqCueg6yIV6gyJv%2FzWWxRFzNsz9oSuDRyGO1ONrYYf7XRpii%2Bp1QDQjiYt4zjHmYIvY2bE4Z9JrjJARwNe2iEbwXxdjK%2FtBRGGzo5nQiWVCDW54y3UWyJ3gF4FOZy2xoDTCHnlcio49EGimyfuS9yhd9E6es3lOis5SgYkN7hLQfXavcHqC17Db3LzMvnedwuBpSDCm6%2FHJBjqxAdh7oddhjlgp8XvcZM%2Fwz76vAR7667PA6svUpsHSgIi0Eecm3ayDY8IZ2m3nbkGe6Y6XbroL2Ty3B8JFqSZKoqIAznrHvmk5ALuNzWf5Xo6Gf%2FMOh2hLVoK1sflhAjVz2sstjGqy6%2F0ETMaKS6O%2FJBnfcpmBfX6h1djmwbWmBsF389tmKZ1pB3Ew5SohucOZY2c8wsrkU1hQnz5aVOUoAYjPd0rOTek6eirHpxCi%2B2uv3g%3D%3D&X-Amz-Signature=a9ce7b00d01bab25d54e5446148671480a65ef0ae5469bf8e4a7c3714bd64b09&X-Amz-SignedHeaders=host&x-amz-checksum-mode=ENABLED&x-id=GetObject)
Figure 19:
![Fiber-matrix ITZ with mineral modifier in 3DPCM [58].](https://sciendo-parsed.s3.eu-central-1.amazonaws.com/69388d63a2cfbc128b1cffde/j_rams-2025-0181_fig_019.jpg?X-Amz-Algorithm=AWS4-HMAC-SHA256&X-Amz-Content-Sha256=UNSIGNED-PAYLOAD&X-Amz-Credential=ASIA6AP2G7AKAV7KI53H%2F20251212%2Feu-central-1%2Fs3%2Faws4_request&X-Amz-Date=20251212T231138Z&X-Amz-Expires=3600&X-Amz-Security-Token=IQoJb3JpZ2luX2VjEEQaDGV1LWNlbnRyYWwtMSJHMEUCIQDKNa8y2lc0a0FpyiYuha1NvRqEFP6UmSLtJsox%2FjOcIAIgRf1VR%2F2z9TtrnD%2B1m2Vt%2FH2zcHfFeVyHGIPoaWRACgAqvQUIDRACGgw5NjMxMzQyODk5NDAiDGtbhLw3Wdws79NonSqaBSZ07EiTRHs0TsJ4mpDSApsikNHNkUTsM6tJ1ypQquKDvIFlQRWUtKwuwfFC6Z9Qjqyv5HM13kIXVXrEfdepp9Sy2MUd9XWK25MTx2V7uXsAKua6N5eb4zfBa1ghq2egZ1WQl6SIHLSrw8S6DOT0VWnaz5FJHfarUCokR9qmEoVUEIOTO%2BUlQBSNauCvKzRSmxNmp0zpnVi5kwv9%2FXMQaGOwMuaM4LiYhTmCy9fsWWVk0NEFeaRA3yg8tZX2FfuRlyoHQ2YW5czGNxIGHEgUSg4lwM8AQyAFVAParGUKmL9SBQ4TzugsER1xEppRIfLyhzerzwVQQ526PaVDEKXvMFyMtw7ONZkZqAGpa0M2aDWbZWg0joTQL8pg8CBNOTZFM%2BR86mEUFRNAuCWGBteSKHcxE%2Fw3ls7L36RPgR9DkvxJoCyUd5o4gf95iUetR3UURlD8BlQ9of9Z4WXGHnMB0Lm%2F4qObTUUdkb789UT2ua01I%2FfhTSeJuAnD%2B5GxBSK7sShhxxe2XdkCkexV1A8aF83TOZp%2F58wJ6CIcqtLrqKHbYPfxeH2HHyRXH5K1QiMD3i8ox69eW9Mf4M%2FwCiuGkWN43%2FvfGCtH7dkna4HWEhRl26So0CAYKedoZ%2FI8ekFkXmVOoC%2BMS02UD%2FIljhtZTDV71oUTPougTD69Dh5LZSaNSkymyDsrigqCueg6yIV6gyJv%2FzWWxRFzNsz9oSuDRyGO1ONrYYf7XRpii%2Bp1QDQjiYt4zjHmYIvY2bE4Z9JrjJARwNe2iEbwXxdjK%2FtBRGGzo5nQiWVCDW54y3UWyJ3gF4FOZy2xoDTCHnlcio49EGimyfuS9yhd9E6es3lOis5SgYkN7hLQfXavcHqC17Db3LzMvnedwuBpSDCm6%2FHJBjqxAdh7oddhjlgp8XvcZM%2Fwz76vAR7667PA6svUpsHSgIi0Eecm3ayDY8IZ2m3nbkGe6Y6XbroL2Ty3B8JFqSZKoqIAznrHvmk5ALuNzWf5Xo6Gf%2FMOh2hLVoK1sflhAjVz2sstjGqy6%2F0ETMaKS6O%2FJBnfcpmBfX6h1djmwbWmBsF389tmKZ1pB3Ew5SohucOZY2c8wsrkU1hQnz5aVOUoAYjPd0rOTek6eirHpxCi%2B2uv3g%3D%3D&X-Amz-Signature=3b2f29c627de129fbec5d2775e1982c368138fb38d4bd1690f544b8f289c54d3&X-Amz-SignedHeaders=host&x-amz-checksum-mode=ENABLED&x-id=GetObject)
Figure 20:
![Micromorphology of fiber-3DPCM matrix ITZ after failure: (a) Pullout of steel fibers; (b) rupture of basalt fibers [38].](https://sciendo-parsed.s3.eu-central-1.amazonaws.com/69388d63a2cfbc128b1cffde/j_rams-2025-0181_fig_020.jpg?X-Amz-Algorithm=AWS4-HMAC-SHA256&X-Amz-Content-Sha256=UNSIGNED-PAYLOAD&X-Amz-Credential=ASIA6AP2G7AKAV7KI53H%2F20251212%2Feu-central-1%2Fs3%2Faws4_request&X-Amz-Date=20251212T231138Z&X-Amz-Expires=3600&X-Amz-Security-Token=IQoJb3JpZ2luX2VjEEQaDGV1LWNlbnRyYWwtMSJHMEUCIQDKNa8y2lc0a0FpyiYuha1NvRqEFP6UmSLtJsox%2FjOcIAIgRf1VR%2F2z9TtrnD%2B1m2Vt%2FH2zcHfFeVyHGIPoaWRACgAqvQUIDRACGgw5NjMxMzQyODk5NDAiDGtbhLw3Wdws79NonSqaBSZ07EiTRHs0TsJ4mpDSApsikNHNkUTsM6tJ1ypQquKDvIFlQRWUtKwuwfFC6Z9Qjqyv5HM13kIXVXrEfdepp9Sy2MUd9XWK25MTx2V7uXsAKua6N5eb4zfBa1ghq2egZ1WQl6SIHLSrw8S6DOT0VWnaz5FJHfarUCokR9qmEoVUEIOTO%2BUlQBSNauCvKzRSmxNmp0zpnVi5kwv9%2FXMQaGOwMuaM4LiYhTmCy9fsWWVk0NEFeaRA3yg8tZX2FfuRlyoHQ2YW5czGNxIGHEgUSg4lwM8AQyAFVAParGUKmL9SBQ4TzugsER1xEppRIfLyhzerzwVQQ526PaVDEKXvMFyMtw7ONZkZqAGpa0M2aDWbZWg0joTQL8pg8CBNOTZFM%2BR86mEUFRNAuCWGBteSKHcxE%2Fw3ls7L36RPgR9DkvxJoCyUd5o4gf95iUetR3UURlD8BlQ9of9Z4WXGHnMB0Lm%2F4qObTUUdkb789UT2ua01I%2FfhTSeJuAnD%2B5GxBSK7sShhxxe2XdkCkexV1A8aF83TOZp%2F58wJ6CIcqtLrqKHbYPfxeH2HHyRXH5K1QiMD3i8ox69eW9Mf4M%2FwCiuGkWN43%2FvfGCtH7dkna4HWEhRl26So0CAYKedoZ%2FI8ekFkXmVOoC%2BMS02UD%2FIljhtZTDV71oUTPougTD69Dh5LZSaNSkymyDsrigqCueg6yIV6gyJv%2FzWWxRFzNsz9oSuDRyGO1ONrYYf7XRpii%2Bp1QDQjiYt4zjHmYIvY2bE4Z9JrjJARwNe2iEbwXxdjK%2FtBRGGzo5nQiWVCDW54y3UWyJ3gF4FOZy2xoDTCHnlcio49EGimyfuS9yhd9E6es3lOis5SgYkN7hLQfXavcHqC17Db3LzMvnedwuBpSDCm6%2FHJBjqxAdh7oddhjlgp8XvcZM%2Fwz76vAR7667PA6svUpsHSgIi0Eecm3ayDY8IZ2m3nbkGe6Y6XbroL2Ty3B8JFqSZKoqIAznrHvmk5ALuNzWf5Xo6Gf%2FMOh2hLVoK1sflhAjVz2sstjGqy6%2F0ETMaKS6O%2FJBnfcpmBfX6h1djmwbWmBsF389tmKZ1pB3Ew5SohucOZY2c8wsrkU1hQnz5aVOUoAYjPd0rOTek6eirHpxCi%2B2uv3g%3D%3D&X-Amz-Signature=5b948f847d8bd3047dbe9086d1e18f0961da49f51a991cf7c866bba28dcb2e22&X-Amz-SignedHeaders=host&x-amz-checksum-mode=ENABLED&x-id=GetObject)
Figure 21:
![Alignment tendency of steel fibers along print direction: a) Schematic of fiber alignment during extrusion; b) CT scan of mold cast sample; c) CT scan of ed printed sample [59].](https://sciendo-parsed.s3.eu-central-1.amazonaws.com/69388d63a2cfbc128b1cffde/j_rams-2025-0181_fig_021.jpg?X-Amz-Algorithm=AWS4-HMAC-SHA256&X-Amz-Content-Sha256=UNSIGNED-PAYLOAD&X-Amz-Credential=ASIA6AP2G7AKAV7KI53H%2F20251212%2Feu-central-1%2Fs3%2Faws4_request&X-Amz-Date=20251212T231138Z&X-Amz-Expires=3600&X-Amz-Security-Token=IQoJb3JpZ2luX2VjEEQaDGV1LWNlbnRyYWwtMSJHMEUCIQDKNa8y2lc0a0FpyiYuha1NvRqEFP6UmSLtJsox%2FjOcIAIgRf1VR%2F2z9TtrnD%2B1m2Vt%2FH2zcHfFeVyHGIPoaWRACgAqvQUIDRACGgw5NjMxMzQyODk5NDAiDGtbhLw3Wdws79NonSqaBSZ07EiTRHs0TsJ4mpDSApsikNHNkUTsM6tJ1ypQquKDvIFlQRWUtKwuwfFC6Z9Qjqyv5HM13kIXVXrEfdepp9Sy2MUd9XWK25MTx2V7uXsAKua6N5eb4zfBa1ghq2egZ1WQl6SIHLSrw8S6DOT0VWnaz5FJHfarUCokR9qmEoVUEIOTO%2BUlQBSNauCvKzRSmxNmp0zpnVi5kwv9%2FXMQaGOwMuaM4LiYhTmCy9fsWWVk0NEFeaRA3yg8tZX2FfuRlyoHQ2YW5czGNxIGHEgUSg4lwM8AQyAFVAParGUKmL9SBQ4TzugsER1xEppRIfLyhzerzwVQQ526PaVDEKXvMFyMtw7ONZkZqAGpa0M2aDWbZWg0joTQL8pg8CBNOTZFM%2BR86mEUFRNAuCWGBteSKHcxE%2Fw3ls7L36RPgR9DkvxJoCyUd5o4gf95iUetR3UURlD8BlQ9of9Z4WXGHnMB0Lm%2F4qObTUUdkb789UT2ua01I%2FfhTSeJuAnD%2B5GxBSK7sShhxxe2XdkCkexV1A8aF83TOZp%2F58wJ6CIcqtLrqKHbYPfxeH2HHyRXH5K1QiMD3i8ox69eW9Mf4M%2FwCiuGkWN43%2FvfGCtH7dkna4HWEhRl26So0CAYKedoZ%2FI8ekFkXmVOoC%2BMS02UD%2FIljhtZTDV71oUTPougTD69Dh5LZSaNSkymyDsrigqCueg6yIV6gyJv%2FzWWxRFzNsz9oSuDRyGO1ONrYYf7XRpii%2Bp1QDQjiYt4zjHmYIvY2bE4Z9JrjJARwNe2iEbwXxdjK%2FtBRGGzo5nQiWVCDW54y3UWyJ3gF4FOZy2xoDTCHnlcio49EGimyfuS9yhd9E6es3lOis5SgYkN7hLQfXavcHqC17Db3LzMvnedwuBpSDCm6%2FHJBjqxAdh7oddhjlgp8XvcZM%2Fwz76vAR7667PA6svUpsHSgIi0Eecm3ayDY8IZ2m3nbkGe6Y6XbroL2Ty3B8JFqSZKoqIAznrHvmk5ALuNzWf5Xo6Gf%2FMOh2hLVoK1sflhAjVz2sstjGqy6%2F0ETMaKS6O%2FJBnfcpmBfX6h1djmwbWmBsF389tmKZ1pB3Ew5SohucOZY2c8wsrkU1hQnz5aVOUoAYjPd0rOTek6eirHpxCi%2B2uv3g%3D%3D&X-Amz-Signature=58cf488303d537445863feae9be957abc0860c9060d1021d6ebb12f1d214ef05&X-Amz-SignedHeaders=host&x-amz-checksum-mode=ENABLED&x-id=GetObject)
Figure 22:
![Steel fibers arranged in a rectangular infill pattern proposed by Li, Khieu [16].](https://sciendo-parsed.s3.eu-central-1.amazonaws.com/69388d63a2cfbc128b1cffde/j_rams-2025-0181_fig_022.jpg?X-Amz-Algorithm=AWS4-HMAC-SHA256&X-Amz-Content-Sha256=UNSIGNED-PAYLOAD&X-Amz-Credential=ASIA6AP2G7AKAV7KI53H%2F20251212%2Feu-central-1%2Fs3%2Faws4_request&X-Amz-Date=20251212T231138Z&X-Amz-Expires=3600&X-Amz-Security-Token=IQoJb3JpZ2luX2VjEEQaDGV1LWNlbnRyYWwtMSJHMEUCIQDKNa8y2lc0a0FpyiYuha1NvRqEFP6UmSLtJsox%2FjOcIAIgRf1VR%2F2z9TtrnD%2B1m2Vt%2FH2zcHfFeVyHGIPoaWRACgAqvQUIDRACGgw5NjMxMzQyODk5NDAiDGtbhLw3Wdws79NonSqaBSZ07EiTRHs0TsJ4mpDSApsikNHNkUTsM6tJ1ypQquKDvIFlQRWUtKwuwfFC6Z9Qjqyv5HM13kIXVXrEfdepp9Sy2MUd9XWK25MTx2V7uXsAKua6N5eb4zfBa1ghq2egZ1WQl6SIHLSrw8S6DOT0VWnaz5FJHfarUCokR9qmEoVUEIOTO%2BUlQBSNauCvKzRSmxNmp0zpnVi5kwv9%2FXMQaGOwMuaM4LiYhTmCy9fsWWVk0NEFeaRA3yg8tZX2FfuRlyoHQ2YW5czGNxIGHEgUSg4lwM8AQyAFVAParGUKmL9SBQ4TzugsER1xEppRIfLyhzerzwVQQ526PaVDEKXvMFyMtw7ONZkZqAGpa0M2aDWbZWg0joTQL8pg8CBNOTZFM%2BR86mEUFRNAuCWGBteSKHcxE%2Fw3ls7L36RPgR9DkvxJoCyUd5o4gf95iUetR3UURlD8BlQ9of9Z4WXGHnMB0Lm%2F4qObTUUdkb789UT2ua01I%2FfhTSeJuAnD%2B5GxBSK7sShhxxe2XdkCkexV1A8aF83TOZp%2F58wJ6CIcqtLrqKHbYPfxeH2HHyRXH5K1QiMD3i8ox69eW9Mf4M%2FwCiuGkWN43%2FvfGCtH7dkna4HWEhRl26So0CAYKedoZ%2FI8ekFkXmVOoC%2BMS02UD%2FIljhtZTDV71oUTPougTD69Dh5LZSaNSkymyDsrigqCueg6yIV6gyJv%2FzWWxRFzNsz9oSuDRyGO1ONrYYf7XRpii%2Bp1QDQjiYt4zjHmYIvY2bE4Z9JrjJARwNe2iEbwXxdjK%2FtBRGGzo5nQiWVCDW54y3UWyJ3gF4FOZy2xoDTCHnlcio49EGimyfuS9yhd9E6es3lOis5SgYkN7hLQfXavcHqC17Db3LzMvnedwuBpSDCm6%2FHJBjqxAdh7oddhjlgp8XvcZM%2Fwz76vAR7667PA6svUpsHSgIi0Eecm3ayDY8IZ2m3nbkGe6Y6XbroL2Ty3B8JFqSZKoqIAznrHvmk5ALuNzWf5Xo6Gf%2FMOh2hLVoK1sflhAjVz2sstjGqy6%2F0ETMaKS6O%2FJBnfcpmBfX6h1djmwbWmBsF389tmKZ1pB3Ew5SohucOZY2c8wsrkU1hQnz5aVOUoAYjPd0rOTek6eirHpxCi%2B2uv3g%3D%3D&X-Amz-Signature=8ce5d9c6cd7d1fd7ed44cd1f39802e55b994ac7584c4fba19c01a025d5665863&X-Amz-SignedHeaders=host&x-amz-checksum-mode=ENABLED&x-id=GetObject)
Figure 23:
![Fiber alignment under varying magnetic field intensities [41].](https://sciendo-parsed.s3.eu-central-1.amazonaws.com/69388d63a2cfbc128b1cffde/j_rams-2025-0181_fig_023.jpg?X-Amz-Algorithm=AWS4-HMAC-SHA256&X-Amz-Content-Sha256=UNSIGNED-PAYLOAD&X-Amz-Credential=ASIA6AP2G7AKAV7KI53H%2F20251212%2Feu-central-1%2Fs3%2Faws4_request&X-Amz-Date=20251212T231138Z&X-Amz-Expires=3600&X-Amz-Security-Token=IQoJb3JpZ2luX2VjEEQaDGV1LWNlbnRyYWwtMSJHMEUCIQDKNa8y2lc0a0FpyiYuha1NvRqEFP6UmSLtJsox%2FjOcIAIgRf1VR%2F2z9TtrnD%2B1m2Vt%2FH2zcHfFeVyHGIPoaWRACgAqvQUIDRACGgw5NjMxMzQyODk5NDAiDGtbhLw3Wdws79NonSqaBSZ07EiTRHs0TsJ4mpDSApsikNHNkUTsM6tJ1ypQquKDvIFlQRWUtKwuwfFC6Z9Qjqyv5HM13kIXVXrEfdepp9Sy2MUd9XWK25MTx2V7uXsAKua6N5eb4zfBa1ghq2egZ1WQl6SIHLSrw8S6DOT0VWnaz5FJHfarUCokR9qmEoVUEIOTO%2BUlQBSNauCvKzRSmxNmp0zpnVi5kwv9%2FXMQaGOwMuaM4LiYhTmCy9fsWWVk0NEFeaRA3yg8tZX2FfuRlyoHQ2YW5czGNxIGHEgUSg4lwM8AQyAFVAParGUKmL9SBQ4TzugsER1xEppRIfLyhzerzwVQQ526PaVDEKXvMFyMtw7ONZkZqAGpa0M2aDWbZWg0joTQL8pg8CBNOTZFM%2BR86mEUFRNAuCWGBteSKHcxE%2Fw3ls7L36RPgR9DkvxJoCyUd5o4gf95iUetR3UURlD8BlQ9of9Z4WXGHnMB0Lm%2F4qObTUUdkb789UT2ua01I%2FfhTSeJuAnD%2B5GxBSK7sShhxxe2XdkCkexV1A8aF83TOZp%2F58wJ6CIcqtLrqKHbYPfxeH2HHyRXH5K1QiMD3i8ox69eW9Mf4M%2FwCiuGkWN43%2FvfGCtH7dkna4HWEhRl26So0CAYKedoZ%2FI8ekFkXmVOoC%2BMS02UD%2FIljhtZTDV71oUTPougTD69Dh5LZSaNSkymyDsrigqCueg6yIV6gyJv%2FzWWxRFzNsz9oSuDRyGO1ONrYYf7XRpii%2Bp1QDQjiYt4zjHmYIvY2bE4Z9JrjJARwNe2iEbwXxdjK%2FtBRGGzo5nQiWVCDW54y3UWyJ3gF4FOZy2xoDTCHnlcio49EGimyfuS9yhd9E6es3lOis5SgYkN7hLQfXavcHqC17Db3LzMvnedwuBpSDCm6%2FHJBjqxAdh7oddhjlgp8XvcZM%2Fwz76vAR7667PA6svUpsHSgIi0Eecm3ayDY8IZ2m3nbkGe6Y6XbroL2Ty3B8JFqSZKoqIAznrHvmk5ALuNzWf5Xo6Gf%2FMOh2hLVoK1sflhAjVz2sstjGqy6%2F0ETMaKS6O%2FJBnfcpmBfX6h1djmwbWmBsF389tmKZ1pB3Ew5SohucOZY2c8wsrkU1hQnz5aVOUoAYjPd0rOTek6eirHpxCi%2B2uv3g%3D%3D&X-Amz-Signature=9952ce12ae81b8a098532787db60b78f4aeaf4e5922f75779562bc4224e3e00b&X-Amz-SignedHeaders=host&x-amz-checksum-mode=ENABLED&x-id=GetObject)
Figure 24:

Summary of steel fiber effects on printability parameters_
| Fiber content (vol%) | Extrudability parameter | Buildability parameter | Effect on extrudability | Effect on buildability | Optimum fiber dosage | Ref. |
|---|---|---|---|---|---|---|
| 0.5–2.5 % | 300 mm long filament with consistent width (40 mm) | Positive | 2 % | Li, Wei and Khayat [53] | ||
| 0.5–2.5 % | – | Shape retention rate (%) | – | Positive | 2 % | Zhang, Zhu [47] |
| 0.5–2 % | – | Bottom layer deformation | – | Negative | – | Giwa, Game [37] |
| 0.1–0.9 % | 50 cm long filament with consistent width (20 mm) | Height loss rate (%) | Positive | Positive | – | Xia, Geng [38] |
| 2 % | 250 mm long filament with consistent width | Shape retention ability index | Positive | Positive | 2 % | Arunothayan, Nematollahi [54] |
| 0.5–1.5 % | 300 mm long filament with consistent width (40 mm) | Height of 8 layers | Positive | Positive | 1 % | Jia, Zhou [40] |
Mix proportions used for steel fiber reinforced 3DPCM_
| Binder content (kg/m3) | Aggregate (kg/m3) | Aggregate/binder | Steel fibers content kg/m3 (vol%) | Fiber length (mm) | Water kg/m3 | SPa kg/m3 (%) | VMb kg/m3 (%) | Ref. | |
|---|---|---|---|---|---|---|---|---|---|
| OPC | SCM | ||||||||
| 750 | 330 | 1,080 | 1 | 78 (1) | 6, 10 | 154 | 10 | 1.08 | [33] |
| 483 | 590 | 1,074 | 1 | 58.9 (0.75) | 6 | 182 | – | – | [34] |
| 802–818 | – | 1,122–1,145 | 1.4 | 77-153 (0–2) | 13 | 280–286 | (0.018-0.130) | – | [35] |
| 746–760 | 75–76 | 1,148–1,177 | 1.4 | 77-153 (1–2) | 13 | 261–266 | (0.16–0.32) | – | |
| 750 | 330 | 1,080 | 1 | 19.5–78 (0.25–1.00) | 6, 10 | 154 | 10 | 1.08 | [36] |
| 798–818 | – | 1,117–1,145 | 1.4 | 39-190 (0.5–2.5) | 13 | 279–286 | (0.02–0.22) | – | [37] |
| 712–726 | – | 1,281–1,306 | 1.8 | 39-153 (0.5–2.0) | 13 | 249–254 | (0.09–0.27) | – | |
| 725 | 75 | 1,000 | 1 | (0.1–0.9) | 6, 9, 12 | 260 | 6 (0.06) | – | [38] |
| 694 | 231 | 1,180 | 1.3 | (1.5–3.0) | 35 | 192 | (1.5) | (0.25–0.50) | [39] |
| 843 | 590 | 1,074 | 0.75 | 19.6–78.5 (0.25–1.00) | 3, 6 | 182 | 10.7 (1) | – | [21] |
| 630 | 270 | 900 | 1 | (0.5–1.5) | 13 | 180 | 5.94 | – | [40] |
| 2,000 | – | 2000 | 1 | (0.25–0.75) | 25 | 440 | 10 | (0.25) | [41] |
| 758 | 200 | 1,027 | 1.07 | (0.5) | 13 | 230 | – | – | [42] |
| 788 | 200 | 1,100 | 1.1 | 78-234 (1–3) | 3.3–17.8 | 138–177 | 10 | (0.5–2.0) | [43] |