Fig. 1
Fig. 2
Fig. 3
Fig. 4
Fig. 5
Fig. 6
Fig. 7
Fig. 8
Fig. 9
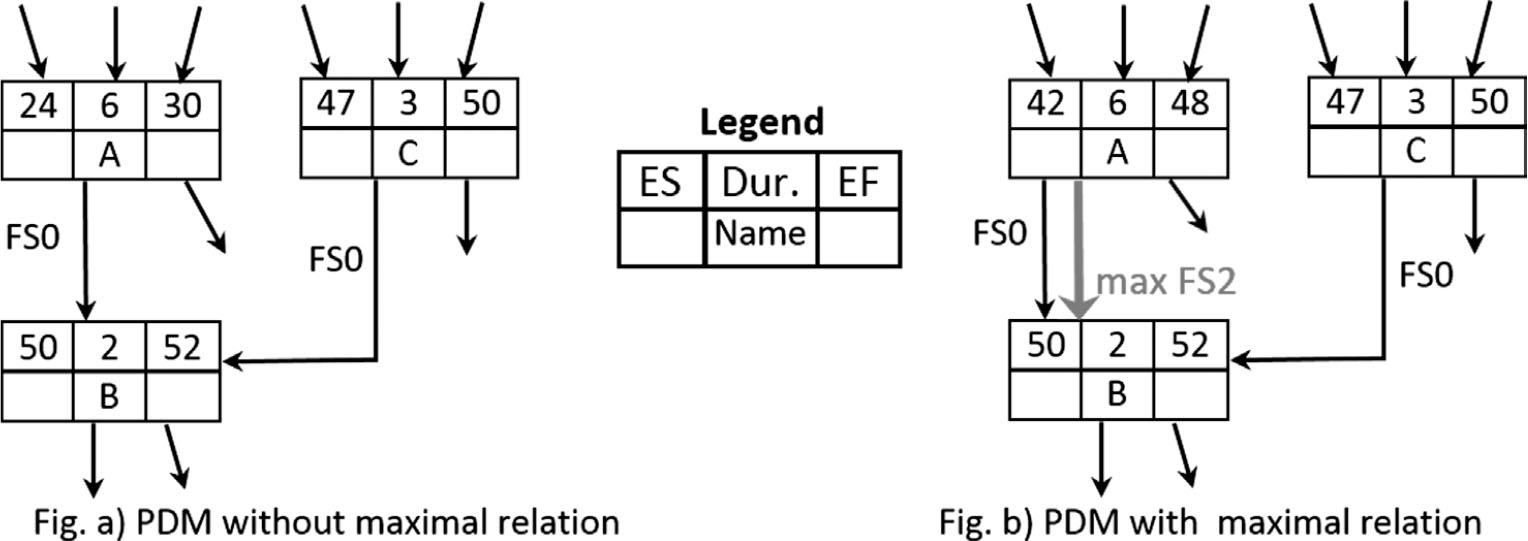
Fig. 10
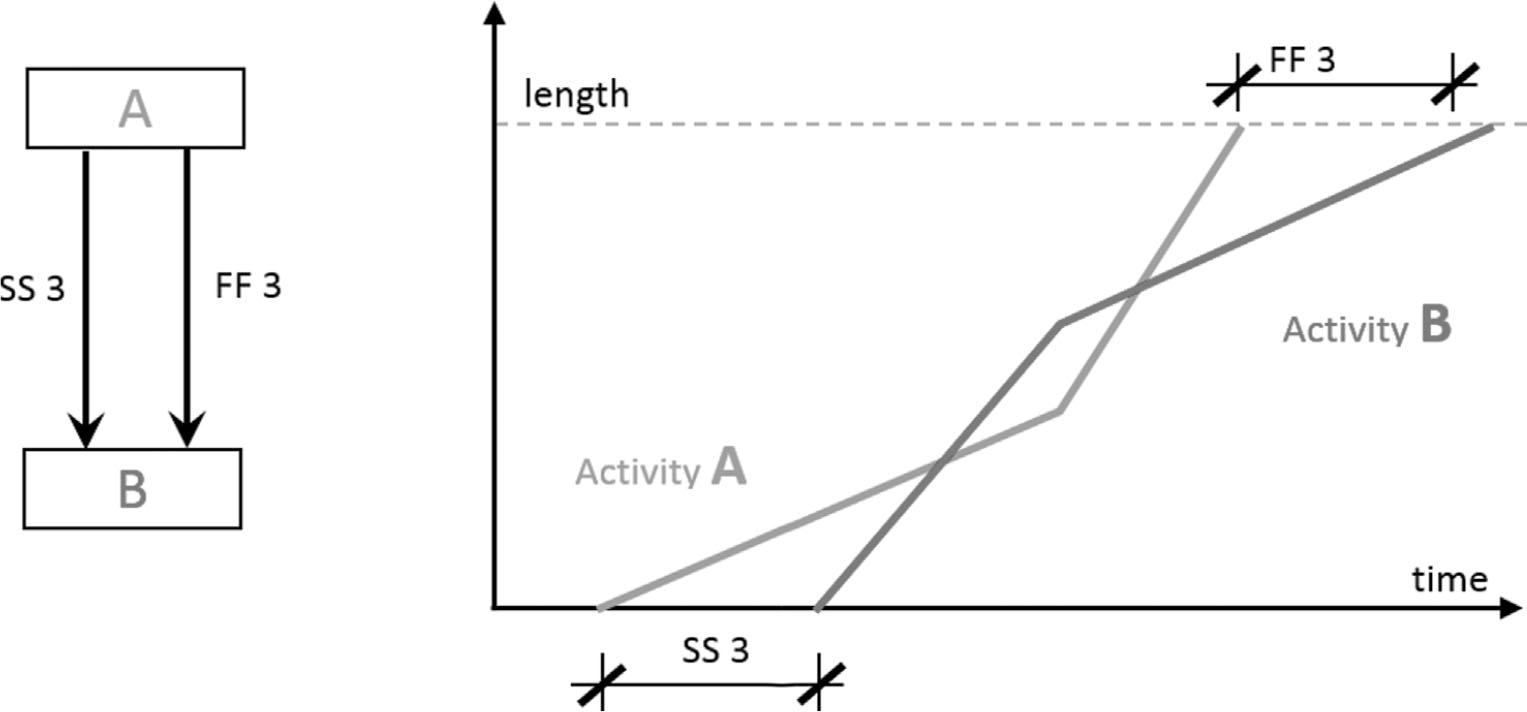
Fig. 11
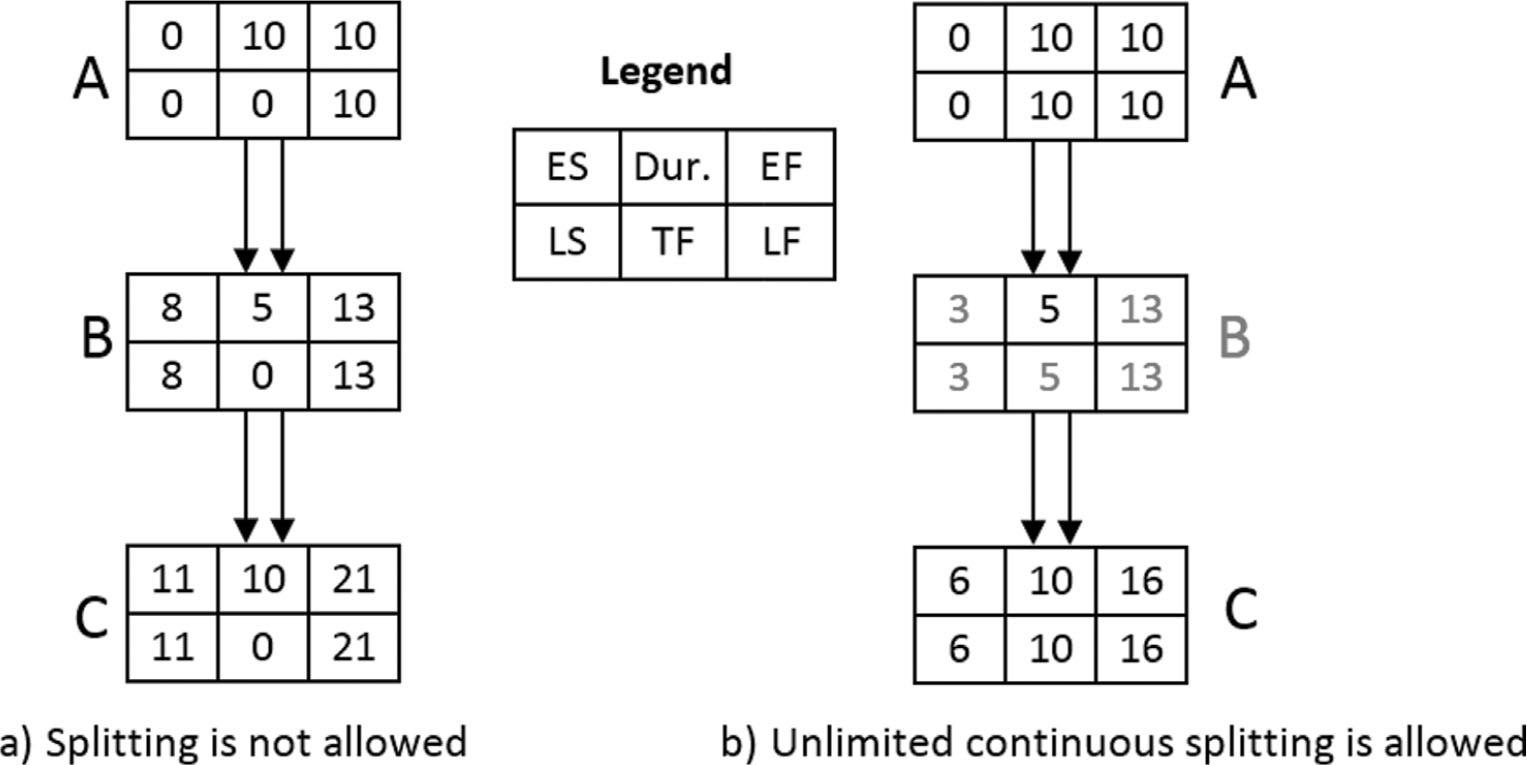
Fig. 12
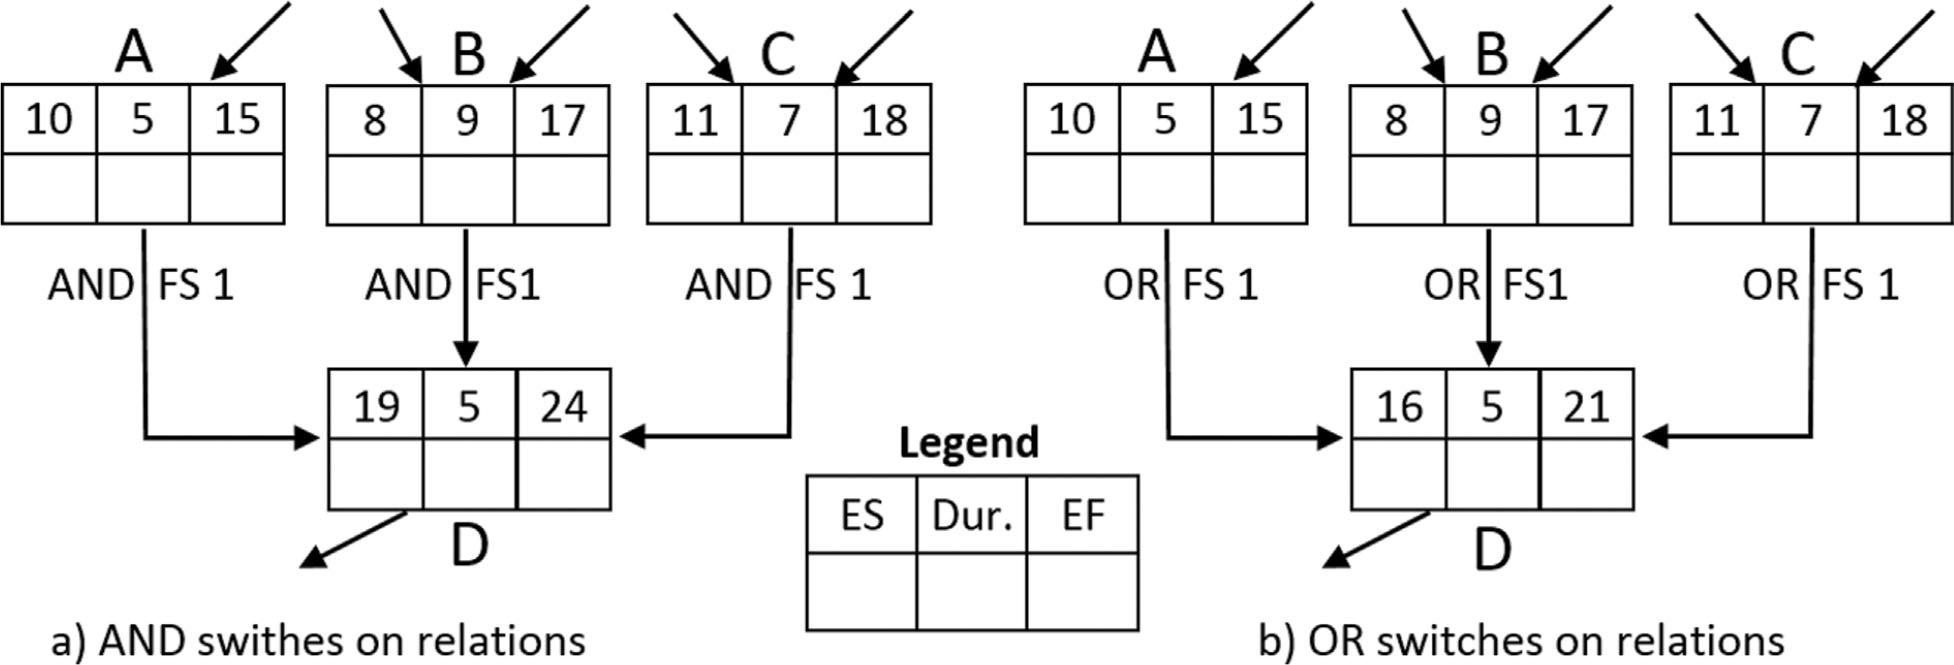
Fig. 13
Fig. 14
Fig. 15
Fig. 16

© 2017 M. Hajdu, S. Isaac, published by University of Zagreb
This work is licensed under the Creative Commons Attribution-NonCommercial-NoDerivatives 4.0 License.