
Zooplankton communities are an important component of the pelagic food web, but they are absent on the list of biotic elements to be considered in the assessment of ecological status in Annex V of the Water Framework Directive (2000/60/EC) (Caroni & Irvine 2010). The Directive 2000/60/EC requires the quality of waters to be determined on the basis of biological aspects, with other parameters complementing and supporting such an assessment. The communities of organisms that may be used for this purpose include phytoplankton, macrophytes, phytobenthos, benthos and fish, and these should be supported by a set of chemical and hydromorphological quality data (Annex V, 2000/60/EC) (Jeppesen et al. 2011). The Water Framework Directive does not specify zooplankton as an indicator applicable to water quality assessment, an omission that has attracted trenchant criticism (Moss 2008; Nõges et al. 2009; Jeppesen et al. 2011).
Zooplankton, as an intermediate trophic level in the pelagic food chain of lakes, is important in the assessment of their trophic status. These microscopic organisms are characterized by short life cycles and a relatively high metabolic rate, and such organisms, particularly rotifers and crustaceans, react quickly to changes in environmental conditions (Shurin et al. 2010). Hence, the species composition of rotifers and crustaceans as well as their abundance may be used as biological indicators that reflect changes in water quality. Parameters of the Rotifera community not only indicate the level of water pollution, but also serve to determine general tendencies in the changes of environmental conditions over time (Duggan et al. 2001; Ejsmont-Karabin 2012).
The value of zooplankton as an indicator of ecological conditions results from their position in the food web, between the top-down regulators (fish) and bottom-up factors (phytoplankton). They can thus provide information about the relative importance of the top-down and bottom-up control and their impact on water clarity (Jeppesen et al. 2011).
Danish authors have suggested that zooplankton can be used as an indicator of changes in trophic dynamics and the ecological state of lakes related to changes in nutrient loading and climate (Jeppesen et al. 2000; 2005; 2009; Søndergaard et al. 2005). According to Xu et al. (2001), a set of ecological indicators including structural, functional, and system-level aspects was proposed for the lake ecosystem health assessment, in accordance with the structural, functional, and system-level responses of lake ecosystems to chemical stresses. These indicators include acidification, eutrophication, as well as copper, oil and pesticide contamination. In many countries, zooplankton has been studied as part of lake monitoring (Mäemets 1983; Berzins & Pejler 1989; Matveeva 1991; Karabin 1985; Andronikova 1996; Ejsmont-Karabin 2012; Ejsmont-Karabin, Karabin 2013; Haberman & Haldna 2014), and as part of long-term monitoring of dam reservoirs (Fleituch & Pociecha 2000; Pociecha 2016). In dam reservoirs, zooplankton is rarely examined to determine the trophic indices of these water bodies. However, these artificial reservoirs may be considered lake areas, as there are characterized by environmental conditions similar to those found in natural lakes. For this reason, the zooplankton species composition of dam reservoirs could be used to assess the trophic status.
The objective of this paper was to analyze the usefulness of zooplankton indices based on two groups of zooplankton taxa, Rotifera and Crustacea, and to determine the trophic status of 10 different types of dam reservoir ecosystems, using formulas provided by Ejsmont-Karabin (2013).
In this paper, we demonstrate that zooplankton could be a useful indicator of the structure and function of dam reservoir ecosystems and their ecological status.
Zooplankton samples were collected in 10 dam reservoirs located in five physico-geographic regions of Poland (according to Kondracki 2002) (Fig. 1). All reservoirs differed from each other in the following characteristics: depth, area, catchment and function (Table 1). In order to compare the dam reservoirs in terms of physicochemical parameters, four groups of reservoirs were distinguished: a) reservoirs with a high concentration of PO4 3− in the water (regions: I, II and III); b) reservoirs with high concentrations of Cl−in the water (regions: I, III and IV); c) reservoirs with a high concentration of NO3 − (regions: IV and V); d) reservoirs with a high visibility of the Secchi disc and low conductivity (region V) (Table 2).
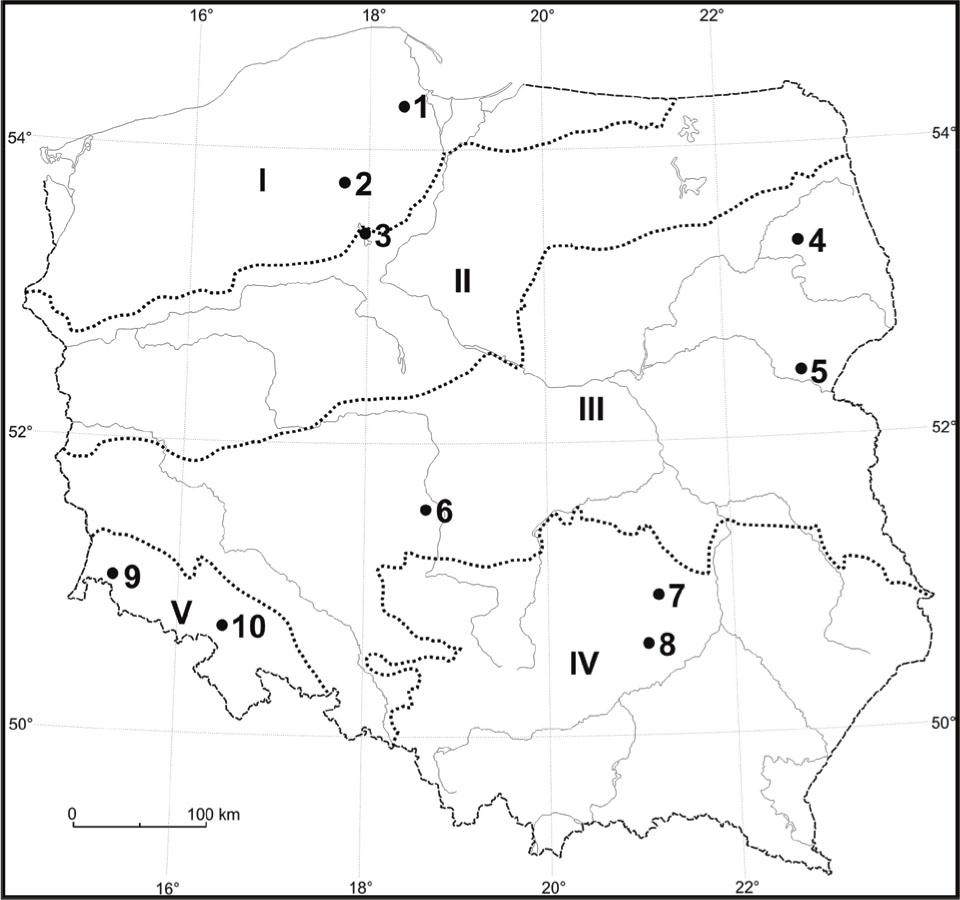
Location of the zooplankton sampling sites in Poland.
Geographical regions: I - Southern Baltic Sea Coasts, Eastern Baltic Sea Coasts and Pomeranian Lakelands; II - Southern Baltic Lakelands and Eastern Baltic Lakelands; III - Central Poland Lowlands, Wysoczyzny Podlasko-Białoruskie high plains and Polesie Region; IV - Silesian-Kraków Upland, Małopolska Upland, Lublin-Lviv Upland and Carpathian Mts.; V - Sudety Mts. and Sudety Foreland; Dam reservoirs: 1 – Łapińskie Nowe Lake, 2 – Mylof Dam Reservoir, 3 – Koronowskie Lake, 4 – Zygmunt August Lake, 5 – Siemiatyckie Zalewy Reservoir, 6 – Próba Dam Reservoir, 7 – Wióry Dam Reservoir, 8 – Chańcza Dam Reservoir, 9 – Leśniańskie Lake (Leśniański Dam Reservoir), 10 – Lubachowski Dam Reservoir (Bystrzyckie Lake)
Characteristics of the studied dam reservoirs in Poland (nd – no data)
| Name of dam reservoir | Łapinskie Nowe Lake | Mylof Dam Reservoir | Koronowskie Lake | Zygmunt August Lake | Siemiatyckie Zalewy Reservoir | Próba Dam Reservoir | Wióry Dam Reservoir | Chańcza Dam Reservoir | Leśniańskie Lake | Lubachowski Dam Reservoir |
|---|---|---|---|---|---|---|---|---|---|---|
| Location | Kolbudy | Zapora | Koronowo | Czechowizna | Siemiatycze | Próba | Pawłów, Knurów | Chańcza | Leśna | Lubachów |
| Coordinates | 54°17′25″N 18°26′47″E | 53°47′38″N 17°40′32″E | 53°32′34″N 17°58′01″E | 53°27′36″N 22°53′39″E | 52°26′12″N 22°52′10″E | 51°30′41″N 18°39′24″E | 50°56′48″N 21°10′12″E | 50°38′40″N 21°03′18″E | 51°01′52″N 15°18′10″E | 50°45′02″N 16°25′34″E |
| Year of creation | 1925 | 1848 | 1960 | 1559 | 70’s XX age | 2001 | 1980 | 1984 | 1905 | 1917 |
| River | Radunia | Brda | Brda | Nereśl | Kamionka | Żeglina | Świślina | Czarna Staszowska | Kwisa | Bystrzyca |
| Area | 0.35 km 2 | 10.5 km 2 | 13.5 km 2 | 4.85 km 2 | 0.33 km 2 | 0.21 km 2 | 4. 15 km 2 | 4.7 km 2 | 1.4 km 2 | 0.51 km 2 |
| Capacity | 2.5 M m3 | 16.2 M m3 | 80. 6 M m3 | no data | 0. 59 M m3 | no data | 35 M m3 | 20.59 M m3 | 15 M m3 | 8 M m3 |
| Max depth | 15.4 m | 12 m | 21.2 m | 3.5 m | 5.1 m | 4 m | 10 m | 11 m | 12 m | 36 m |
| Catchment | forest | forest | agroforestry | agriculture | agroforestry | forest | agriculture | forest | forest | forest |
| Function | retention, energy, fishing | retention, energy, fishing | retention, energy, fishing, recreation | fish farming | retention, fishing, recreation | retention, fishing, recreation | retention, energy, fishing, recreation | retention, energy, fishing, recreation | retention, energy, fishing, recreation | retention, energy, fishing, recreation |
| Retention time (in days) | nd | 12.5 | 38 | nd | nd | nd | nd | 218 | 37.8 | 54.8 |
Selected physicochemical parameters of water in the studied dam reservoirs (after Pociecha & Bielańska-Grajner 2015)
| Parameters | Reservoirs (according to order in Fig. 1) | ||||||||||
|---|---|---|---|---|---|---|---|---|---|---|---|
| 1 | 2 | 3 | 4 | 5 | 6 | 7 | 8 | 9 | 10 | ||
| SD | m | 1.4 | 3.4 | 2.7 | 0.3 | 1.2 | 0.8 | 1.3 | 1.0 | 1.6 | 2.3 |
| WT | °C | 12.6 | 14.8 | 14.6 | 19.2 | 19.2 | 21.3 | 21.7 | 22.4 | 16.7 | 16.1 |
| EC | μS cm−1 | 372 | 274 | 326 | 335 | 359 | 376 | 402 | 254 | 135 | 246 |
| pH | 7.7 | 7.6 | 7.5 | 7.6 | 8.1 | 8.5 | 8.0 | 7.7 | 5.6 | 7.8 | |
| DO | mg l−1 | 11.2 | 8.5 | 5.9 | 3.1 | 14.8 | 13.1 | 8.8 | 14.1 | 8.2 | 6.6 |
| No3 − | 3.1 | 0.5 | 0.5 | 0.08 | 0.04 | 0.03 | 0.21 | 0.1 | 2.05 | 2.4 | |
| po4 3− | 0.4 | 0.3 | 0.5 | 0.01 | 0.03 | 0.01 | 0.02 | 0.02 | 0.07 | 0.25 | |
| NH4 + | 0.04 | 0.1 | 0.2 | 0.03 | 0.1 | 0.02 | 0.28 | 0.1 | 0.1 | 0.06 | |
| Cl- | 17.3 | 10.2 | 12.7 | 11.9 | 12.8 | 31.2 | 26.7 | 12.4 | 8.1 | 17.6 | |
| Mg2+ | 8.0 | 4.9 | 6.8 | 11.75 | 10.2 | 10.2 | 16.8 | 6.9 | 2.65 | 11.1 | |
| Ca2+ | 62.05 | 48.9 | 56.75 | 55.7 | 58.1 | 53.0 | 45.7 | 43.6 | 12.9 | 28.3 | |
water temperature (WT), Secchi disk visibility (SD), oxygen concentration (DO), conductivity (EC)
Samples were collected from the central part of the reservoirs in August or September 2012. They were filtered through a plankton net (mesh size of 30 μm). In order to obtain one sample of zooplankton, 10 l of water was filtered, using a 5 l sampler.
All zooplankton samples were examined under a microscope in 0.5 ml chambers, both live and after treatment with 4% fixative solution of formaldehyde. The identification of zooplankton was performed with the use of a light microscope (Nikon H550L) at 40–400× magnification with a Nikon camera and NIS Elements computer software for image analysis. The taxonomical identification of zooplankton was made according to the identification keys (Flössner 2000; Ejsmont-Karabin et al. 2004; Rybak & Błędzki 2010).
Samples from dam reservoirs should be collected in the lake zone/area, and if such a zone cannot be determined, they should be collected from the deepest part of a reservoir, during summer stagnation when the water level does not fluctuate, based on one-time sampling. The thus defined constraints of sampling ensure that the conditions in dams are most similar to those prevailing in lakes.
In order to determine the trophic state of dam reservoirs, indices were calculated on the basis of species density and structure of Rotifera and Crustacea (Table 3). The advantage of the method proposed by Ejsmont-Karabin (2013) is that a single sample is sufficient during summer stagnation. These indices were based on research conducted in lakes.
Numerical trophic state indices for dam reservoirs, irrespective of their trophic type (TSIRot) and (TSICR); the indices use species composition and density of Rotifera and Crustacea (according to Ejsmont-Karabin 2013)
| No. | Indices | Regression coefficient | Formulas |
|---|---|---|---|
| 1 | Number of rotifers (N, ind. l−1) | R2 = 0.60 | WSTRot1 = 5.38ln(N) + 19.28 |
| 2 | Total biomass (B, mg w.w. l−1) | R2 =0.47 | WSTRot2 = 5.63ln(B) + 64.47 |
| 3 | Percentage of bacterivores in the total number (BAC, %) | R2 = 0.34 | WSTRot3= 0.23BAC + 44.30 |
| 4 | Percentage of tecta in the population of Keratella cochlearis (TECTA, %) | R2 = 0.54 | WSTRot4 =0.187TECT + 50.38 |
| 5 | Ratio of biomass to the number (B:N, mg w.w. l−1: ind. l−1) | R2= 0.50 | WSTROt5 = 3.85 (B:N)-0.318 |
| 6 | Percentage of species indicative of high trophy in the indicative group (IHT, %) | R2= 0.67 | WSTRot6 = 0.203 IHT + 40.0 |
| 7 | Number of Crustacea (N, ind. l−1) | R2= 0.32 | WSTCR1 = 25.5N 0.142 |
| 8 | Biomass of Cyclopoida (B, mg w.w. l−1) | R2= 0.35 | WSTCR2 = 57.6B 0.081 |
| 9 | Percentage of cyclopoid biomass in total biomass of Crustacea (CB,%) | R2= 0.30 | WSTCR3 = 40.9CB 0.097 |
| 10 | Ratio of cyclopoid biomass to Cladocera biomass (CY/CL) | R2= 0.37 | WSTCR4= 58.3(CY/CL) 0.071 |
| 11 | Percentage of species indicative of high trophy in the indicative group (IHT,%) | R2= 0.30 | WSTCR5 = 43.8e0.004(IHT) |
The trophic state of dam reservoirs was calculated on the basis of the density and species structure of Rotifera and Crustacea communities as proposed by Ejsmont-Karabin 2013 (Table 4).
The trophic state of dam reservoirs corresponding to the value of indices calculated on the basis of density and species structure of Rotifera and Crustacea (after Ejsmont-Karabin 2013)
| Zooplankton value of trophic state indices | Trophic state |
|---|---|
| Below 35 | Oligotrophic |
| From 35 to 45 | Mesotrophic |
| From 45 to 50 | Low meso-eutrophic |
| From 50 to 55 | High meso-eutrophic |
| From 55 to 60 | Low eutrophic |
| From 60 to 65 | High eutrophic |
| Above 65 | Polytrophic |
Formulas for the trophic state indices based on the structure and density of the zooplankton community were developed using regression equations according to trophic state indices described by Carlson (1977) and the results collected in 74 poly- and dimictic lakes (Ejsmont-Karabin 2012; Ejsmont-Karabin & Karabin 2013).
The zooplankton in the studied dam reservoirs showed significant differences, both in the qualitative and quantitative composition as well as in the density of particular groups of zooplankton. The largest number of zooplankton taxa was found in Lake Koronowskie and the lowest number in Lubachowski Dam Reservoir (Fig. 2). A small number of zooplankton taxa was also observed in Zygmunt August Lake, whose characteristics resemble a breeding pond rather than a typical dam reservoir.
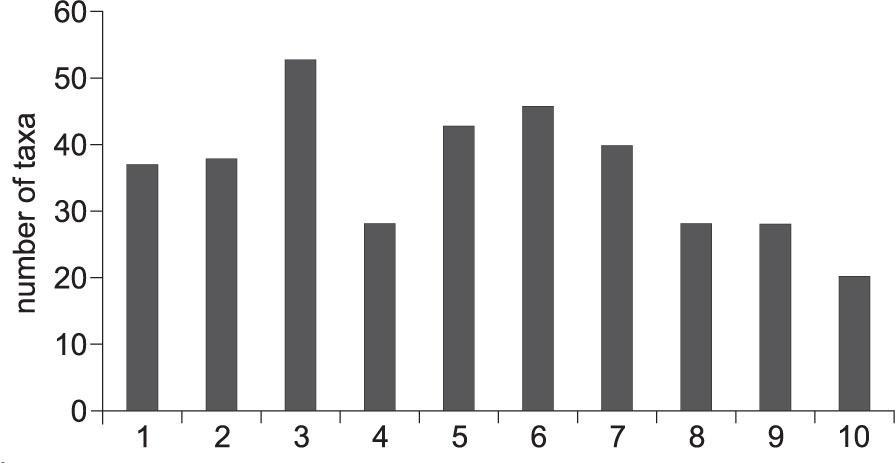
The number of zooplankton taxa in the studied dam reservoirs in 2012. 1 – Łapińskie Nowe Lake, 2 – Mylof Dam Reservoir, 3 – Koronowskie Lake, 4 – Zygmunt August Lake, 5 – Siemiatyckie Zalewy Reservoir, 6 – Próba Dam Reservoir, 7 – Wióry Dam Reservoir, 8 – Chańcza Dam Reservoir, 9 – Leśniańskie Lake, 10 – Lubachowski Dam Reservoir
The highest densities of rotifers and crustaceans were observed in Zygmunt August Lake and Próba Dam Reservoir (Fig. 3). The lowest densities of both zooplankton communities were observed in Łapińskie Nowe Lake and Mylof Dam Reservoir (Fig. 3). A very low density of rotifers was also found in two submontane dam reservoirs: Lake Leśniański and Lubachowski Dam Reservoir.
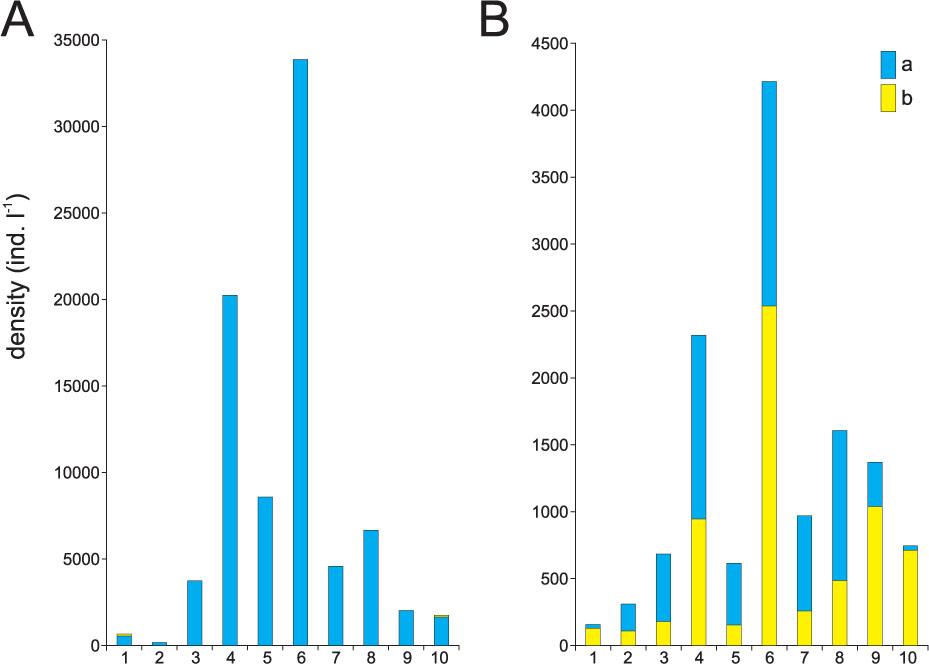
Rotifera (A) and Crustacea (B) (a – Copepoda; b – Cladocera) density (ind. l−1) in the studied dam reservoirs in 2012. 1 – Łapińskie Nowe Lake, 2 – Mylof Dam Reservoir, 3 – Koronowskie Lake, 4 – Zygmunt August Lake, 5 – Siemiatyckie Zalewy Reservoir, 6 – Próba Dam Reservoir, 7 – Wióry Dam Reservoir, 8 – Chańcza Dam Reservoir, 9 – Leśniańskie Lake, 10 – Lubachowski Dam Reservoir
In the most eutrophic dam reservoirs, the dominant species in the zooplankton community were Keratella cochlearis f. tecta, Pompholyx sulcata, Trichocerca pusilla, Bosmina longirostris, Chydorus sphaericus, species considered to be indicators of a high trophic state. In these reservoirs, the density of rotifers ranged from 6641 to 33 811 ind. l−1 and the density of crustaceans ranged from 950 to 4195 ind. l−1 (Fig. 3).
The dominant zooplankton species were represented by 13 rotifers, 11 cladocerans and 3 copepods. Most species were characteristic of meso- to eutrophic waters. Species characteristic of eutrophic waters, such as K. cochlearis f. tecta, P. sulcata, T. pusilla (rotifers) and B. longirostris, Ch. sphaericus and Diaphanosoma brachyurum, were found in the reservoirs in densities ranging from 40 to 78 ind. l−1 (Table 5).
Dominant species of zooplankton (%) in the studied dam reservoirs in 2012
| Dominant species | Reservoirs (according to the order in Fig. 1) | |||||||||
|---|---|---|---|---|---|---|---|---|---|---|
| 1 | 2 | 3 | 4 | 5 | 6 | 7 | 8 | 9 | 10 | |
| Rotfera | ||||||||||
| Conochilus unicornis | 17 | |||||||||
| Keratella cochlearis | 30 | 12 | 43 | 27 | 41 | 38 | 57 | |||
| Keratella tecta | 14 | 45 | 33 | 24 | 28 | |||||
| Keratella quadrata | 10 | |||||||||
| Lecane closterocerca | 15 | |||||||||
| Polyartdra dolichoptera | 17 | |||||||||
| Polyartdra longiremis | 16 | |||||||||
| Polyartdra major | 22 | |||||||||
| Polyartdra vulgaris | 16 | |||||||||
| Pompholyx sulcata | 40 | |||||||||
| Synchaeta oblonga | 13 | |||||||||
| Trichocerca pusilla | 50 | |||||||||
| Trichocerca similis | 10 | 16 | ||||||||
| Cladocera | ||||||||||
| Bosmina longirostris | 15 | 61 | 76 | 18 | 53 | 73 | ||||
| Ceriodaphnia quadralunga | 16 | 13 | 10 | |||||||
| Chydorus sphaericus | 15 | 30 | 25 | 12 | ||||||
| Daphnia ambigua | 13 | |||||||||
| Daphnia cucullata | 26 | 15 | 19 | 10 | 36 | |||||
| Daphnia galeata | 25 | 18 | ||||||||
| Diaphanosoma brachyurum | 46 | 19 | ||||||||
| Eubosmina coregoni | 50 | 11 | ||||||||
| Eubosmina crassicornis | 38 | |||||||||
| Eubosmina gibbera | 15 | |||||||||
| Eubosmina tdersities | ||||||||||
| Copepoda | ||||||||||
| Eudiaptomus gracilis | 13 | |||||||||
| Tdermocyclops crassus | 10 | |||||||||
| Tdermocyclops oitdnoides | 17 | |||||||||
The indices calculated for the dam reservoirs based on Rotifera and Crustacea communities were very similar. In the case of the Rotifera community, the percentage of the tecta form in the K. cochlearis population and the proportion of high-trophic species in the total species density were the best indices to describe the water trophic status. In the case of the Crustacea community, the best indices to describe the trophic state of water were the Crustacea density and the Cyclopoida biomass. The highest value of all indices calculated on the basis of density and species structure of Rotifera – above 59 – was determined for Zygmunt August Lake, but the highest value of all indices calculated on the basis of density and species structure of Crustacea – above 61 – was determined for Zygmunt August Lake and Próba Dam Reservoir (Tables 6 and 7).
Indices calculated on the basis of density and species structure of Rotifera in the studied dam reservoirs: A – value after conversion, B – value of the indices
| Indices | Reservoirs (according to order in Fig.1) | |||||||||||||||||||
|---|---|---|---|---|---|---|---|---|---|---|---|---|---|---|---|---|---|---|---|---|
| 1 | 2 | 3 | 4 | 5 | 6 | 7 | 8 | 9 | 10 | |||||||||||
| A | B | A | B | A | B | A | B | A | B | A | B | A | B | A | B | A | B | A | B | |
| Number of rotifers (N, ind. l−1) | 152 | 46 | 39 | 39 | 180 | 47 | 3313 | 63 | 1455 | 58 | 13436 | 70 | 2453 | 61 | 2641 | 62 | 1069 | 57 | 818 | 55 |
| Total biomass (B, mg w.w. l−1) | 0.14 | 53 | 0.02 | 42 | 0.06 | 49 | 0.63 | 62 | 1.21 | 65 | 3 | 64 | 1 | 64 | 1.2 | 65 | 0.2 | 55 | 0.1 | 53 |
| Percentage of bacterivores in total number (BAC, %) | 13 | 47 | 26 | 50 | 54 | 57 | 78 | 62 | 0.5 | 44 | 7 | 46 | 41 | 54 | 34 | 52 | 56 | 57 | 90 | 65 |
| Percentage of tecta in the population of Keratella cochlearis (TECTA, %) | 45 | 59 | 12 | 53 | 5 | 51 | 97 | 68 | 4 | 50 | 77 | 65 | 38 | 57 | 86 | 66 | 90 | 67 | 65 | 62 |
| Ratio of biomass to the number (B:N, mg w.w. ind.−1) | 0.0009 | 36 | 0.0005 | 43 | 0.0003 | 49 | 0.0002 | 59 | 0.0008 | 37 | 0.0002 | 53 | 0.0004 | 46 | 0.0004 | 44 | 0.0002 | 58 | 0.0002 | 62 |
| Percentage of species indicative of high trophy in the indicative group (IHT, %) | 100 | 60 | 100 | 60 | 57 | 51 | 100 | 60 | 93 | 59 | 100 | 60 | 65 | 53 | 57 | 52 | 96 | 59 | 96 | 59 |
Indices calculated on the basis of density and species structure of Crustacea in the studied dam reservoirs: A – value after conversion, B – value of the indices
| Indices | Reservoirs (according to order in Fig.1) | |||||||||||||||||||
|---|---|---|---|---|---|---|---|---|---|---|---|---|---|---|---|---|---|---|---|---|
| 1 | 2 | 3 | 4 | 5 | 6 | 7 | 8 | 9 | 10 | |||||||||||
| A | B | A | B | A | B | A | B | A | B | A | B | A | B | A | B | A | B | A | B | |
| Number of Crustacea (N, ind. l−1) | 12 | 36 | 26 | 40 | 154 | 52 | 1402 | 71 | 197 | 54 | 626 | 64 | 557 | 62 | 207 | 54 | 1082 | 69 | 135 | 51 |
| Biomass of Cyclopoida (B, mg w.w. l−1) | 0.03 | 44 | 0.04 | 45 | 1.7 | 60 | 7.5 | 68 | 1.5 | 60 | 4.3 | 65 | 2.7 | 62 | 3.5 | 64 | 7.2 | 67 | 1 | 57 |
| Percentage of cyclopoid biomass in total biomass of Crustacea (CB,%) | 35 | 58 | 15 | 53 | 36 | 58 | 65 | 61 | 19 | 54 | 66 | 61 | 33 | 57 | 25 | 56 | 76 | 62 | 12 | 52 |
| Ratio of cyclopoid biomass to Cladocera biomass (CY/CL) | 0.54 | 56 | 0.33 | 54 | 0.75 | 57 | 1.9 | 61 | 0.24 | 51 | 2 | 61 | 1.2 | 59 | 0,37 | 54 | 0.8 | 57 | 0.6 | 56 |
| Percentage of species indicative of high trophy in the indicative group (IHT,%) | 50 | 53 | 80 | 60 | 58 | 55 | 97 | 64 | 55 | 54 | 90 | 63 | 41 | 52 | 14 | 46 | 18 | 47 | 79 | 60 |
In the case of one reservoir, Zygmunt August Lake, the index of the trophic state calculated for the Rotifera and Crusacea communities was the same and ranged from highly eutrophic to polytrophic. In the case of other reservoirs, the value of indices indicated mesotrophic to polytrophic state (Table 8).
Trophic state of the studied dam reservoirs corresponding to the value of indices calculated on the basis of density and species structure of Rotifera and Crustacea.
| Reservoirs | Rotifera indices of trophic state | Crustacea indices of trophic state |
|---|---|---|
| Łapińskie Nowe Lake | low eutrophic | low meso-eutrophic |
| Mylof Dam Reservoir | high meso-eutrophic | low meso-eutrophic |
| Koronowskie Lake | high meso-eutrophic | high meso-eutrophic to low eutrophic |
| Zygmunt August Lake | high eutrophic to polytrophic | high eutrophic to polytrophic |
| Siemiatyckie Zalewy Reservoir | mesotrophic to high eutrophic | high meso-eutrophic to low eutrophic |
| Próba Dam Reservoir | high eutrophic to polytrophic | high eutrophic |
| Wióry Dam Reservoir | high eutrophic | low to high eutrophic |
| Chańcza Dam Reservoir | high eutrophic to polytrophic | high meso-eutrophic to high eutrophic |
| Leśniańskie Lake | low to high eutrophic | low eutrophic to polytrophic |
| Lubachowski Dam Reservoir | low to high eutrophic | low eutrophic |
The zooplankton community in freshwater ecosystems contains species identified as aquatic bioindicators. These organisms are very good indicators, because they quickly respond to environmental stress, such as pollution/nutrient enrichment, habitat loss or overexploitation (Adams 2002; Birk et al. 2012). The ecological status of water bodies is defined as the expression of the quality of the structure and functioning of aquatic ecosystems based on biological quality elements (BQEs) (CIS 2003; Jeppesen et al. 2011). When implementing the EU Water Framework Directive (WFD), the Member States must classify the ecological status of surface waters following the standardized procedures (Jeppesen et al. 2011), but zooplankton is not considered useful in this assessment.
Zooplankton is mentioned in the WFD CIS Monitoring Guidance (CIS 2003; Jeppesen et al. 2011) as a “supportive/interpretative parameter” of fish, “often/typically measured or sampled at the same time”. Nevertheless, in many countries, e.g. in Denmark, zooplankton is considered to be useful in studying the ecological state of lakes (Jeppesen et al. 2000; 2005; 2009; Søndergaard et al. 2005). Using mainly examples from Denmark, Estonia and Great Britain, Jeppesen et al. (2011) demonstrated that zooplankton is an important indicator of the ecological state of water, and they discuss straightforward indicators which, with further studies, could be useful indicators of the structure and function of lake ecosystems as well as of their ecological state.
The study of general indicators that would work well in the whole EU is very difficult due to the number of factors that influence the results, including climate, seasons and geographical location of lakes (Moss et al. 2003). Mäemets (1983) demonstrated a clear relationship between zooplankton, the type of lakes and trophic state.
The long-term research of submontane dam reservoirs has shown that the assessment of the trophic status based on the community composition, density and dry weight of zooplankton results in a change of the trophic state of water from eutrophic-mesoeutrophic to mesoeutrophic Pociecha 2016). Moreover, the geographical location of dam reservoirs, as well as reolimnic or limnic characteristics do not affect the determination of the trophic state based on the structure and density of the zooplankton community. In a dam reservoir with a relatively short retention time (below 20 days; Table 1 – Mylof Dam Reservoir and Łapińskie Nowe Lake; Rosnowski and Hajka reservoirs – Pociecha & Heese 2007), the density of zooplankton was low compared to other dam reservoirs studied.
Low density values in reolimnic reservoirs (Łapińskie Nowe Lake and Mylof Dam Reservoir) seem to have no effect on the calculations and results of Rotifera and Crustacea indices of the trophic state (Table 8).
As indicated above, zooplankton indices for Polish lakes studied by Ejsmont-Karabin (2012, 2013) and Ejsmont-Karabin & Karabin (2012) perform very well, not only in natural lakes but also in artificial reservoirs. It is relevant that the selected indices based on Rotifera and Crustacea had similar values in artificial reservoirs. The results of our study show that the indices based on the structure of Rotifera groupings are slightly more sensitive to an increase in trophic conditions compared to the indices based on the structure of Crustacea.
In dam reservoirs, the structure of the zooplankton community with species indicators is similar to that in the lakes (Karabin 1985; Matveeva 1991; Haberman & Haldna 2014). The results of the zooplankton indices used to assess the trophic state of the dam reservoirs confirm the usefulness of these indices for the assessment of the water trophic status of both submontane and lowland dam reservoirs. Our study illustrates that zooplankton is an important indicator of the structure and function of freshwater dam reservoir ecosystems and may reflect the ecological status of water bodies.