
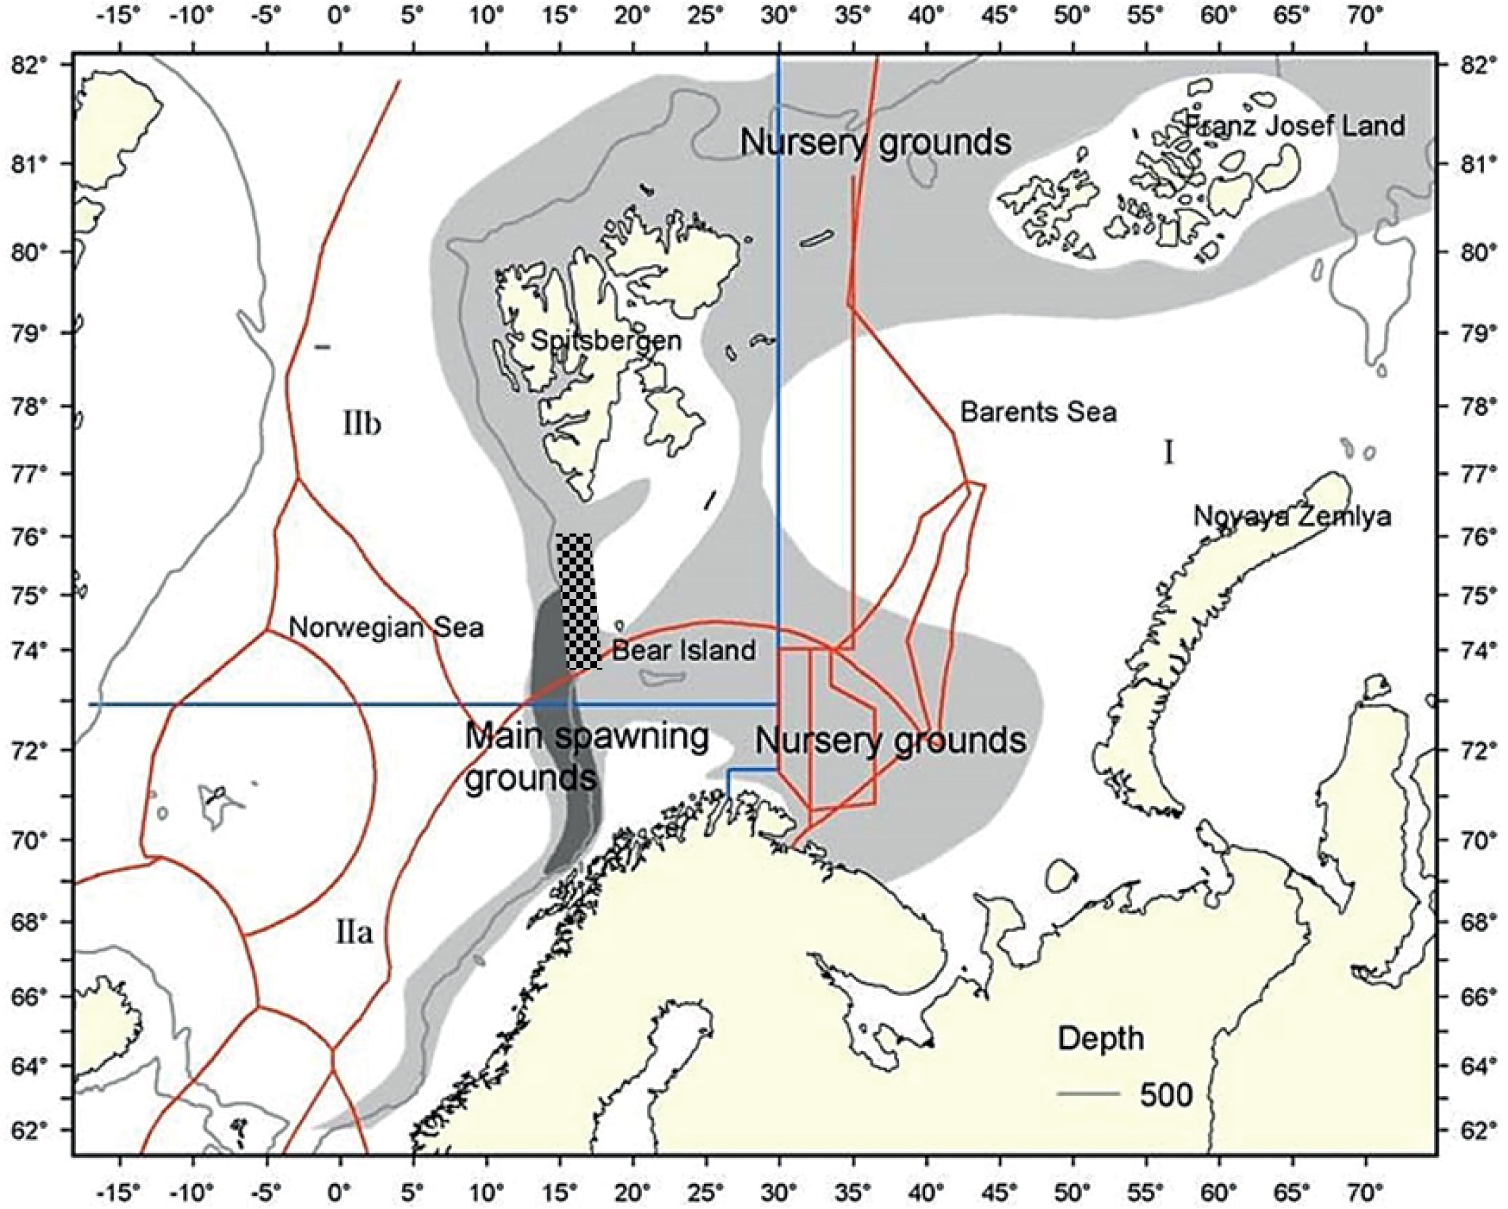
Figure 1
Map of the sampling area on the Barents Sea (checkerboard pattern). Fish were sampled along the shelf from Bear Island to South Svalbard. Greenland halibut nursery and main spawning grounds are marked. National economic zones, the disputed border areas between Norway and Russian (i.e. the Gray Zone), the international Loophole and the ICES areas are shown (Nedreaas & Smirnov, modified).
Table 1
Digestion patterns given as approximate lengths of the main DNA fragments (bp), which characterize three sibling species of C. osculatum s.l. The missing fragments are represented by short and not diagnostic fragments (total length).
| Contracaecum species | RsaI | XbaI |
|---|---|---|
| C. osculatum A | 390 + 260 | 960 |
| C. osculatum B | 390 + 260 | 730+230 |
| C. osculatum C | 390 + 260 + 240 | 960 |
Table 2
Abundance and prevalence of ascaridoids depending on the host and haul depth for R. hippoglossoides
| N | All species | A. simplex s.s. | C. osculatum | H. aduncum | P. bulbosa | |
|---|---|---|---|---|---|---|
| Abundance | ||||||
| All fish | 149 | 48.7 | 33.8 | 9.4 | 2.2 | 0.7 |
| R. hippoglossoides all | 110 | 52.0 | 36.1 | 11.2 | < 0.1 | 0.5 |
| “shallow” | 49 | 59.2 | 10.7 | < 0.1 | 0.3 | |
| “deep” | 61 | 16.2 | 11.8 | < 0.1 | 0.6 | |
| S. mentella | 19 | 10.2 | 9.0 | 0.2 | 1.0 | 0.0 |
| M. berglax | 7 | 5.2 | 9.0 | 0.3 | 0.3 | 0.1 |
| H. platessoides | 6 | 29.0 | 7.5 | 12.8 | 0.0 | 8.7 |
| G. morhua | 7 | 192.3 | 126.7 | 13.0 | 51.5 | 1.2 |
| Prevalence (%) | ||||||
| All fish | 149 | 91 | 80 | 82 | 12 | 15 |
| R. hippoglossoides all | 110 | 100 | 81 | 97 | 3 | 14 |
| “shallow” | 49 | 88 | 96 | 2 | 10 | |
| “deep” | 61 | 77 | 100 | 3 | 16 | |
| S. mentella | 19 | 95 | 74 | 11 | 42 | 0 |
| M. berglax | 7 | 86 | 71 | 14 | 14 | 14 |
| H. platessoides | 6 | 100 | 67 | 83 | 0 | 67 |
| G. morhua | 7 | 100 | 100 | 100 | 100 | 50 |
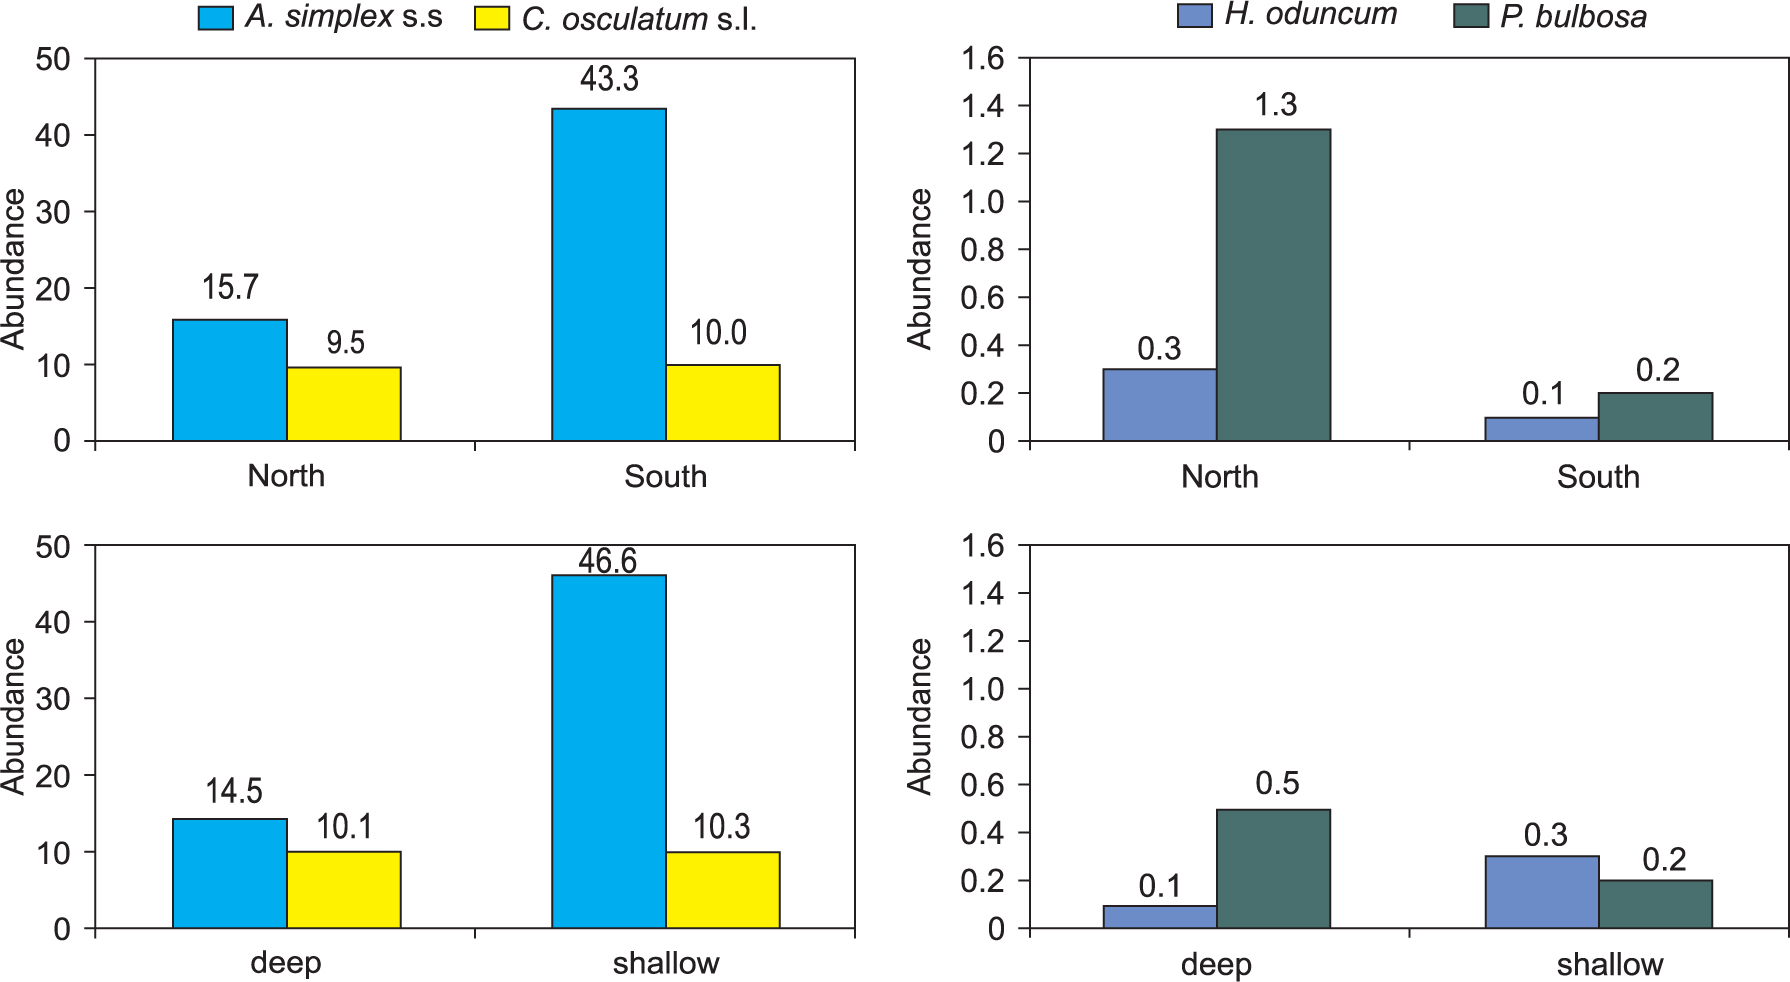
Figure 2
Abundance calculated for nematode species sampled from fish species identified in both the northern and southern groups (R. hippoglossoides, S. mentella and H. platessoides) and at both depths (R. hippoglossoides, S. mentella and M. berglax). Values for nematode species are shown on separate graphs due to the large difference between the abundance level of the two common species and two much less abundant species.
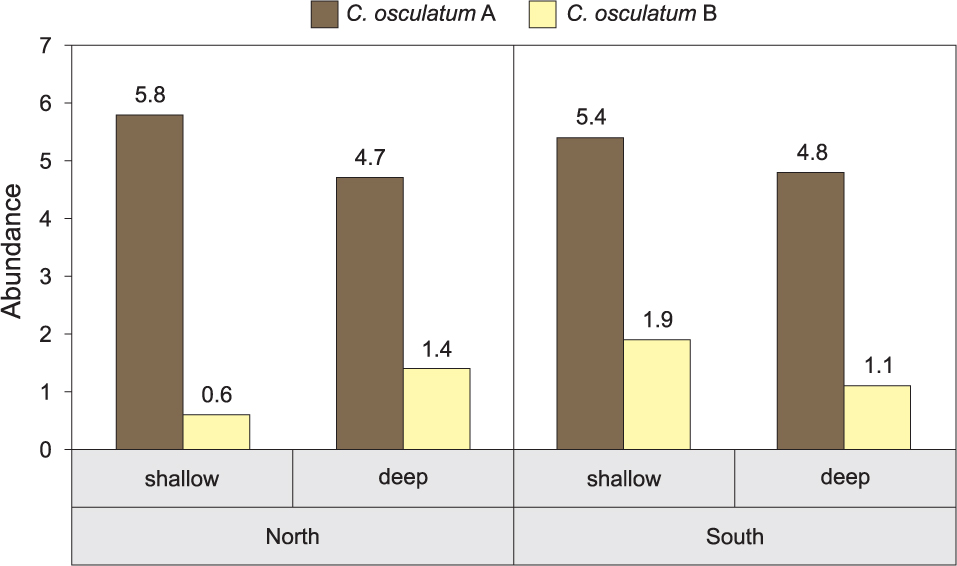
Figure 3
Abundance of C. osculatum A and B from Greenland halibut depending on the location and depth
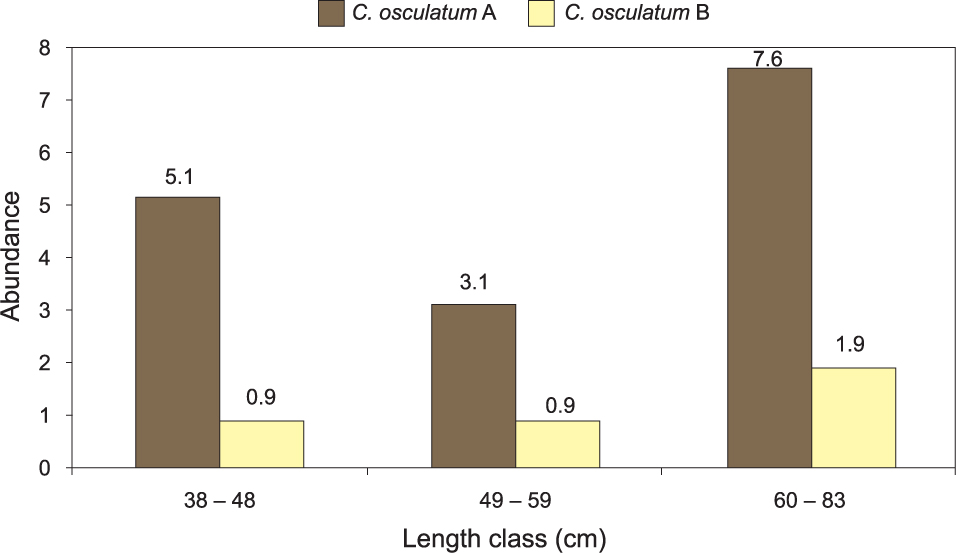
Figure 4
Abundance of C. osculatum A and B per length class of R. hippoglossoides
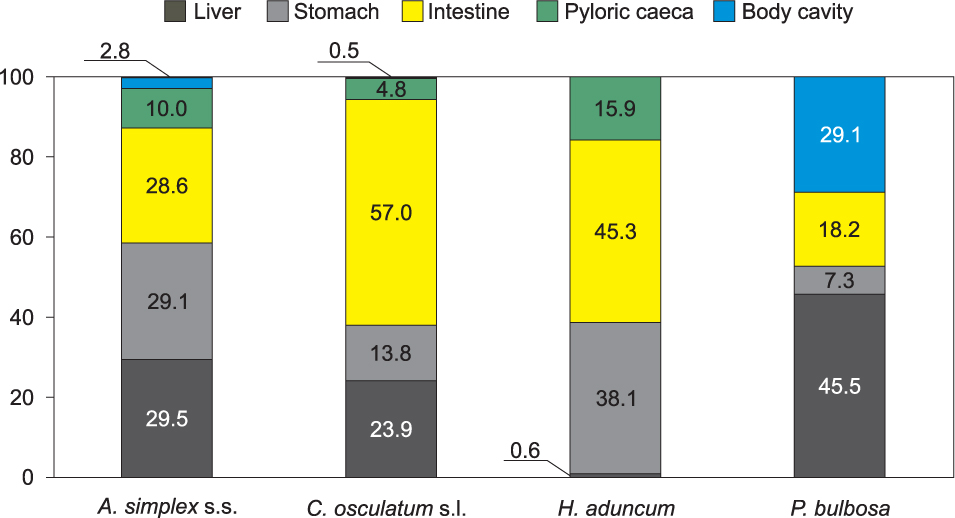
Figure 5
Percentage of nematode species across the main locations in their host organisms. Calculations were carried out for all host species.
Table 3
Percentage of each ascaridoid species in organs of Greenland halibut by catch depth. The number of fish is given in Table 2
| Nematode species | A. simplex s.s. | C. osculatum s.l. | H. aduncum | P. bulbosa | |
|---|---|---|---|---|---|
| Liver | “deep” | 41.6 | 26.0 | 33.3 | 60.0 |
| “shallow” | 29.7 | 27.0 | 0 | 86.7 | |
| Stomach | “deep” | 33.7 | 17.5 | 66.7 | 20.0 |
| “shallow” | 32.5 | 11.2 | 100.0 | 0 | |
| Intestine | “deep” | 23.7 | 56.4 | 0 | 20.0 |
| “shallow” | 33.9 | 61.3 | 0 | 13.3 | |
| Body cavity | “deep” | 1.1 | 0 | 0 | 0 |
| “shallow” | 3.9 | 0.4 | 0 | 0 | |