
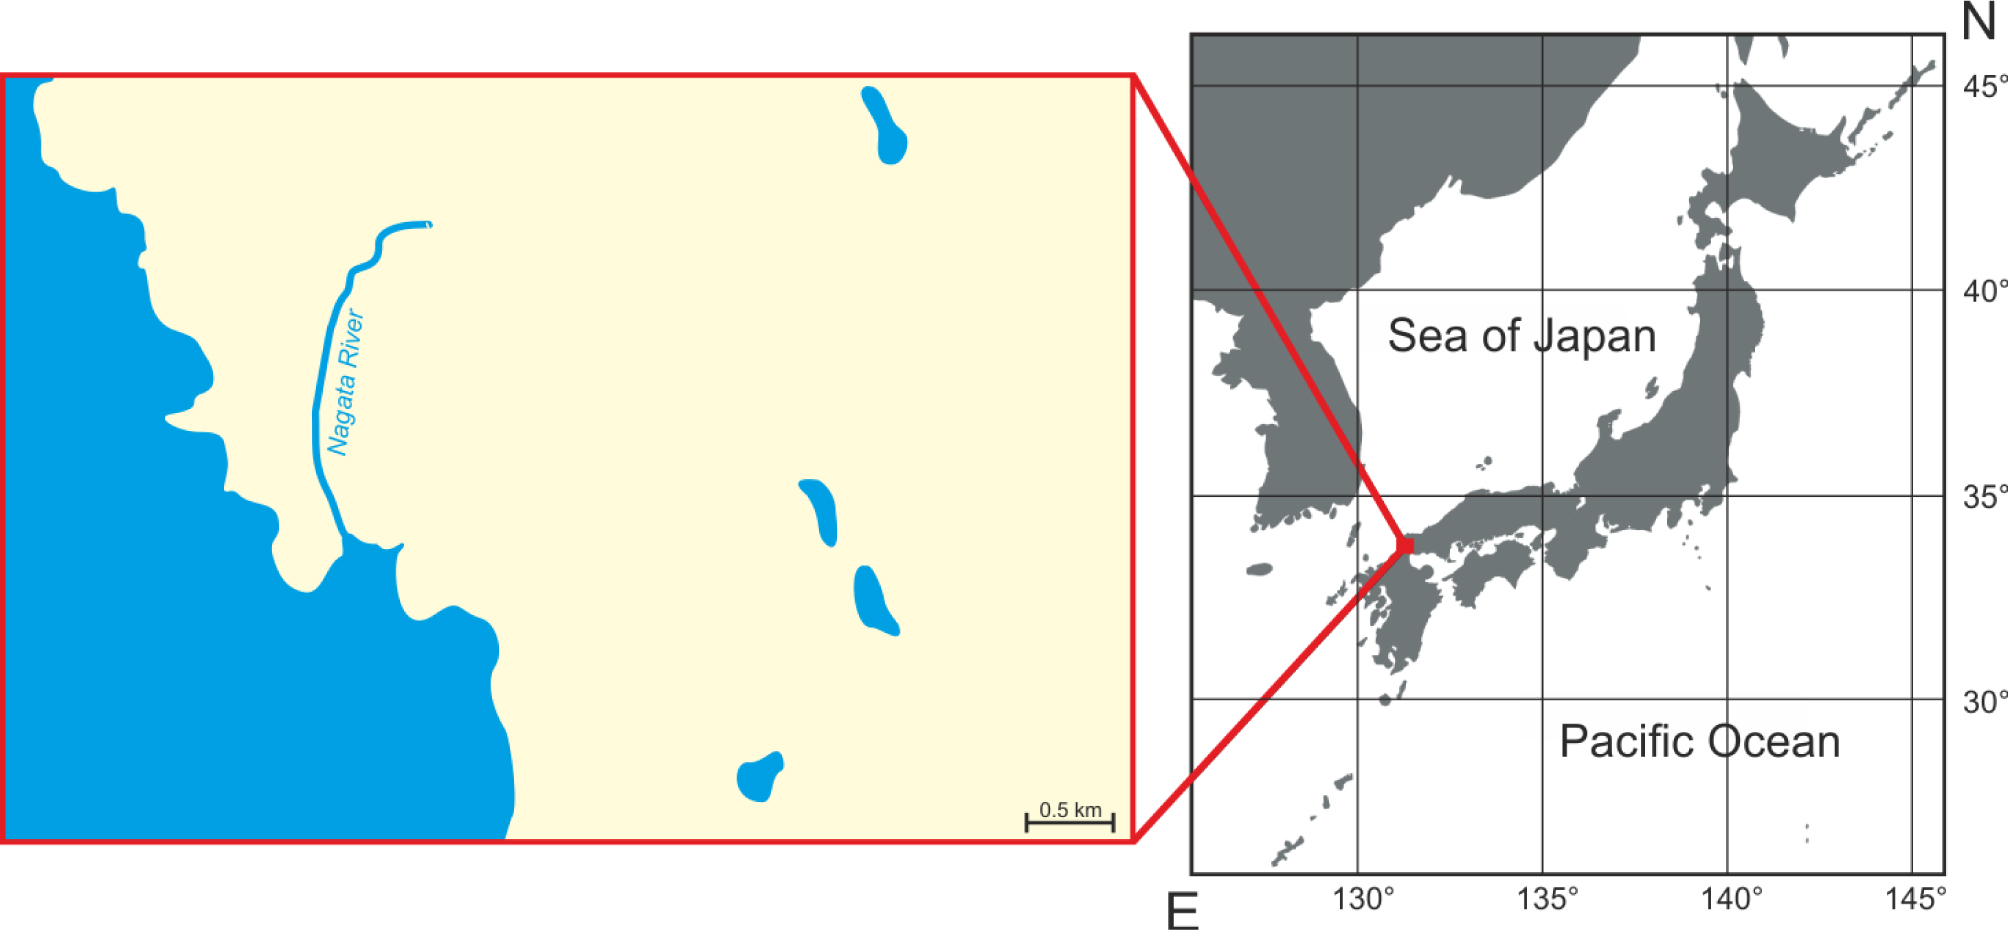
Figure 1
Map showing the location of the Nagata River, Shimonoseki, Yamaguchi Prefecture
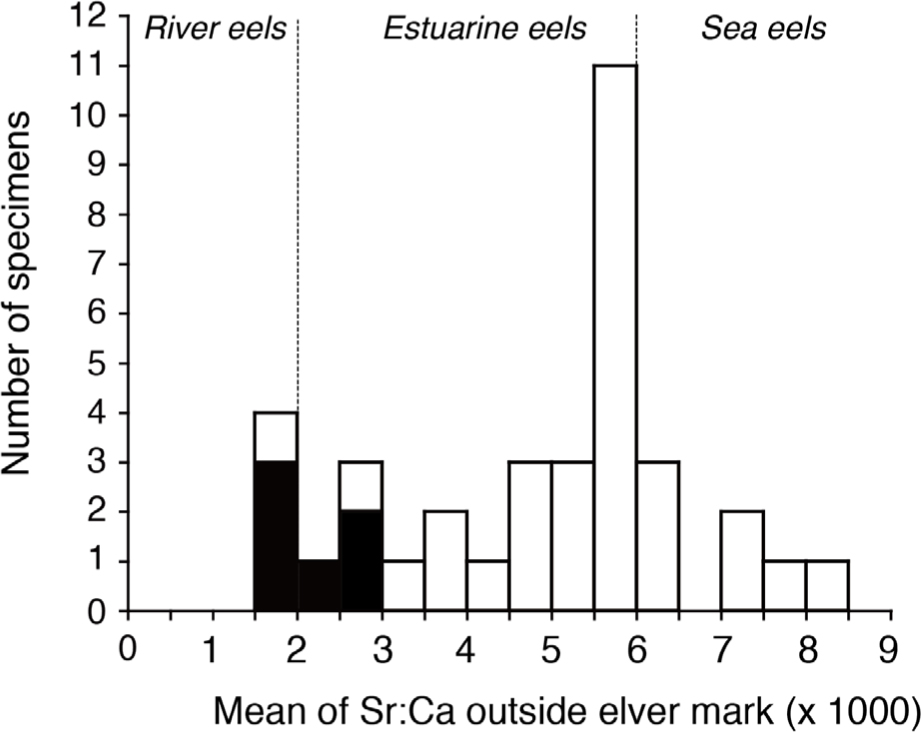
Figure 2
Frequency distribution of the mean values of the Sr:Ca ratio outside the elver mark (150 μm in radius) in each otolith of specimens of the Japanese eel. Black and white columns suggest silver eels and yellow eels, respectively
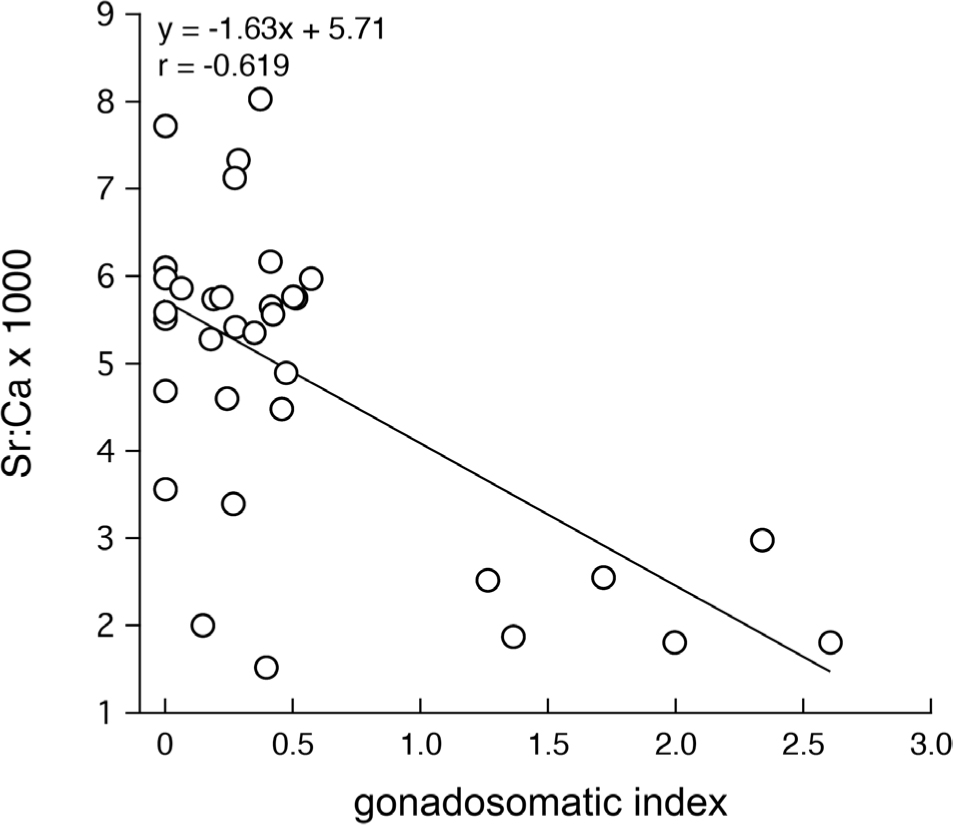
Figure 3
The relationship between the gonadosomatic index (GSI) and the mean values of the Sr:Ca ratio outside the elver mark (150 μm in radius) in each otolith of specimens of the Japanese eel
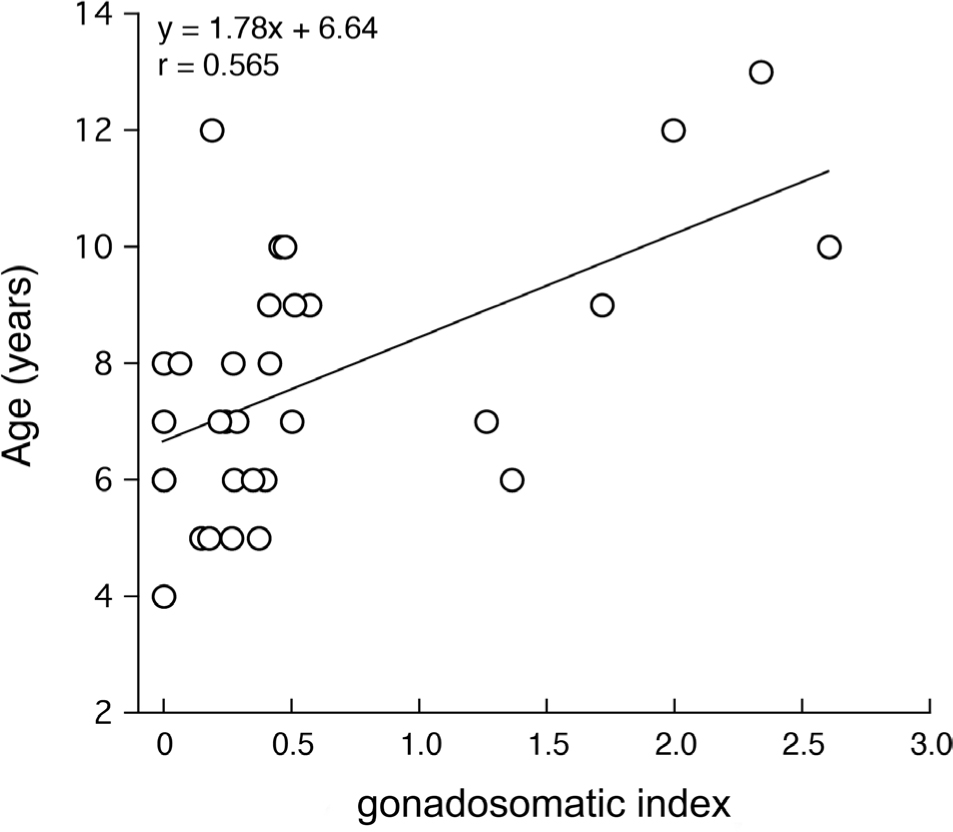
Figure 4
The relationship between the gonadosomatic index (GSI) and the age of the Japanese eel