
Figure 1
Figure 2
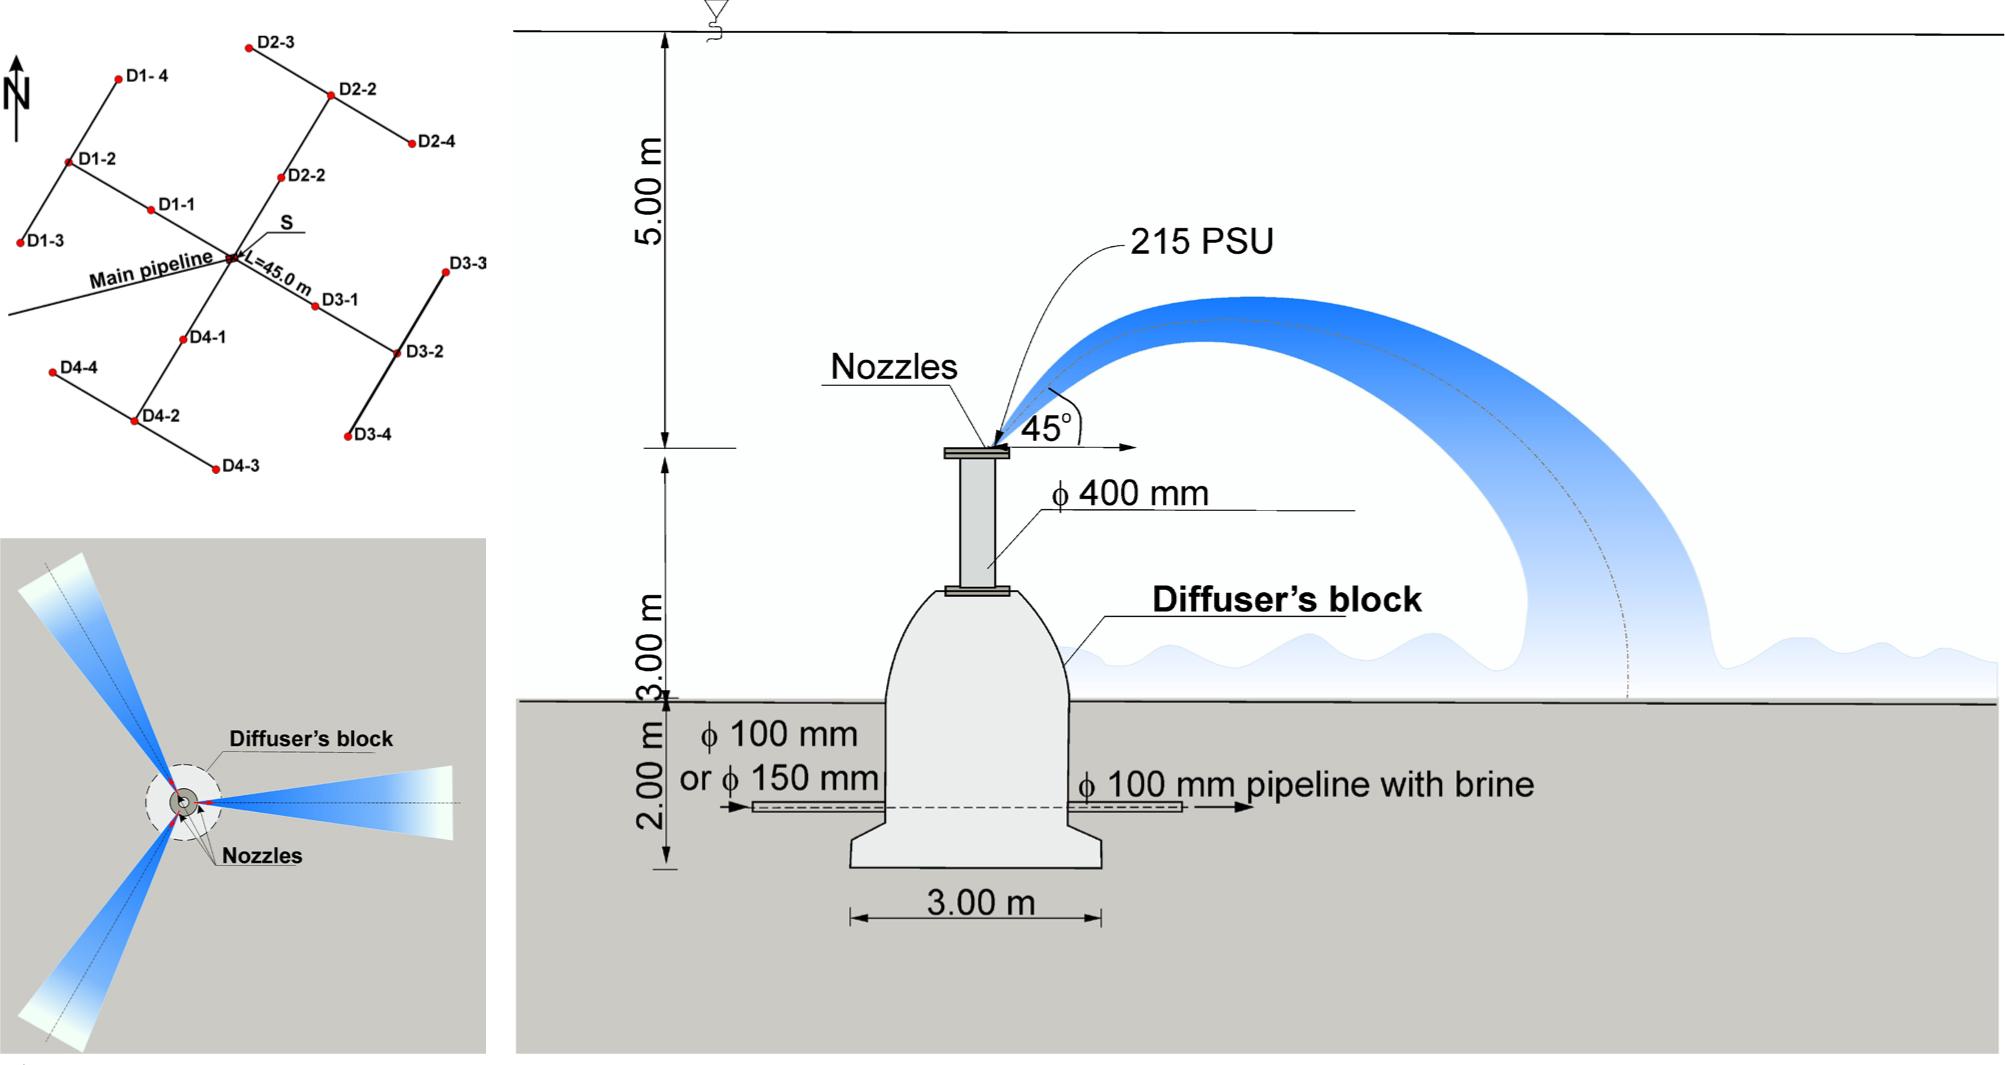
Figure 3
Figure 4
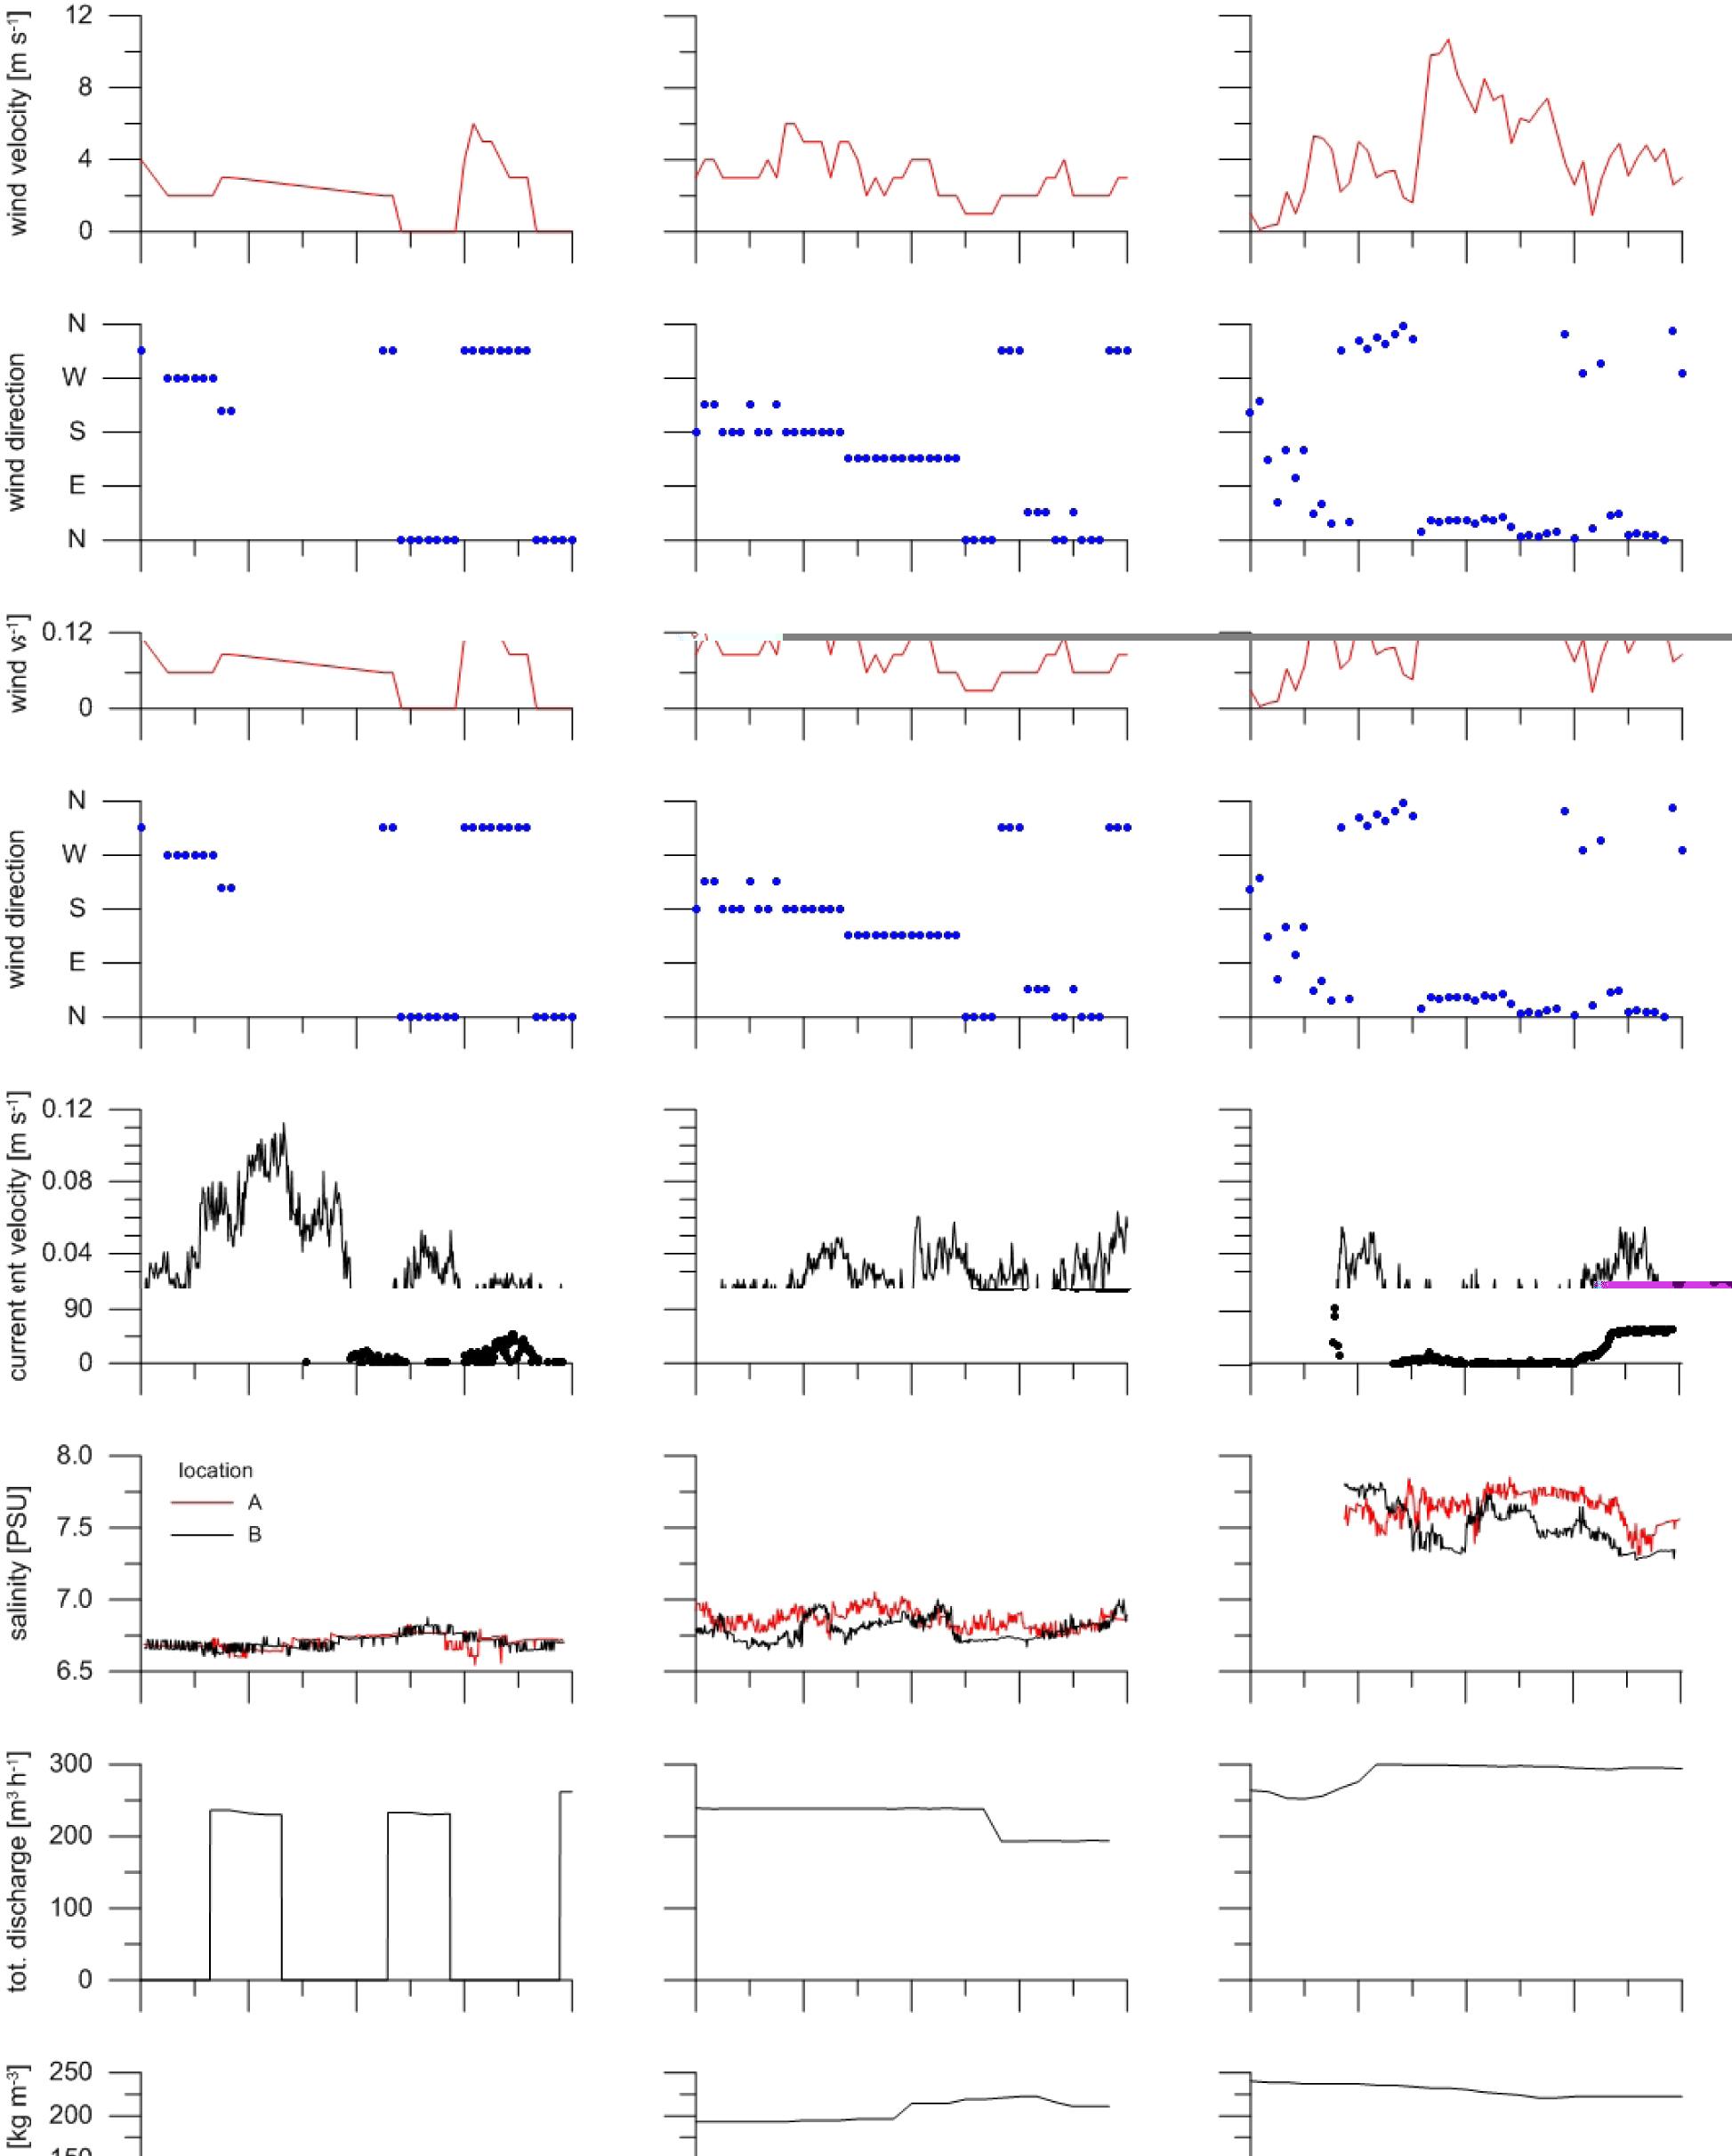
Figure 5
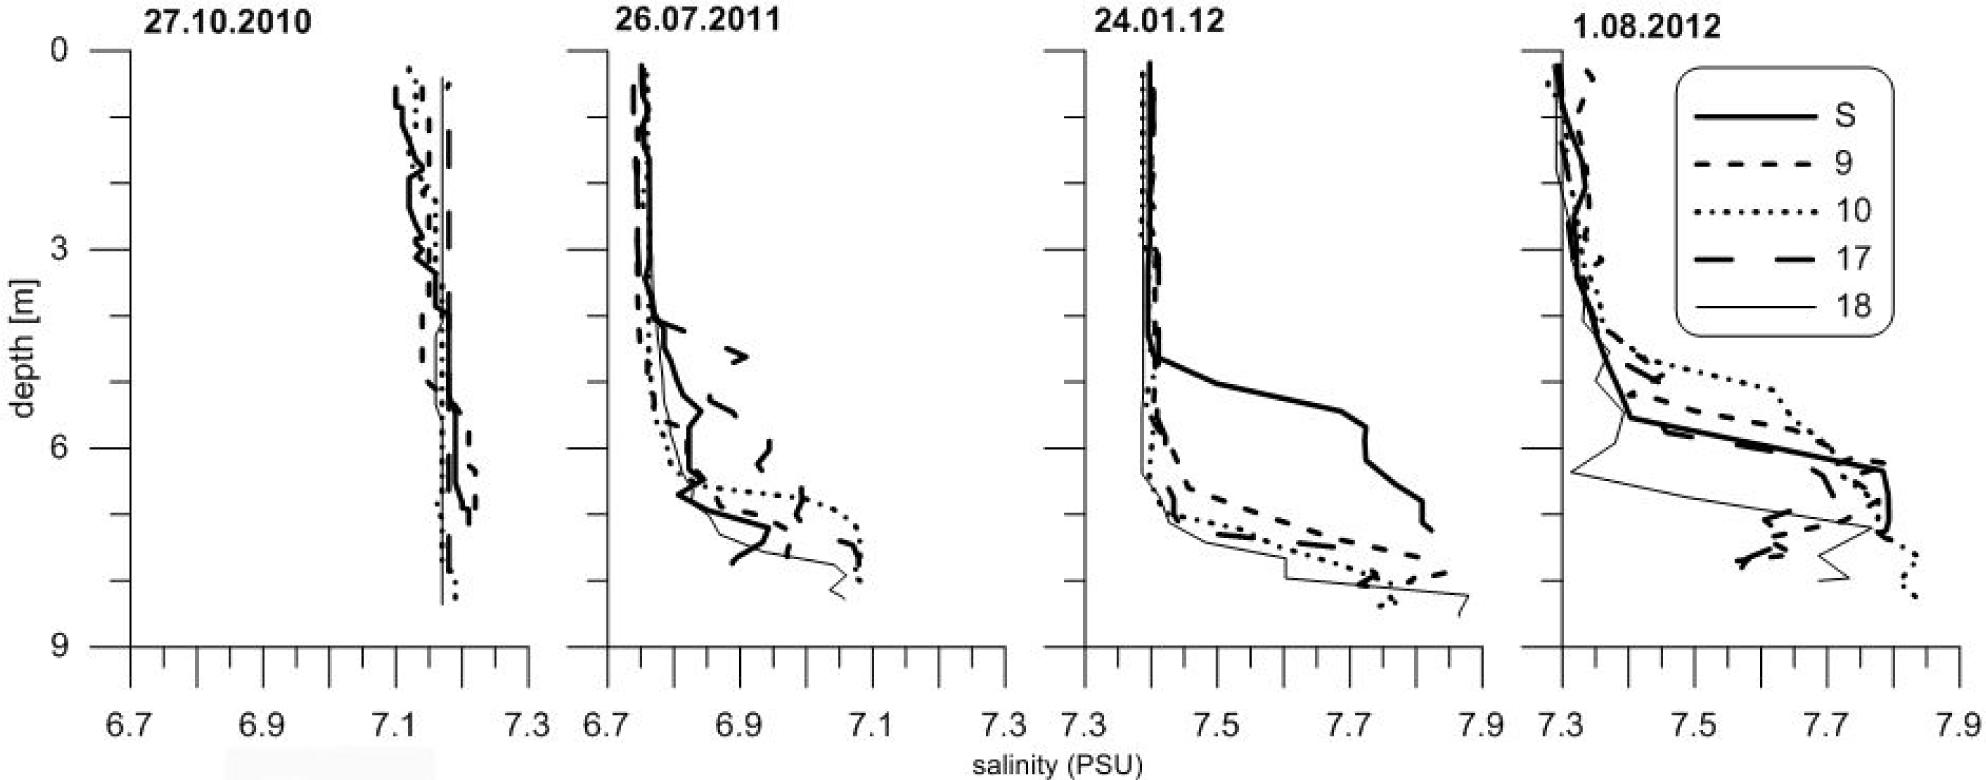
Figure 6
Figure 7

Figure 8
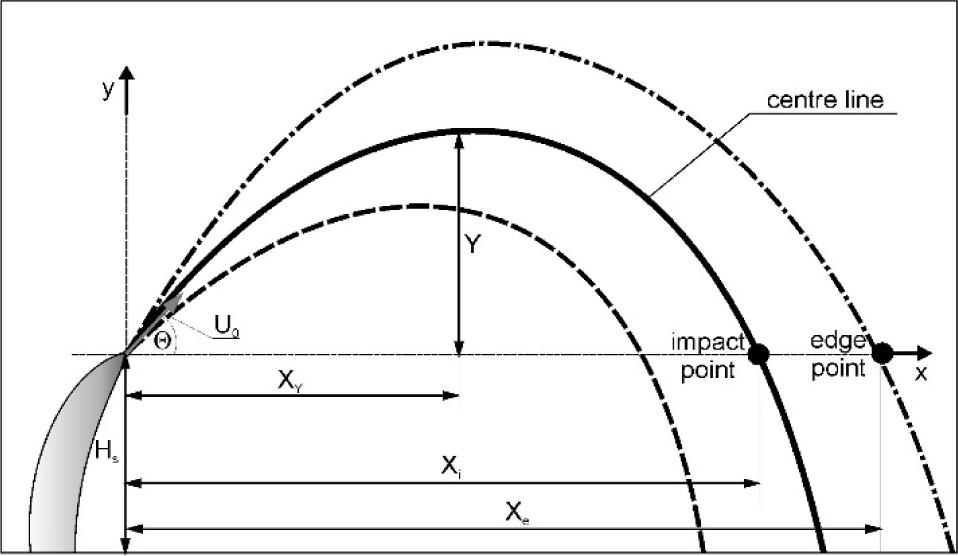
Figure 9

Figure 10

Figure 11
Figure 12
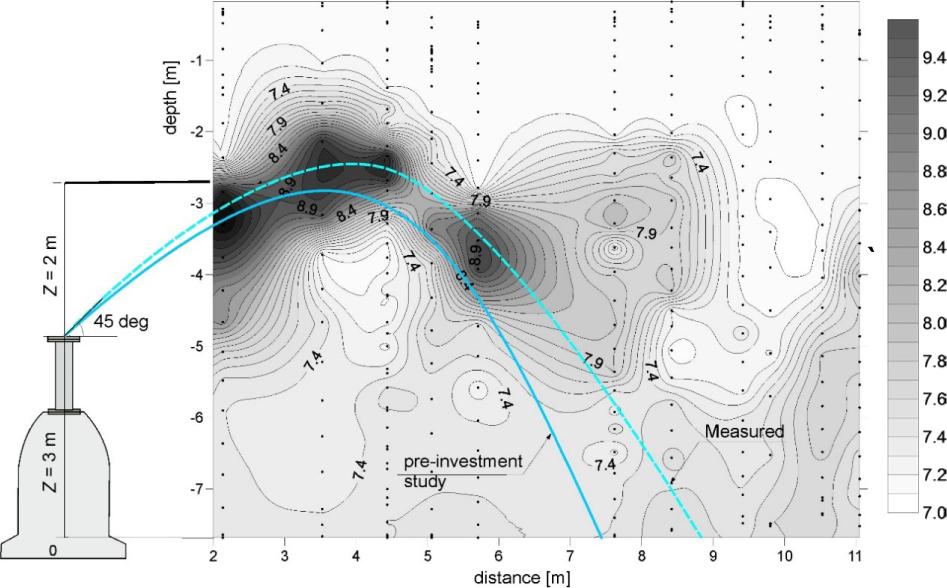
Figure 13

Values of the return/impact point dilution coefficient S estimated by relations based on laboratory experiments, modelling approaches and analytical solution for discharge with a 45° angle of incidence and stagnant water conditions, compared with estimates based on in-situ measurements (Hs – source height above the boundary, d – source diameter, Fr – densimetric Froude number)
| Hs/(Frd) | Dilution coefficient | |
|---|---|---|
| Laboratory experiments | ||
| Nemlioglu & Roberts(2006) | Not started,boundary interaction | 323 |
| Shao & Law(2010) | 0.05-0.47 | 239 |
| Papakonstantis et al.(2011) | 0.37-1.39 | 295±26.6 |
| Lai & Lee(2012) | 0.24-0.92 | 203 |
| Analytical solution | ||
| Kikkert et al.(2007) | No boundary | 182 |
| Predictive models | ||
| VisJet (Lai 2010) | No boundary | 148 |
| CorJet(Jirka 2008) | No boundary | 123 |
| JET 3D -condition as assumed in the pre-investment study | 1.37 | 360 |
| Measurements | 1.75 | 458 |
Comparison of brine discharge conditions assumed in the pre-investment study and actual brine discharge conditions_
| Parameter | Assumed | Actual |
|---|---|---|
| Nozzle diameter d(m) | 0.008 | 0.009 |
| Exit flow velocity U0(ms-1) | 30 | 22.2÷22.45 |
| Density of effluent ρe(kgm-3) | 1160 | 1160 |
| Density of ambient water ρa(kgm-3) | 1005 | 1005 |
| Densimetric Froude number Fr(-) | 273 | 190-192 |
| Angle of incidence(deg) | 45 | 45 |
| Velocity in reservoir v(ms-1) | 0 | 0.02÷0.06 |
Parameters of brine discharged during selected in-situ measurements
| Date | Q (m3h–1) | ρ (kg m–3) | d (m) | wind direction (deg) | wind velocity (m s–1) | ||||
|---|---|---|---|---|---|---|---|---|---|
| arm 1 | arm 2 | arm 3 | arm 4 | total | |||||
| 27.10.2010 | 0.0 | 0.0 | 76.8 | 57.8 | 135.3 | 1055 | 0.008 | 225 | 2 measured in Gdynia station |
| 26.07.2011 | 75.5 | 55.9 | 0.0 | 61.5 | 192.9 | 1135 | 0.009 | 315 | 4 measured in Gdynia station |
| 24.01.2012 | 74.9 | 74.5 | 74.7 | 75.8 | 299.9 | 1164 | 0.009 | 315 | 2 measured in Gdynia station |
| 1.08.2012 | 74.0 | 67.0 | 78.0 | 76.0 | 295.0 | 1160 | 0.009 | 120 | 3.5 measured at a center of installation (location S) |