
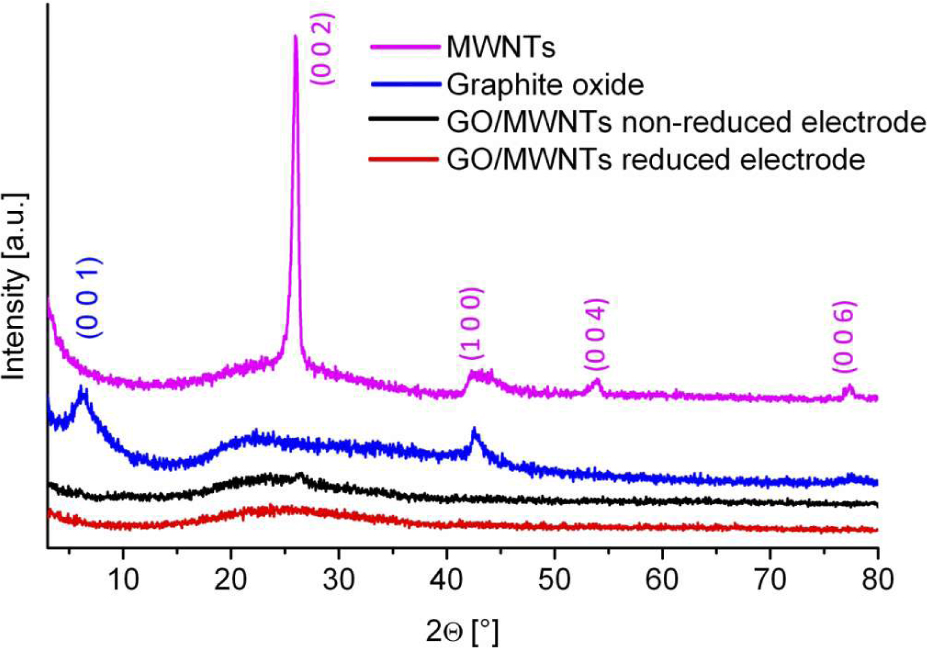
Fig. 1
XRD patterns of electrode materials, MWNTs and graphite oxide.
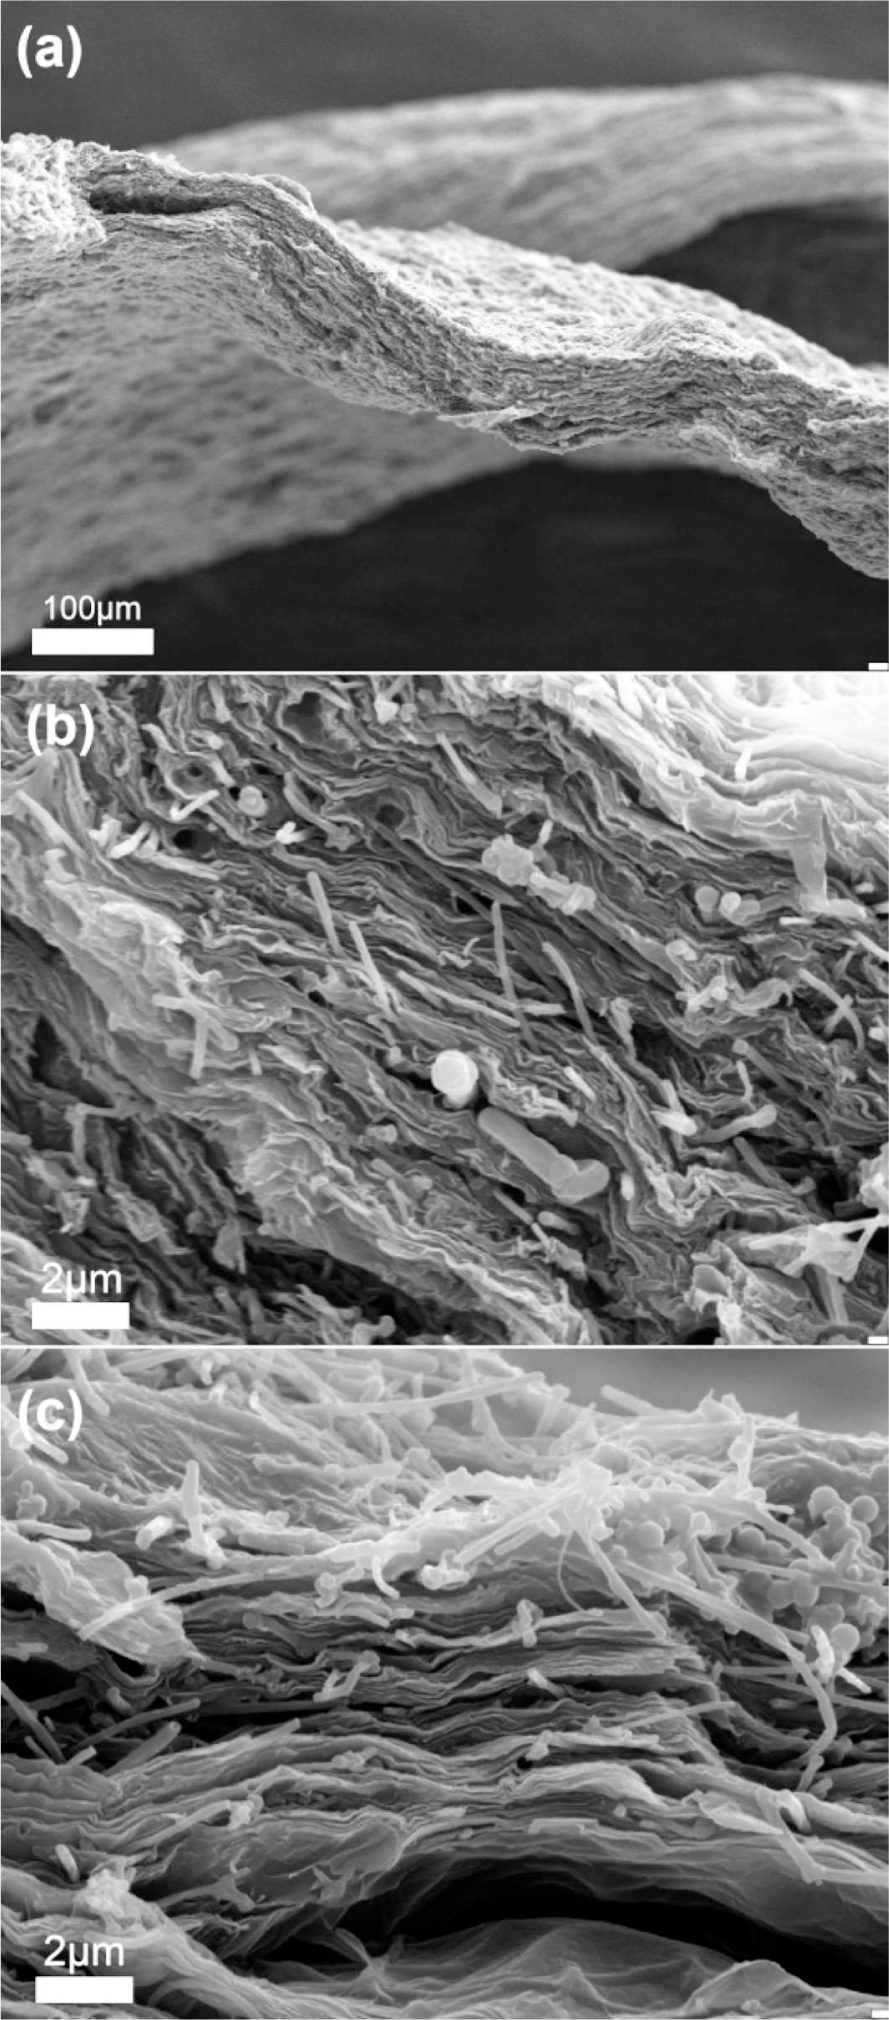
Fig. 2
Cross-section SEM images of non-reduced electrode (a, b) and photothermally reduced (c) electrodes.
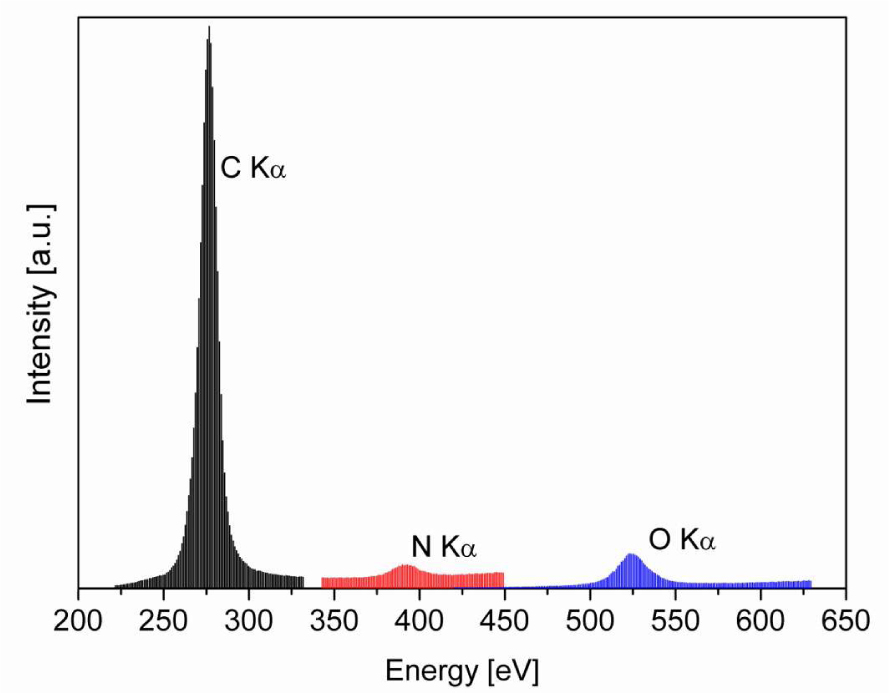
Fig. 3
WDS spectrum of GO/MWNTs non-reduced electrode.
Table 1
Composition of the non- and photothermally reduced electrodes using the WDS.
| Non-reduced | Photothermally reduced | |
|---|---|---|
| CKα [%] | 80.63±0.17 | 83.53±0.27 |
| NKα [%] | 8.3±1.2 | 5±3 |
| OKα [%] | 11.1±0.6 | 11±1 |
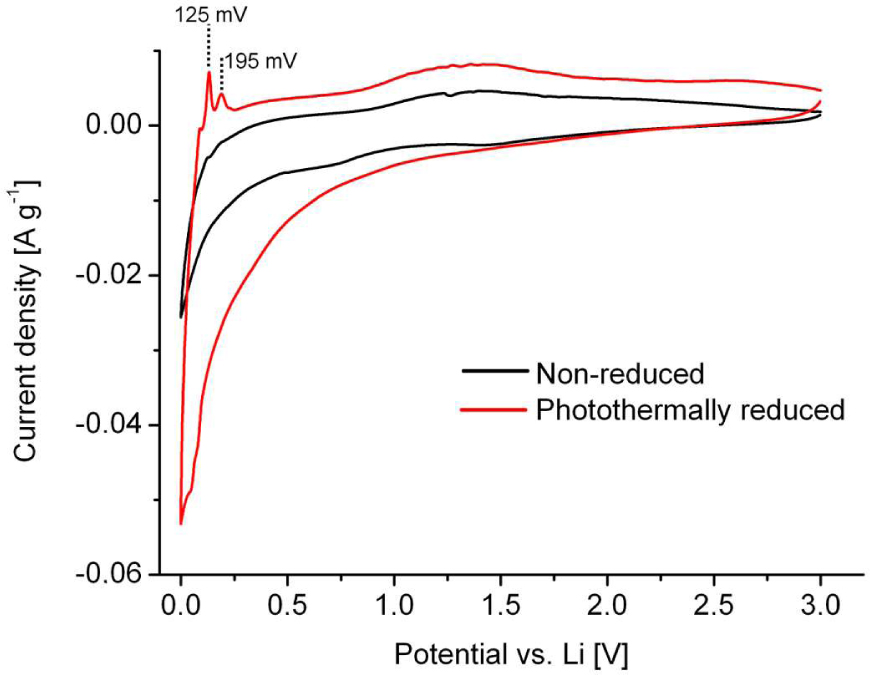
Fig. 4
Cyclic voltammetric curves of electrodes.
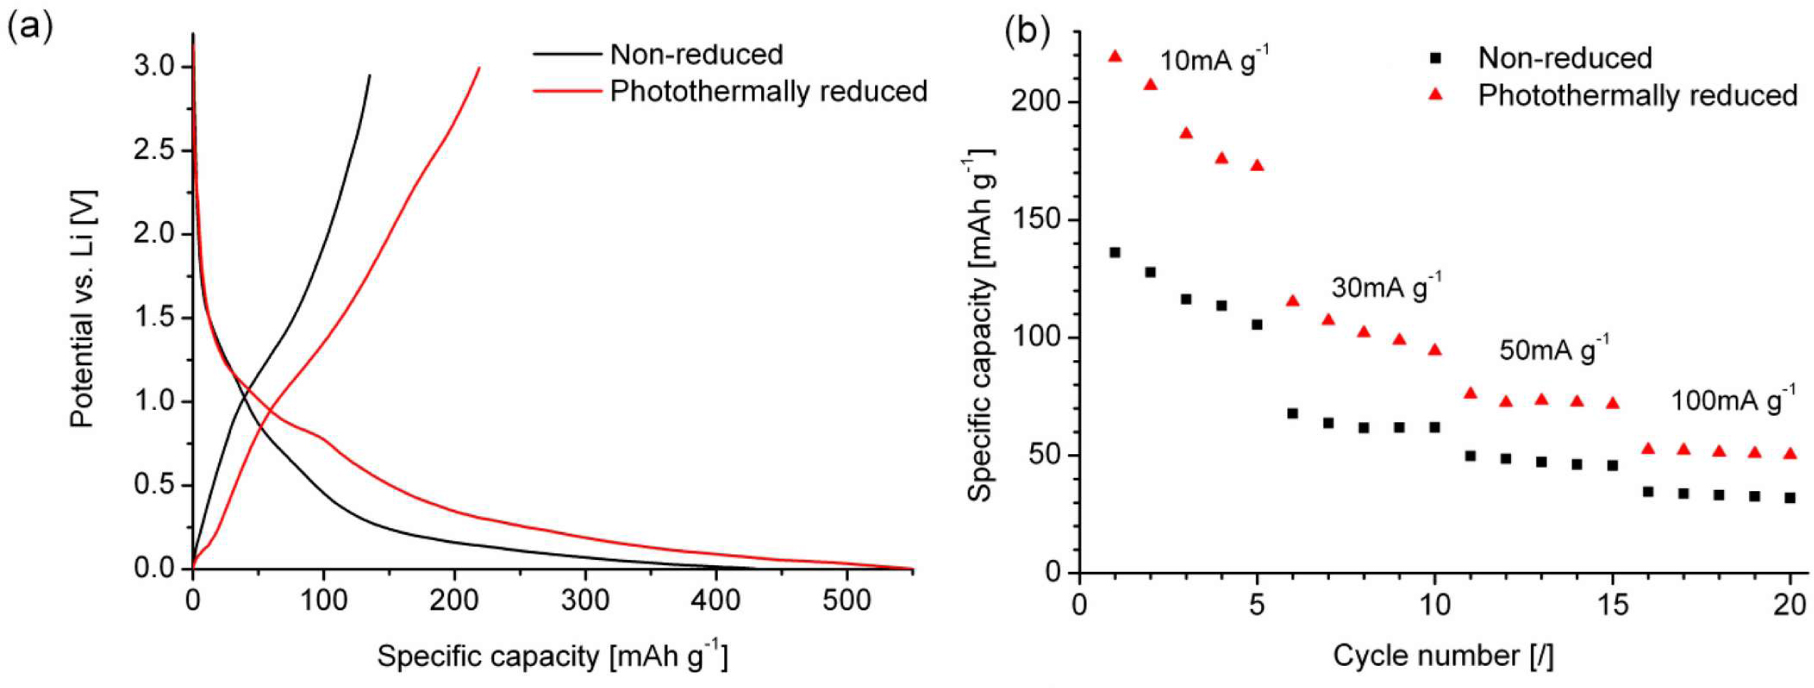
Fig. 5
First cycle charge/discharge profiles (a) and specific capacity of GO/MWNTs electrodes (b).