
Fig. 1

Fig. 2
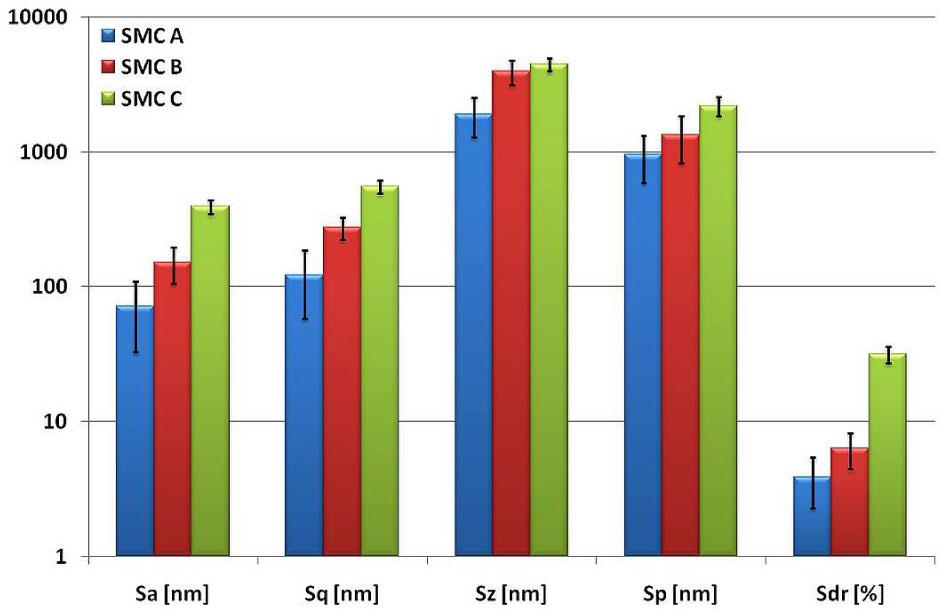
Fig. 3
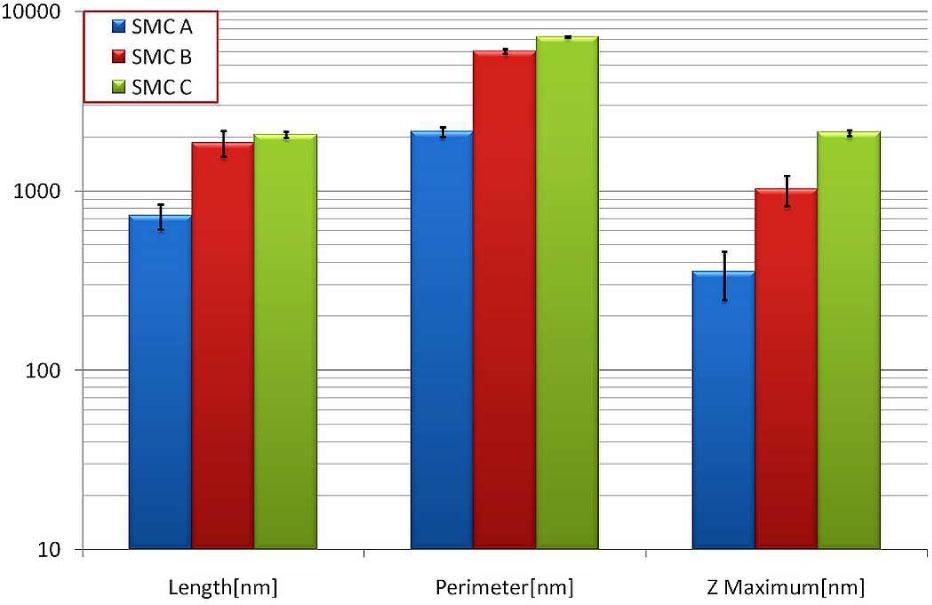
Fig. 4
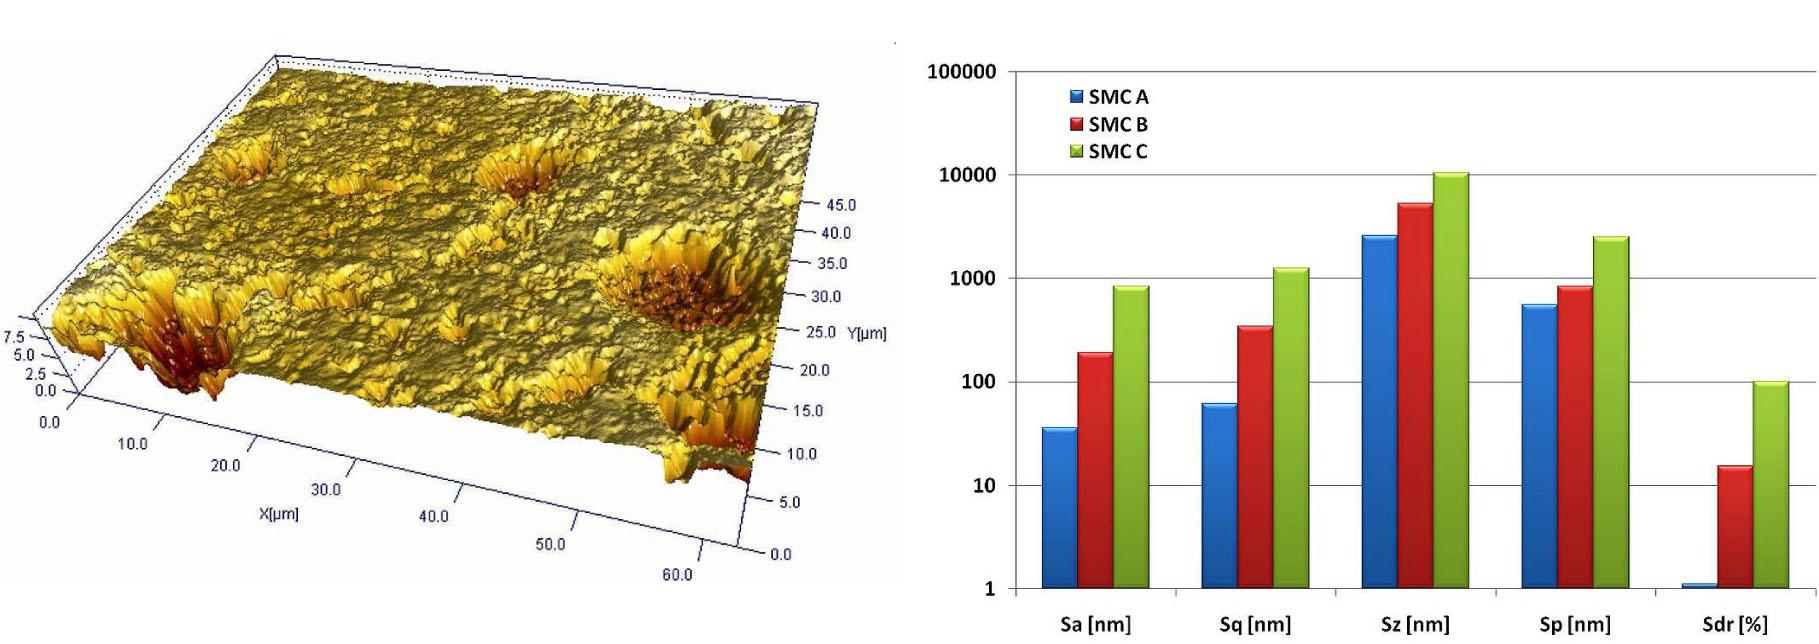
Fig. 5
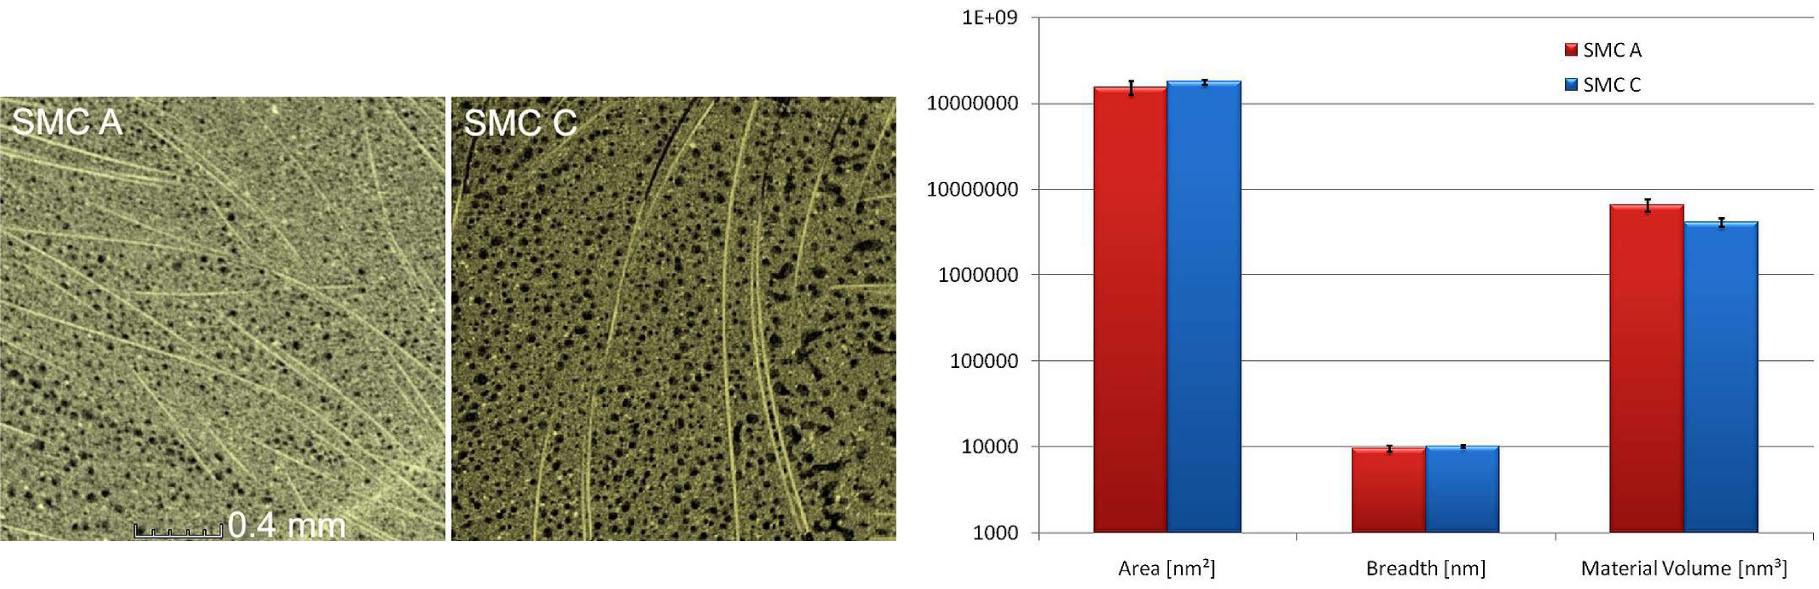
Fig. 6
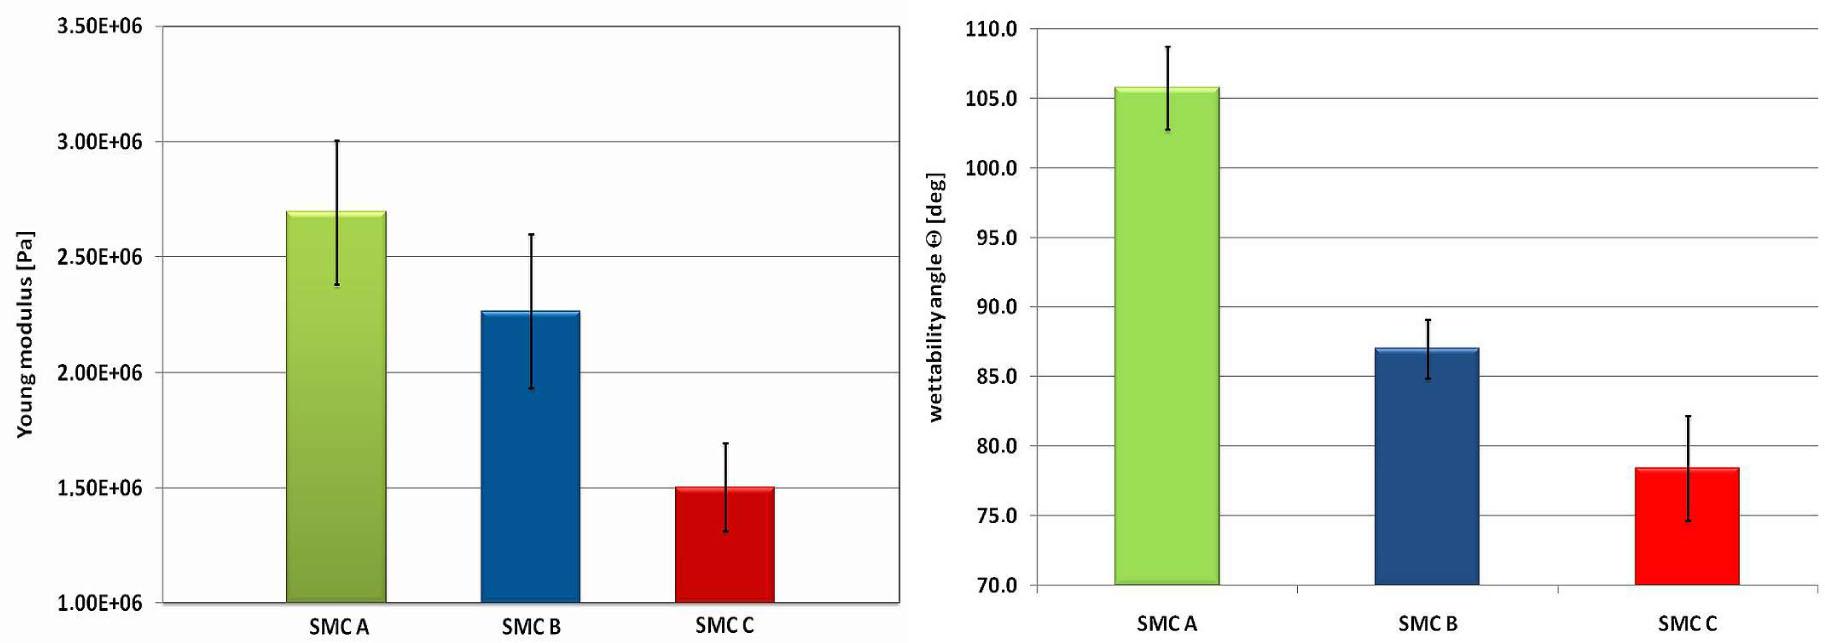
Fig. 7
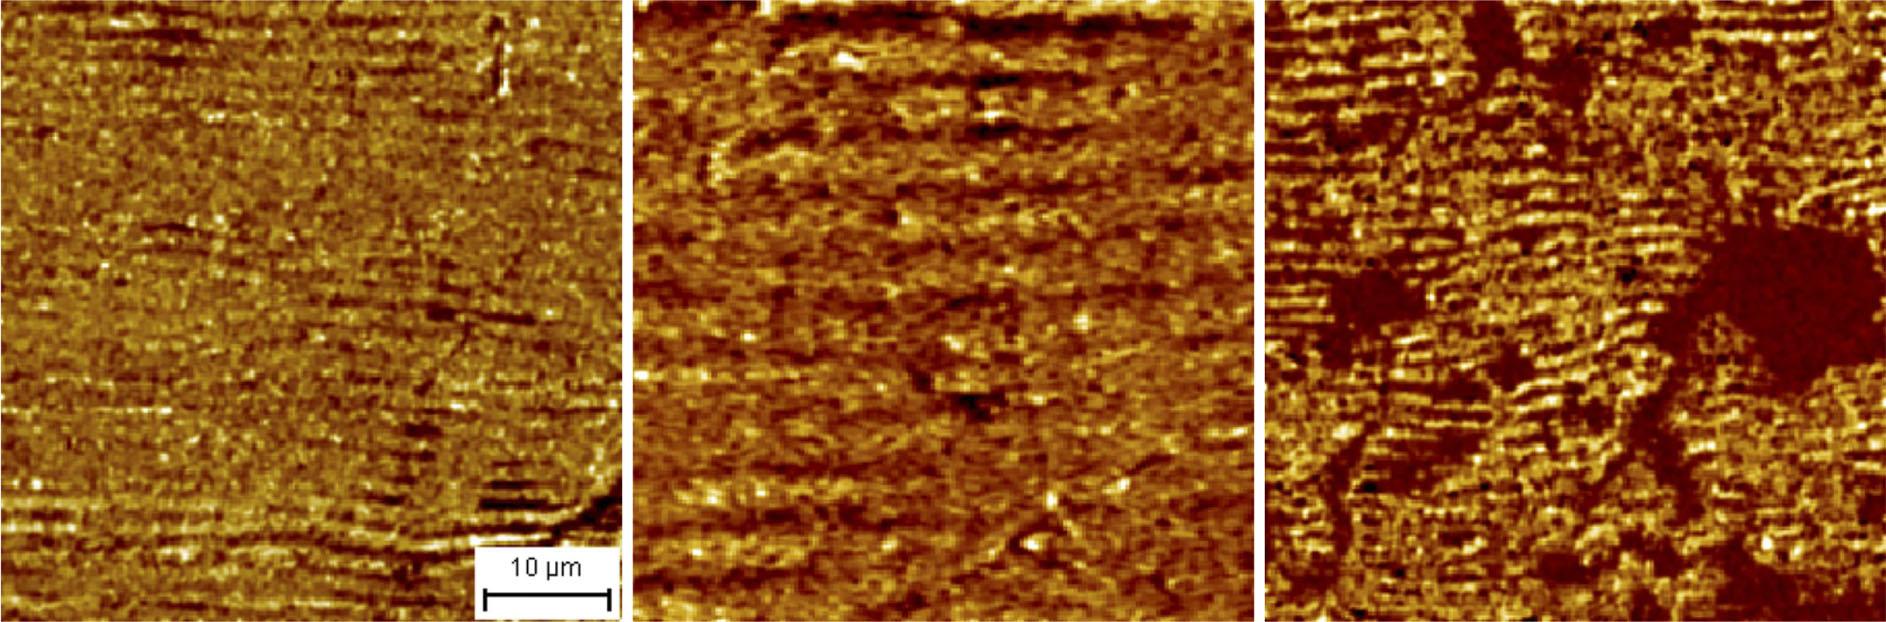
Fig. 8
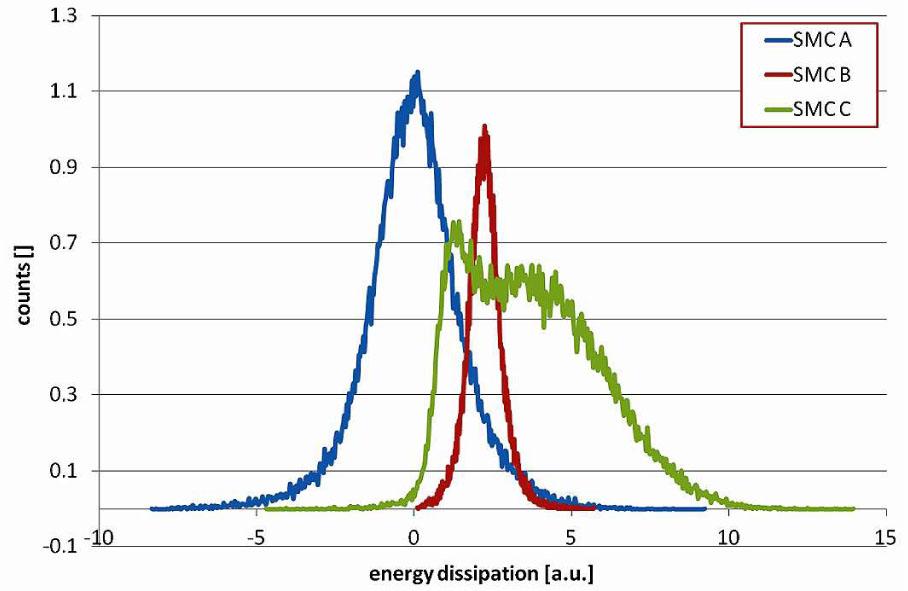
Fig. 9
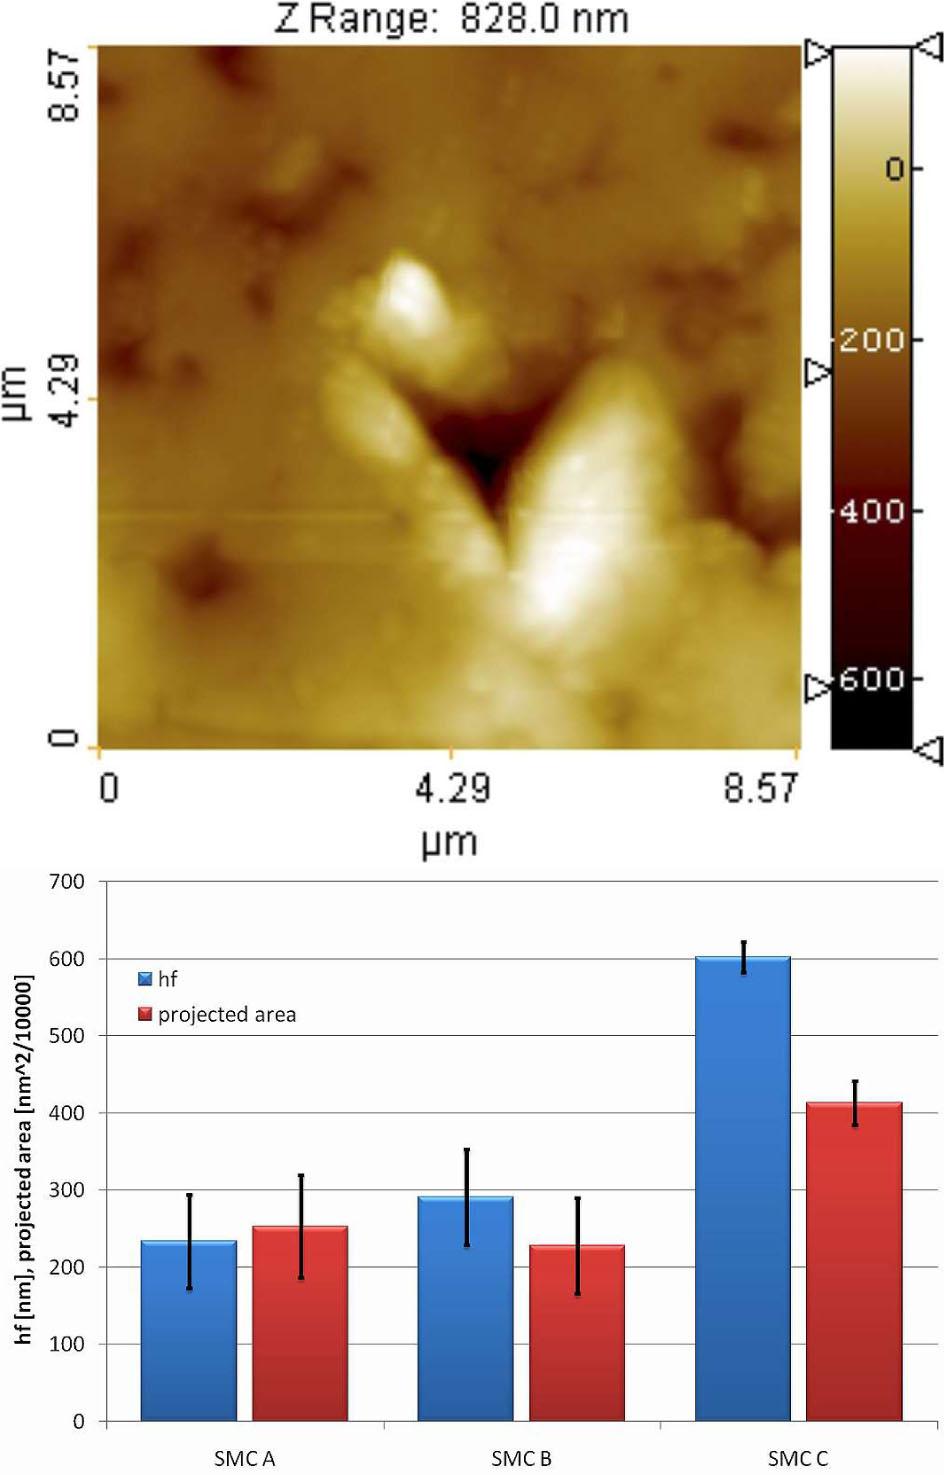
Fig. 10
The ratios of selected factors obtained for presented measurement techniques showing the sensitivity of detection of SMC surface deterioration_
| Parameter | B/A ratio | C/A ratio | |
|---|---|---|---|
| Sa | 2.11 | 5.50 | |
| Sq | 2.24 | 4.53 | |
| Sz | 2.08 | 2.35 | |
| SP | 1.41 | 2.31 | |
| Atomic force microscopy | Sdr | 1.64 | 8.19 |
| Length | 2.55 | 2.83 | |
| Perimeter | 2.81 | 3.39 | |
| Z max | 2.89 | 5.98 | |
| Young module | 0.84 | 0.56 | |
| Energy dissipation | 22.05 | 36.97 | |
| Sa | 5.23 | 23.20 | |
| Sq | 5.52 | 20.37 | |
| Optical profilometry | Sz | 2.07 | 4.03 |
| SP | 1.49 | 4.50 | |
| Sdr | 13.80 | 90.63 | |
| Area | - | 1.16 | |
| Microcomputer Tomography | Breadth | - | 1.07 |
| Material Volume | - | 0.63 | |
| Wettability | 0.91 | 0.73 | |
| Impact strength | - | 0.97 |