
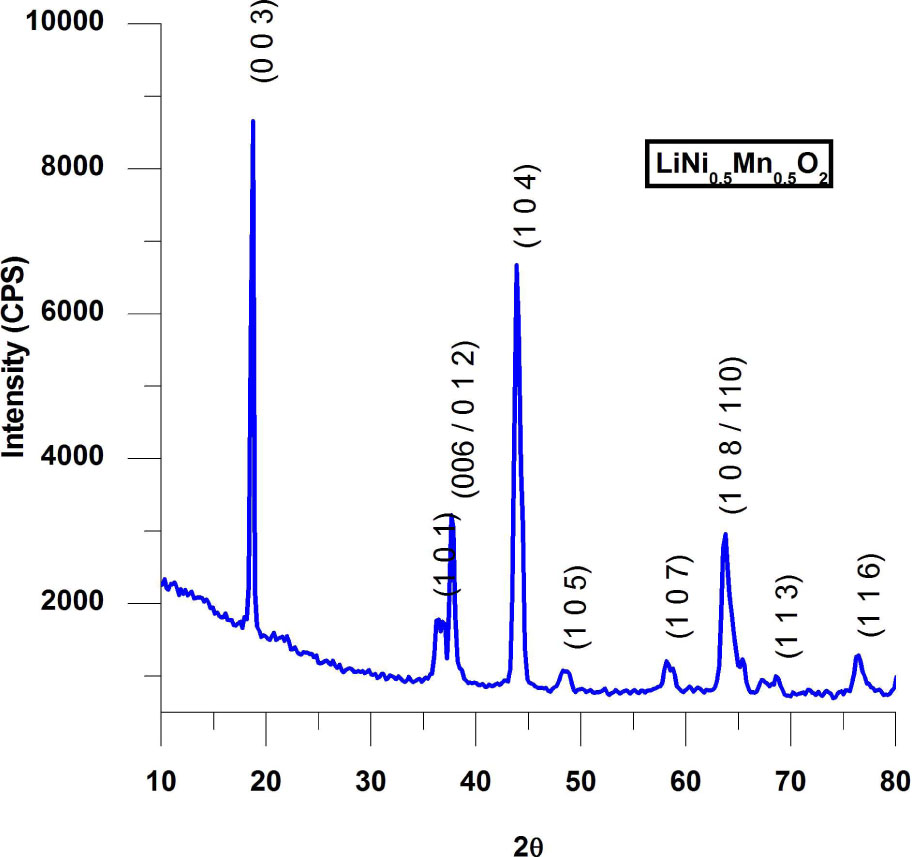
Fig. 1
XRD pattern of LiNi0.5Mn0.5O2 prepared by sol-gel method.
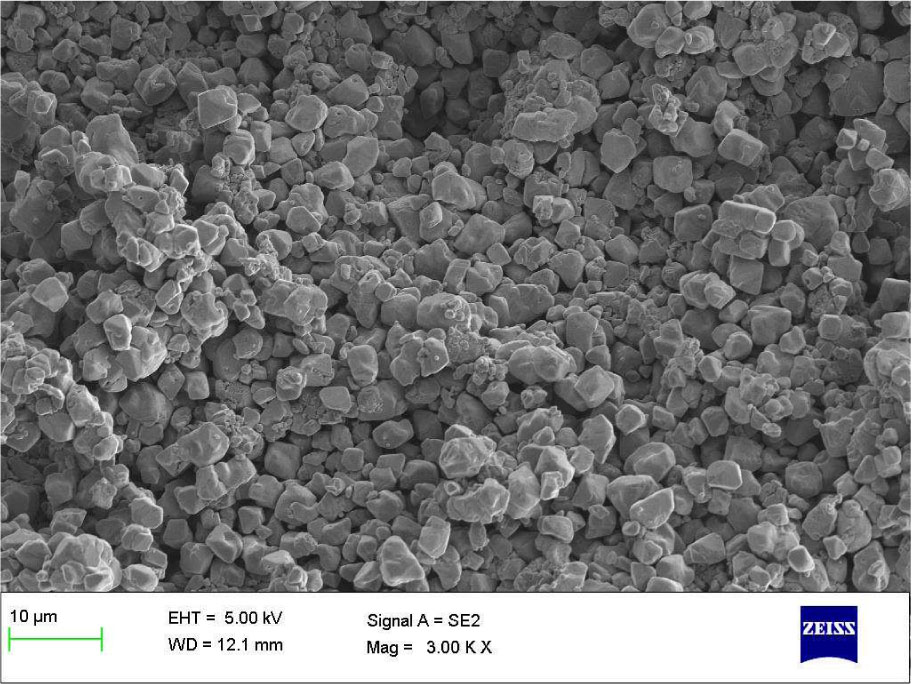
Fig. 2
FESEM image of LiNi0.5Mn0.5O2 powder.
Table 2
FT-IR wavenumbers variation of LiNi0.5Mn0.5O2 sample.
| Source | Wavenumbers [cm−1] | |||
|---|---|---|---|---|
| authors | 421.4644 | 477.4024 | 512.0154 | 615.248 |
| [37] | – | 474 | 532 | 597 |
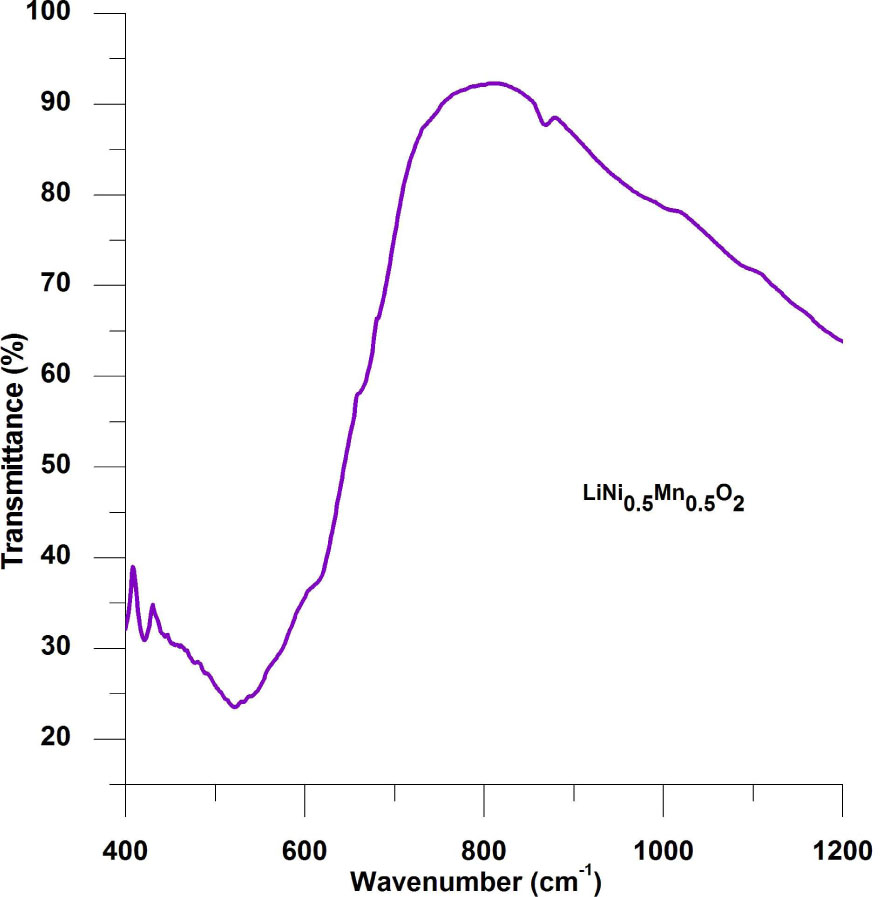
Fig. 3
FT-IR graph of LiNi0.5Mn0.5O2 sample.
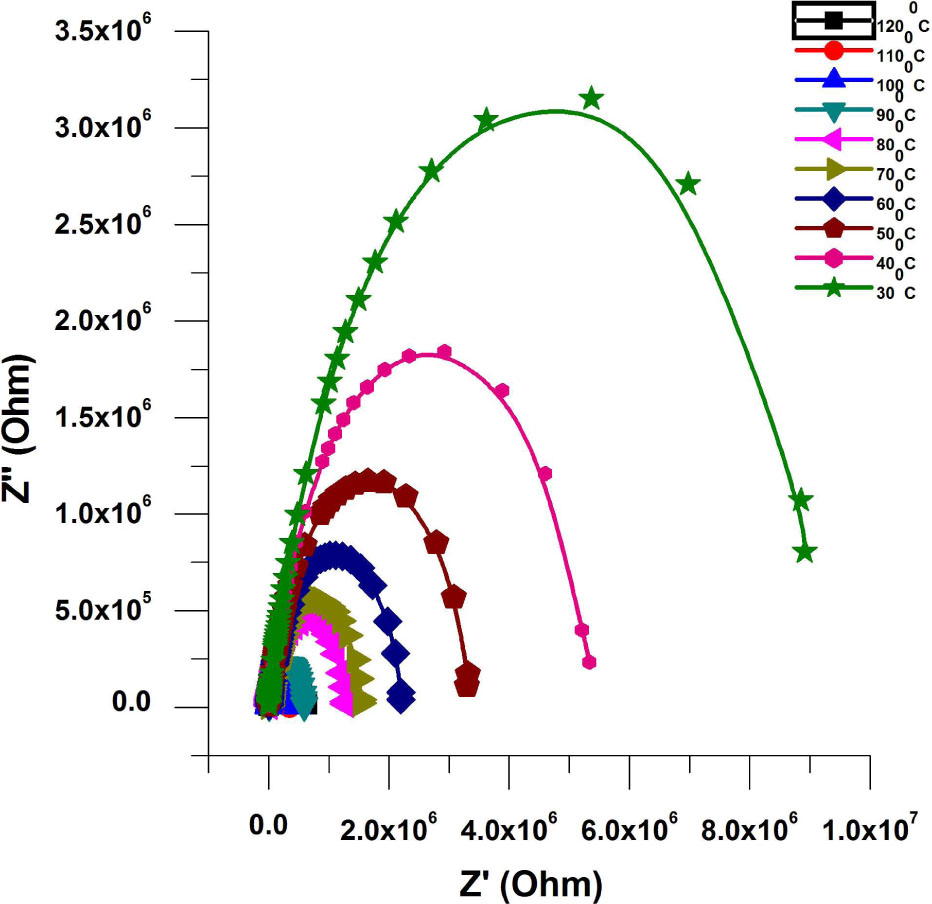
Fig. 4
Nyquist plots for LiNi0.5Mn0.5O2 material at different temperatures.
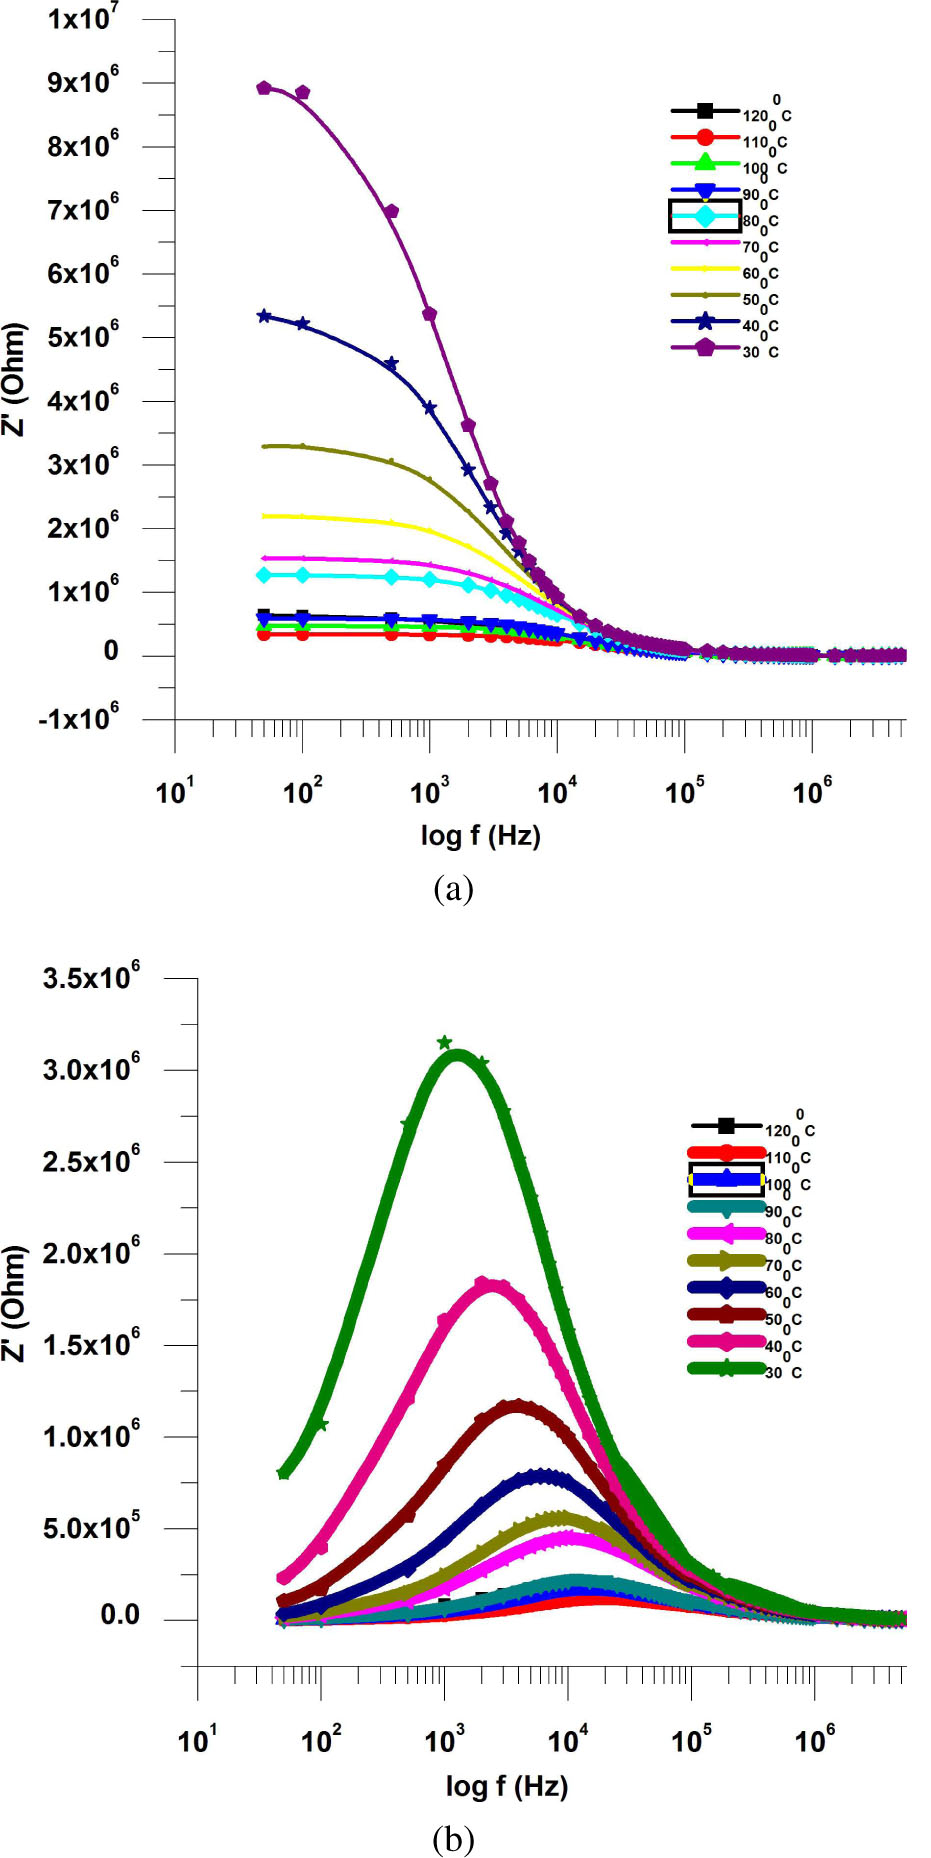
Fig. 5
(a) real and (b) imaginary part of impedance of LiNi0.5Mn0.5O2 material as a function of frequency at different temperatures.
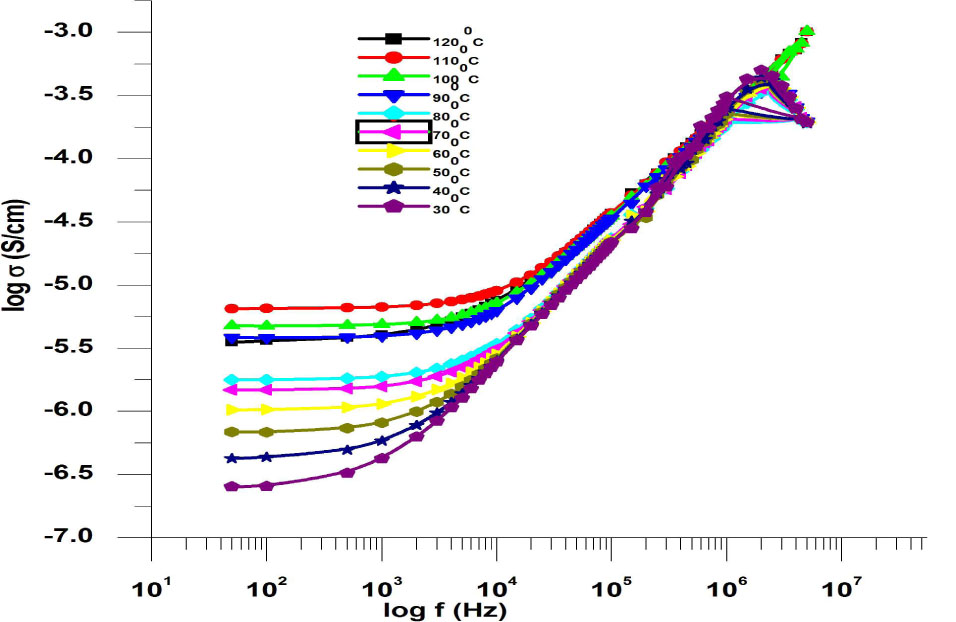
Fig. 6
Variation of AC conductivity of LiNi0.5Mn0.5O2 material as a function of frequency at different temperatures.
Table 3
AC conductivity values of LiNi0.5Mn0.5O2 sample.
| Temperature [°C] | AC conductivity [S/cm] |
|---|---|
| LiNi0.5Mn0.5O2 | |
| 30 | 2.54×10−07 |
| 40 | 4.24×10−07 |
| 50 | 6.87×10−07 |
| 60 | 1.03×10−06 |
| 70 | 1.47×10−06 |
| 80 | 1.78×10−06 |
| 90 | 3.84×10−06 |
| 100 | 4.75 × 10−06 |
| 110 | 6.54 × 10−06 |
| 120 | 3.52 × 10−06 |
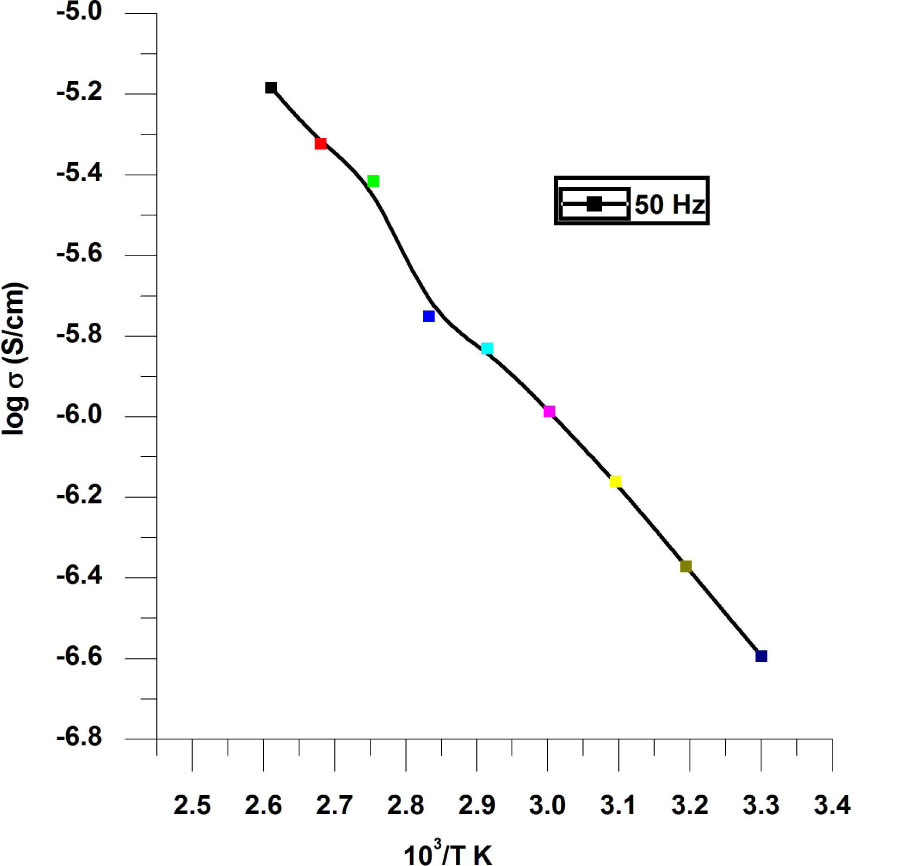
Fig. 7
Arrhenius plots of AC conductivity for LiNi0.5Mn0.5O2 material.
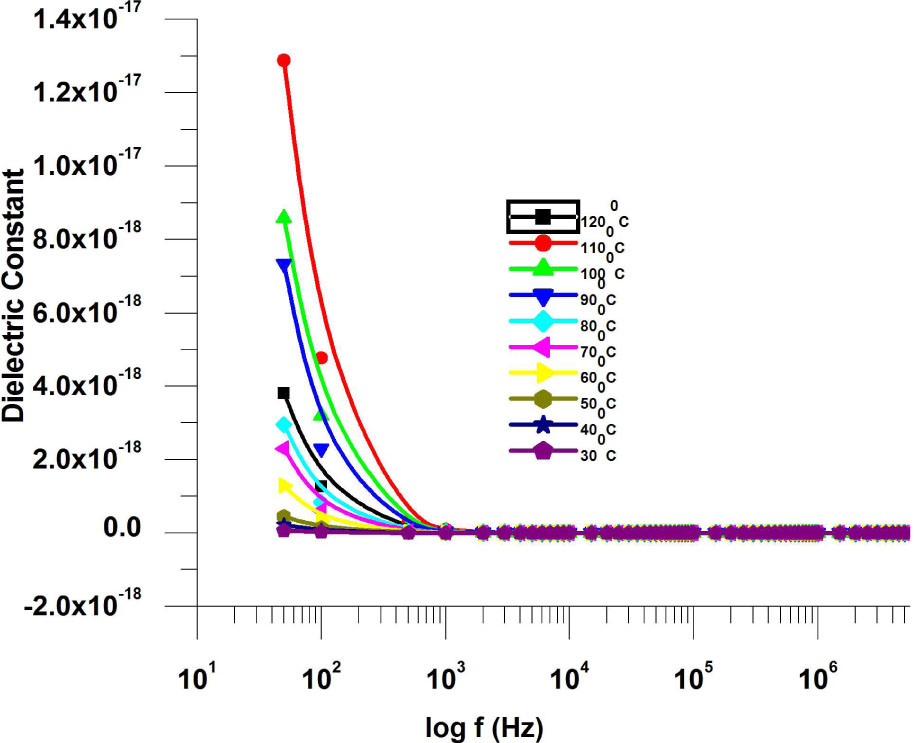
Fig. 8
Frequency variation of dielectric constant of LiNi0.5Mn0.5O2 material at different temperatures.
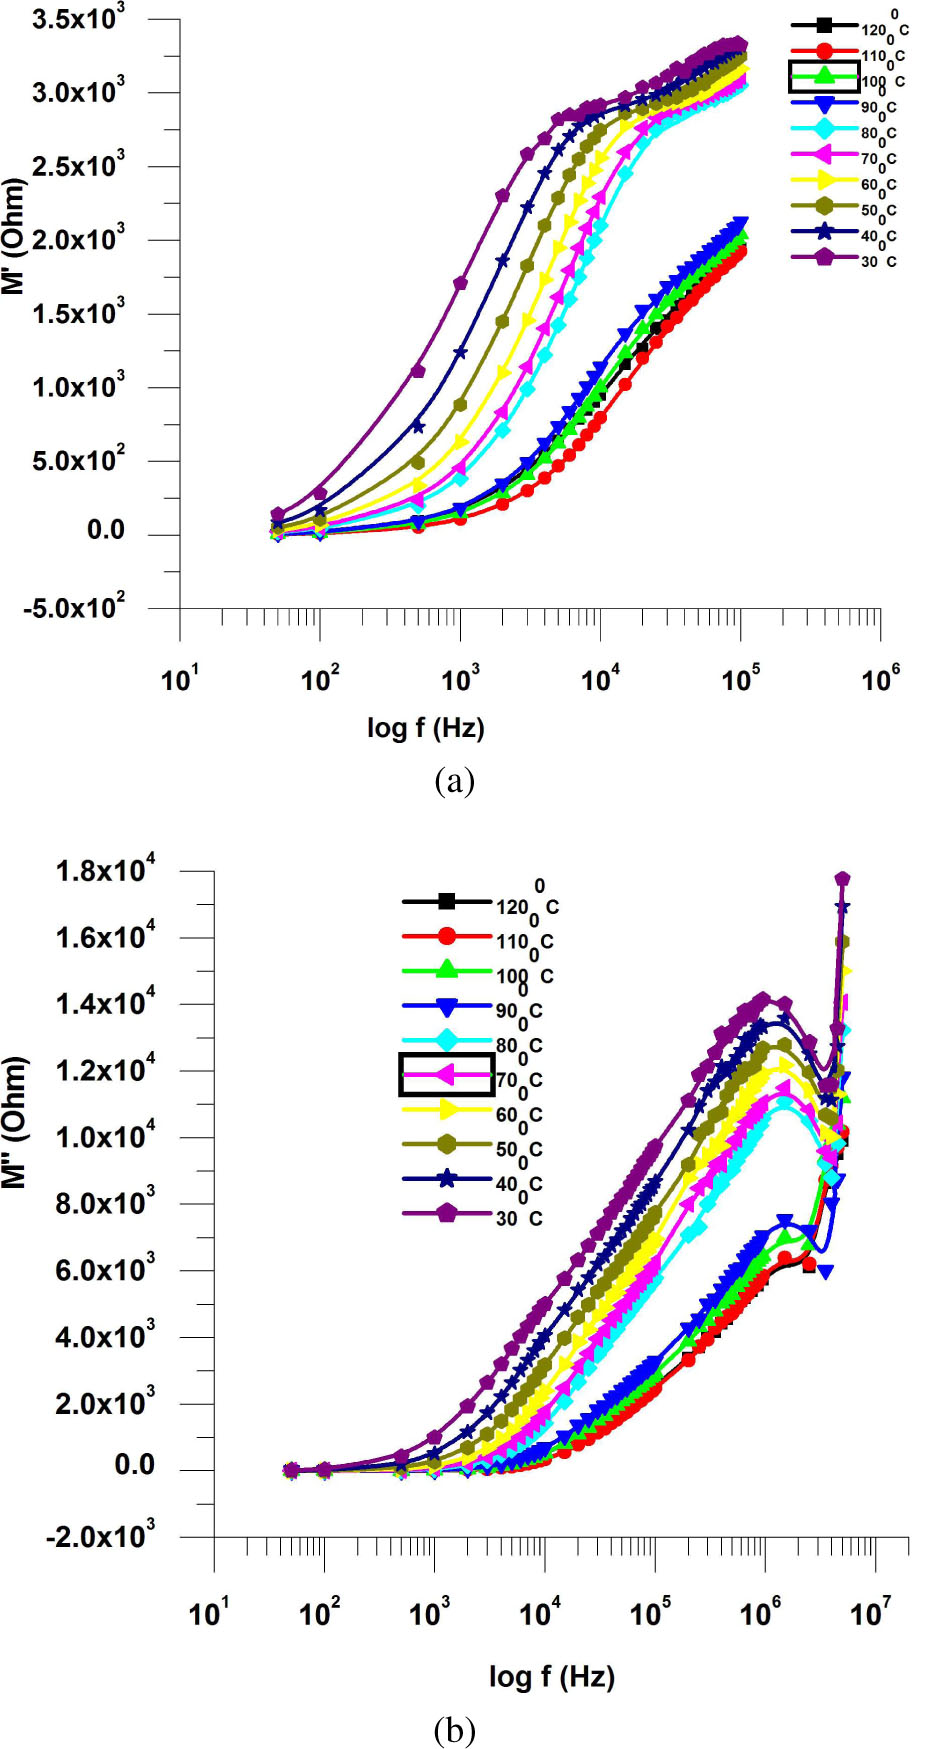
Fig. 9
(a) and (b): real and imaginary part of modulus for LiNi0.5Mn0.5O2 material as a function of frequency at different temperatures.