
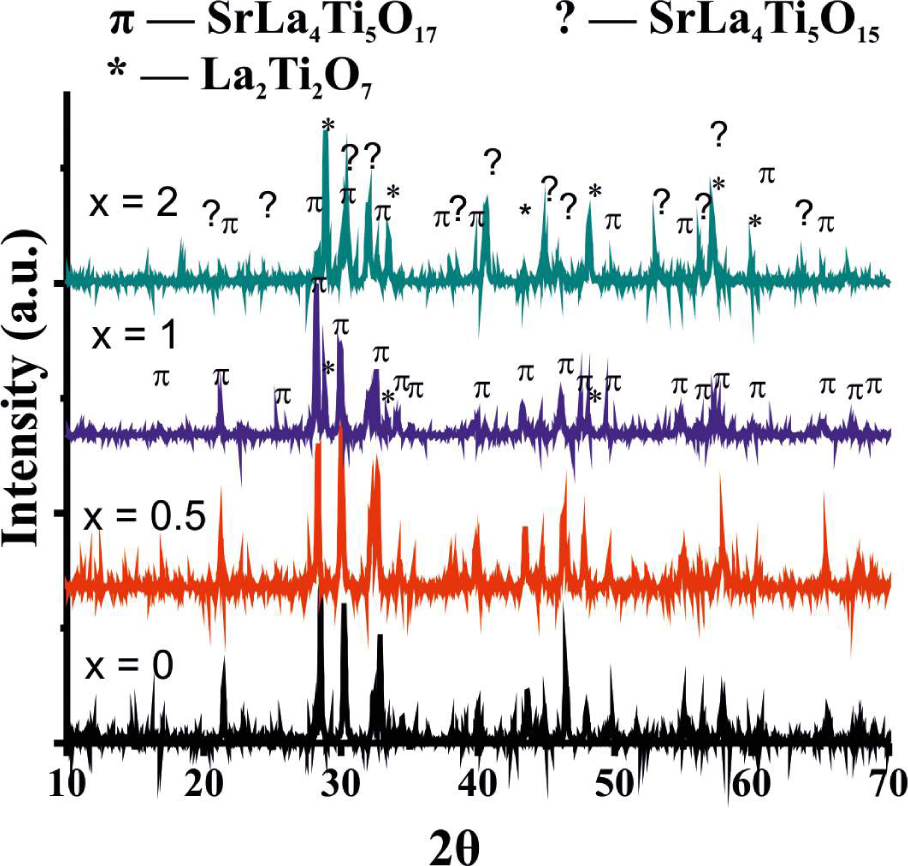
Fig. 1
XRD patterns of SrLa4Ti5−xSnxO17 (0 ≤ x ≤ 2) ceramics, showing the formation of SrLa4Ti5O17, SrLa4Ti4.5Sn0.5O17 at x = 0 and 0.5, SrLa4Ti4Sn1O17 along with La2Ti2O7 at x = 1 and La2Ti2O7 and SrLa4Ti4O15 along with a few diminishing peaks due to SrLa4Ti4SnO17 at x = 2.
Table 1
Elemental composition (in moles) calculated from semi-quantitative EDS data of the grains labelled in Fig. 2.
| Grain | Sr | La | Ti | Sn |
|---|---|---|---|---|
| A | 1 | 4.12 | 4.26 | 0 |
| B | 1 | 4.10 | 4.20 | 0.6 |
| C | 2.95 | 10.17 | 9.36 | 1 |
| D | 1.35 | 13.93 | 15.09 | 1 |
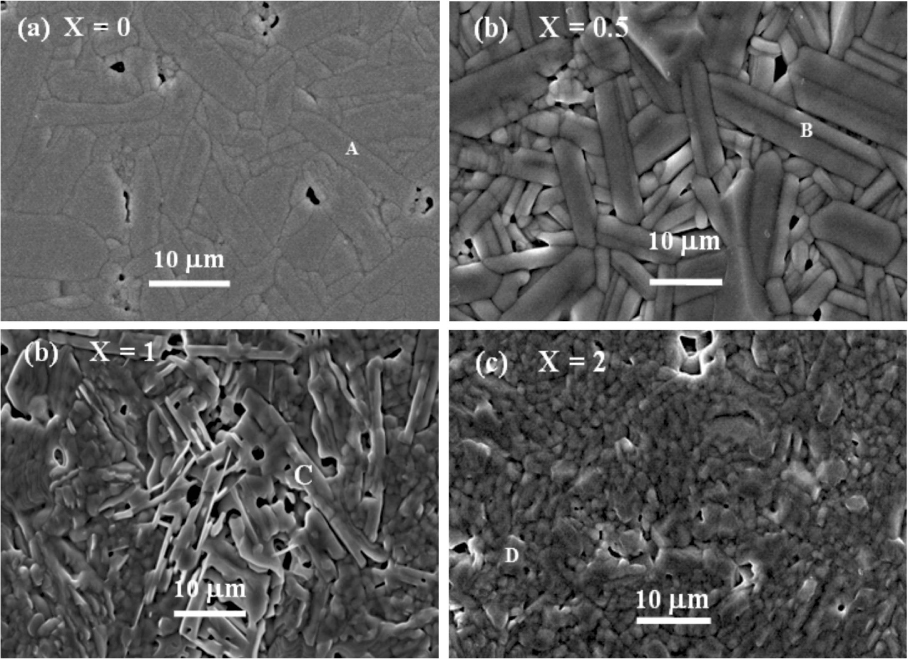
Fig. 2.
SEIs recorded from thermally etched, gold-coated sintered SrLa4Ti5−xSnxO17 compositions showing (a) elongated grains at x = 0, (b) elongated grains at x = 0.5, (c) elongated grains at x = 1, (d) cuboidal shaped grains at x = 2.
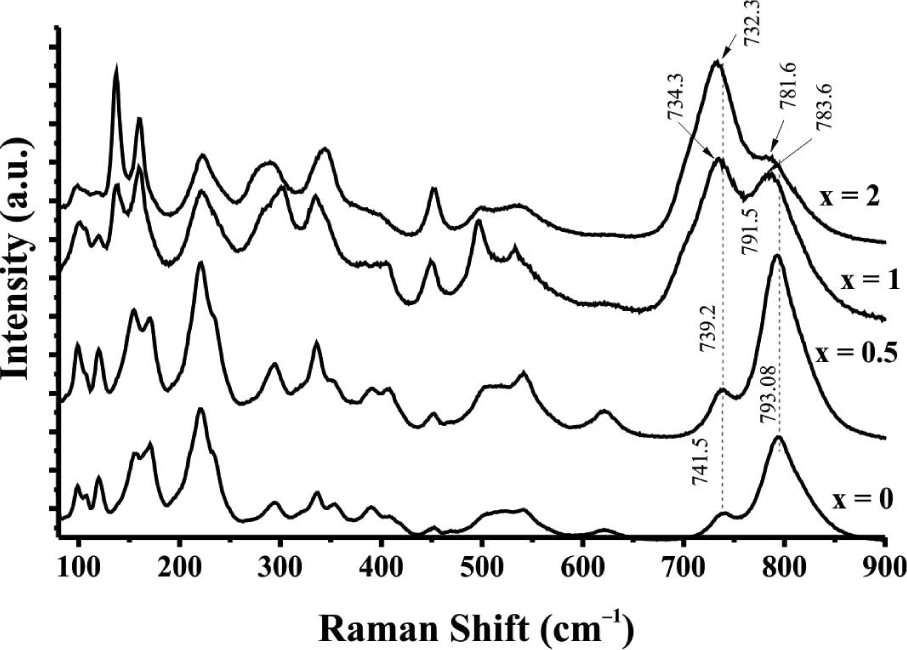
Fig 3.
Raman spectra recorded at room temperature for SrLa4Ti5−xSnxO17 (0 ≤ x ≤ 2) compositions.
Table 2
Preparation conditions, apparent densities and microwave dielectric properties of SrLa4Ti5−xSnxO17 (0 ≤ x ≤ 2).
| x | CT[°C] | ST[°C] | ρexp[g/cm3] | εr | Qufo [GHz] | τf [ppm/°C] |
|---|---|---|---|---|---|---|
| 0 | 1250/6h | 1500/4h | 5.41 | 65.0 | 11150 | +118 |
| 0.5 | 1300/6h | 1600/4h | 5.63 | 56.2 | 9450 | +54.5 |
| 1 | 1300/6h | 1625/4h | 5.60 | 48.2 | 8278 | +35.6 |
| 2 | 1300/6h | 1625/4h | 5.75 | 33.8 | 4345 | +21.0 |
CT = Calcination temperature, ST = Sintering temperature, ρap = Apparent density
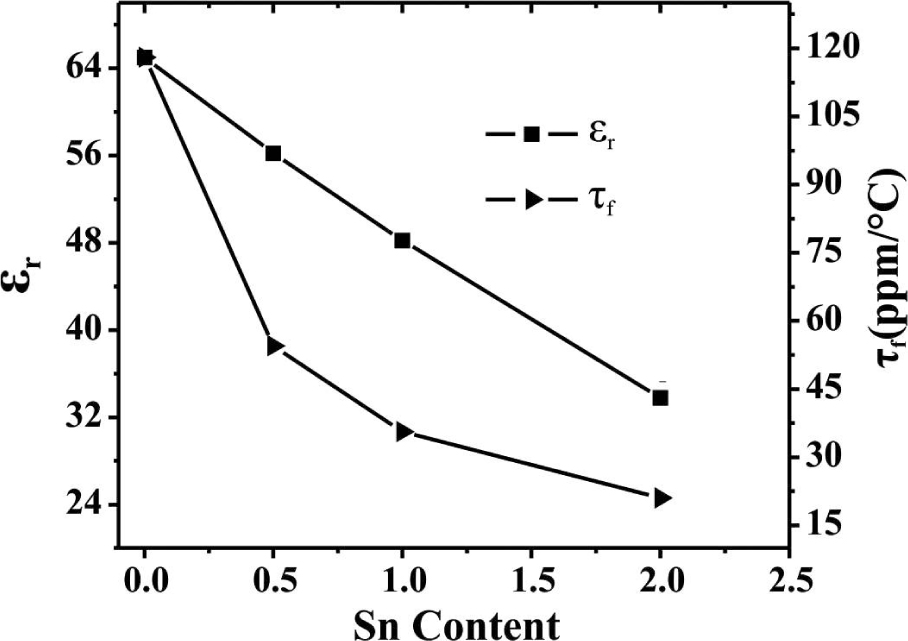
Fig. 4
Variation in εr and τf versus Sn4+ content (x) for SrLa4Ti5−xSnxO17 (0 ≤ x ≤ 2) compositions sintered at their optimum sintering temperatures.
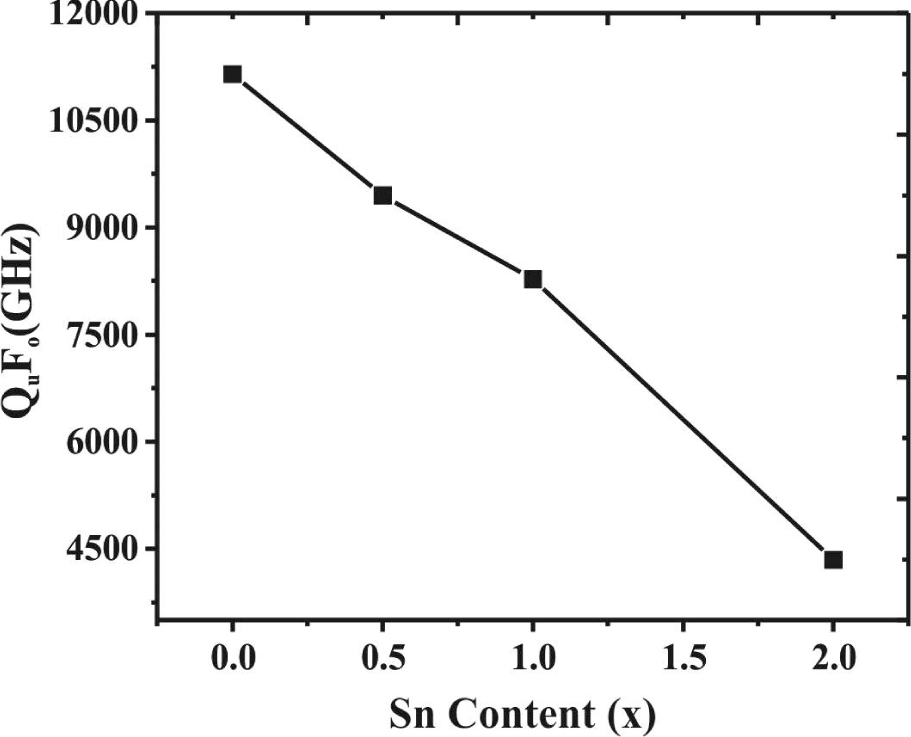
Fig. 5
Variation in Qufo versus Sn4+ content (x) for SrLa4Ti5−xSnxO17 (0 ≤ x ≤ 2) compositions sintered at their optimum sintering temperatures.