
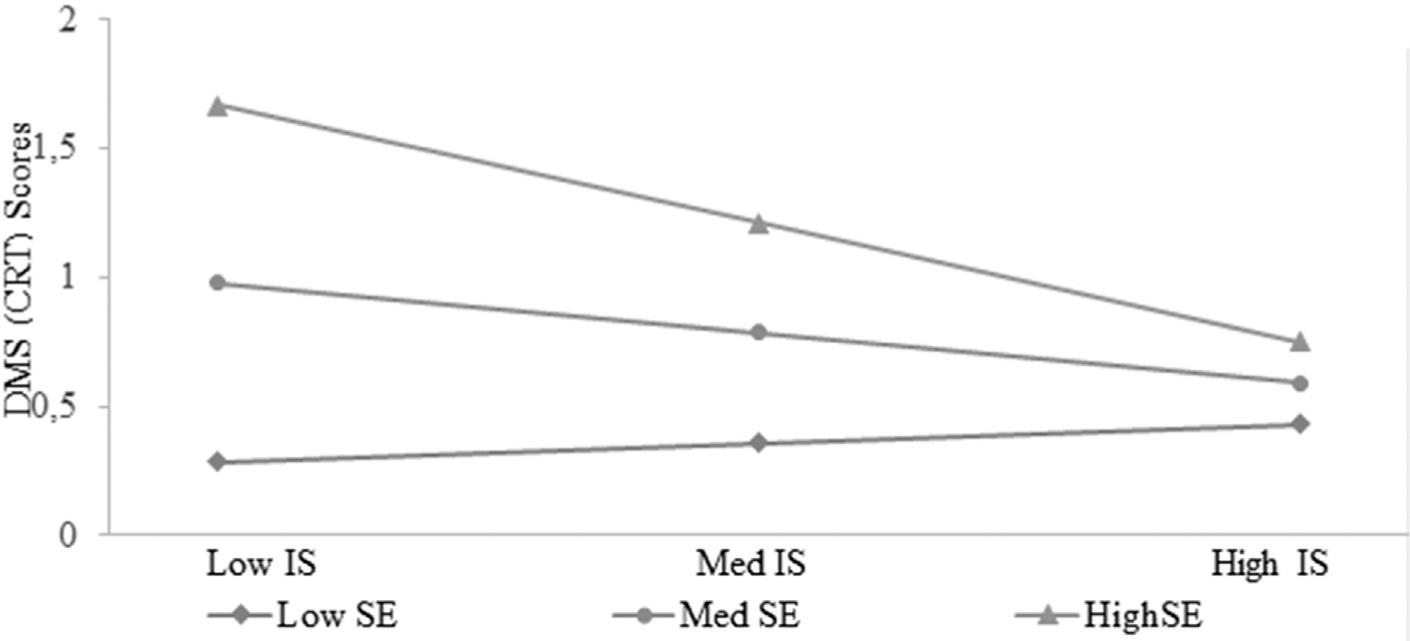
Figure. 1
Descriptive statistics_
| Mean (SD) | Minimum | Maximum | |
|---|---|---|---|
| DMS | 0.74 (0.86) | 0 | 3 |
| GSES | 28.27 (3.28) | 19 | 34 |
| SSE | 103.19 (57.26) | 14 | 252 |
| IS | 0.67 (0.23) | 0.08 | 0.97 |
Pearson’s product–moment correlations_
| 1. CRT | 2. GSES | 3. SSE | 4. IS | |
|---|---|---|---|---|
| 2. | 0.082 | |||
| 3. | 0.482 p < 0.01 (one tailed). | –0.065 | ||
| 4. | –0.155 | –0.107 | 0.171 |
Hierarchical regression analysis_
| Variable | B | SE of B | β | T | R2 | F |
|---|---|---|---|---|---|---|
| Step 1 | 0.29 | 4.91 p < 0.01 (one tailed) | ||||
| SSE | 0.450 | 0.150 | 0.524 | 3.001 p < 0.01 (one tailed) | ||
| IS | –0.210 | 0.150 | –0.245 | –1.403 | ||
| Step 2 | 0.39 | 4.93 p < 0.01 (one tailed) | ||||
| SSE × IS | –0.266 | 0.136 | –0.319 | 1.954 p < 0.05 (one tailed). |