
Figure 1
Figure 2

Figure 3
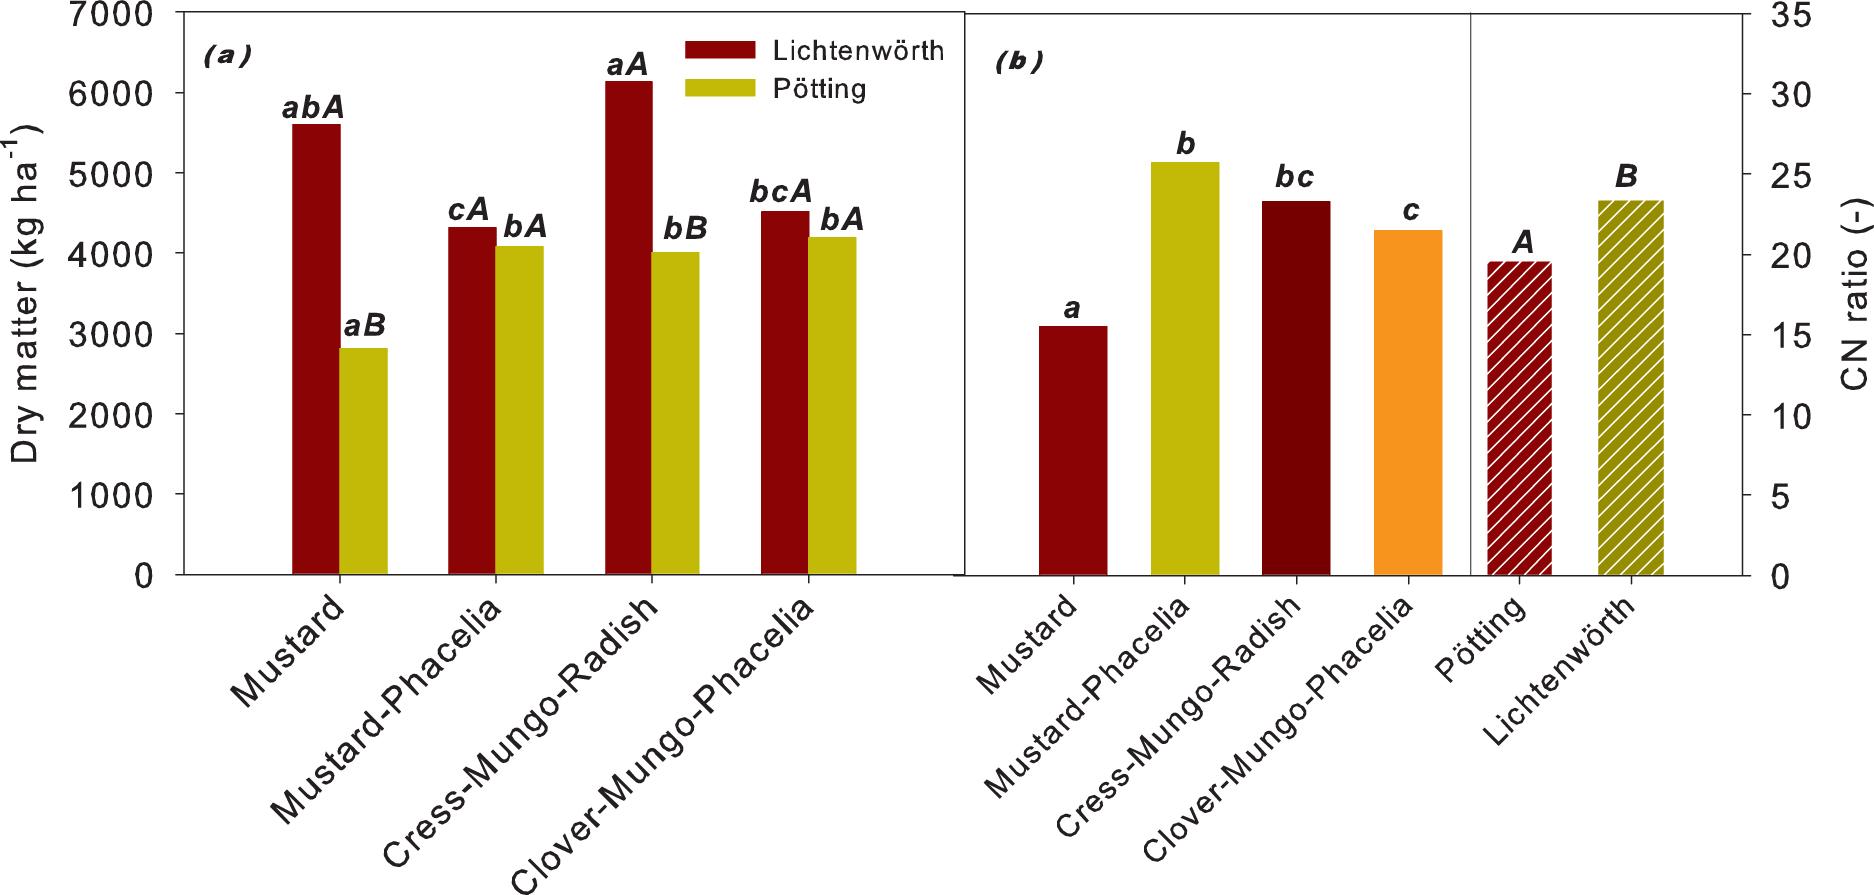
Figure 4
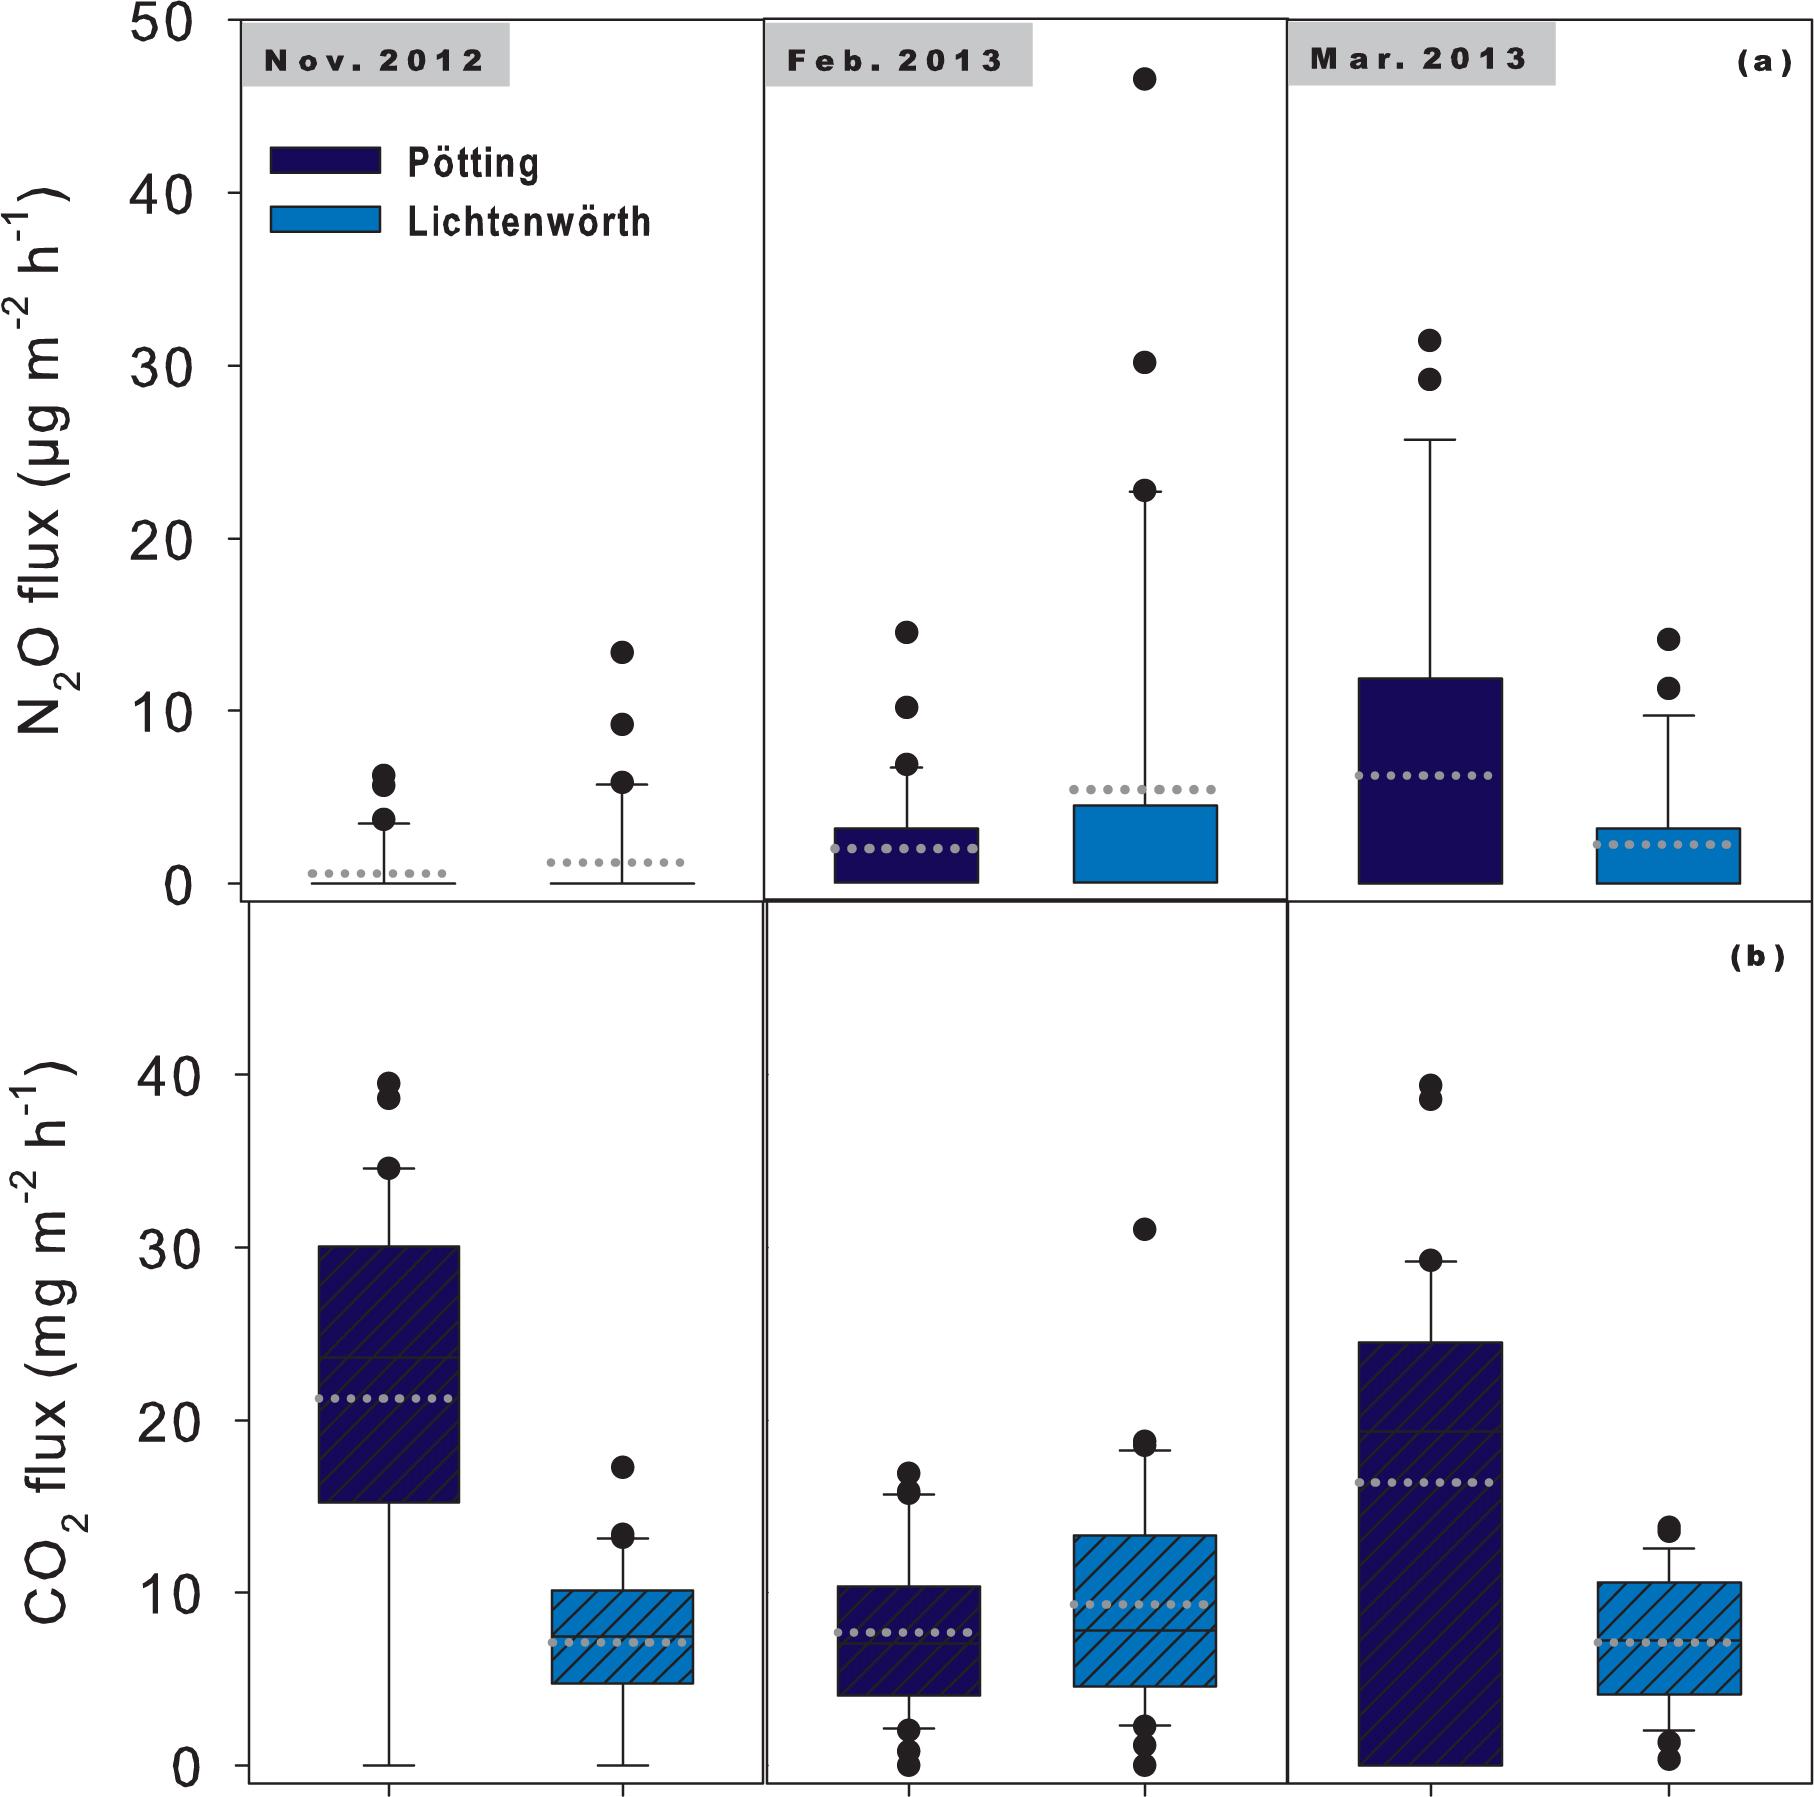
Figure 5
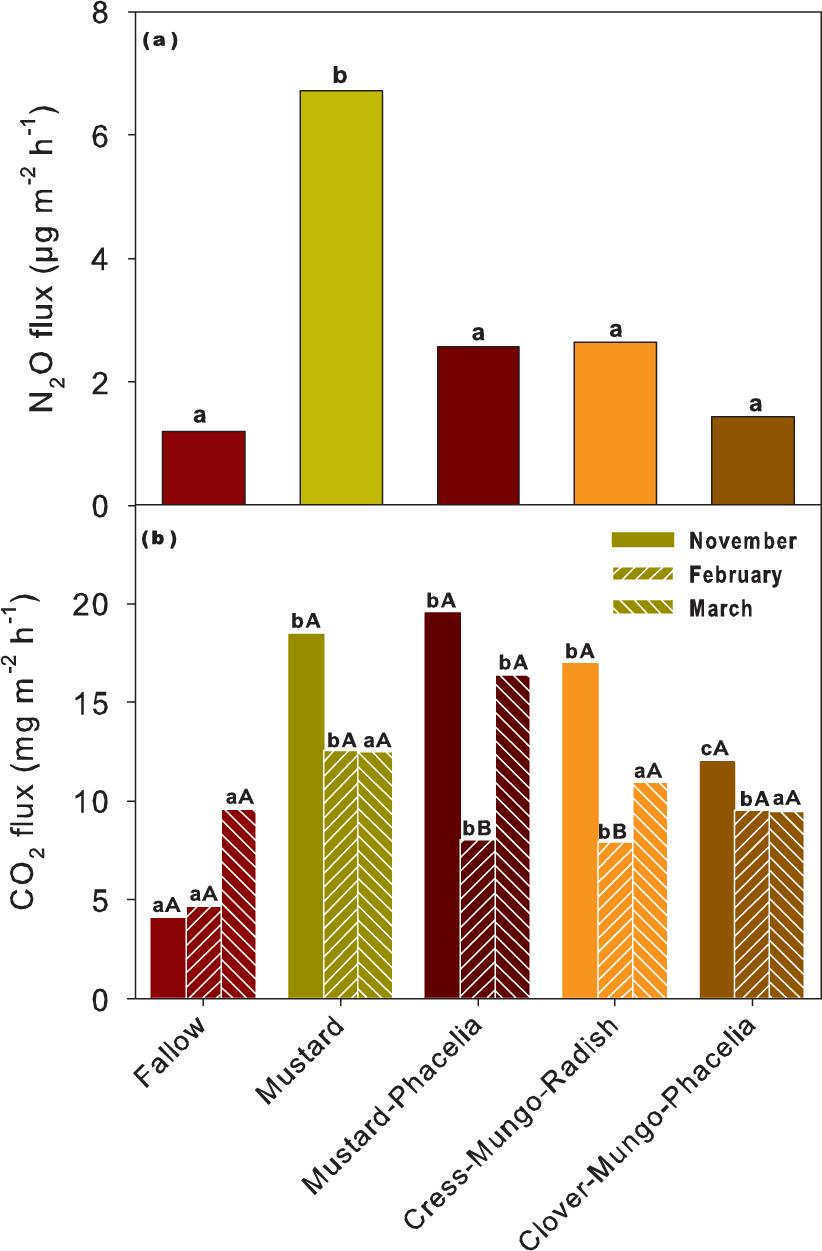
Figure 6
Figure 7

Figure 8
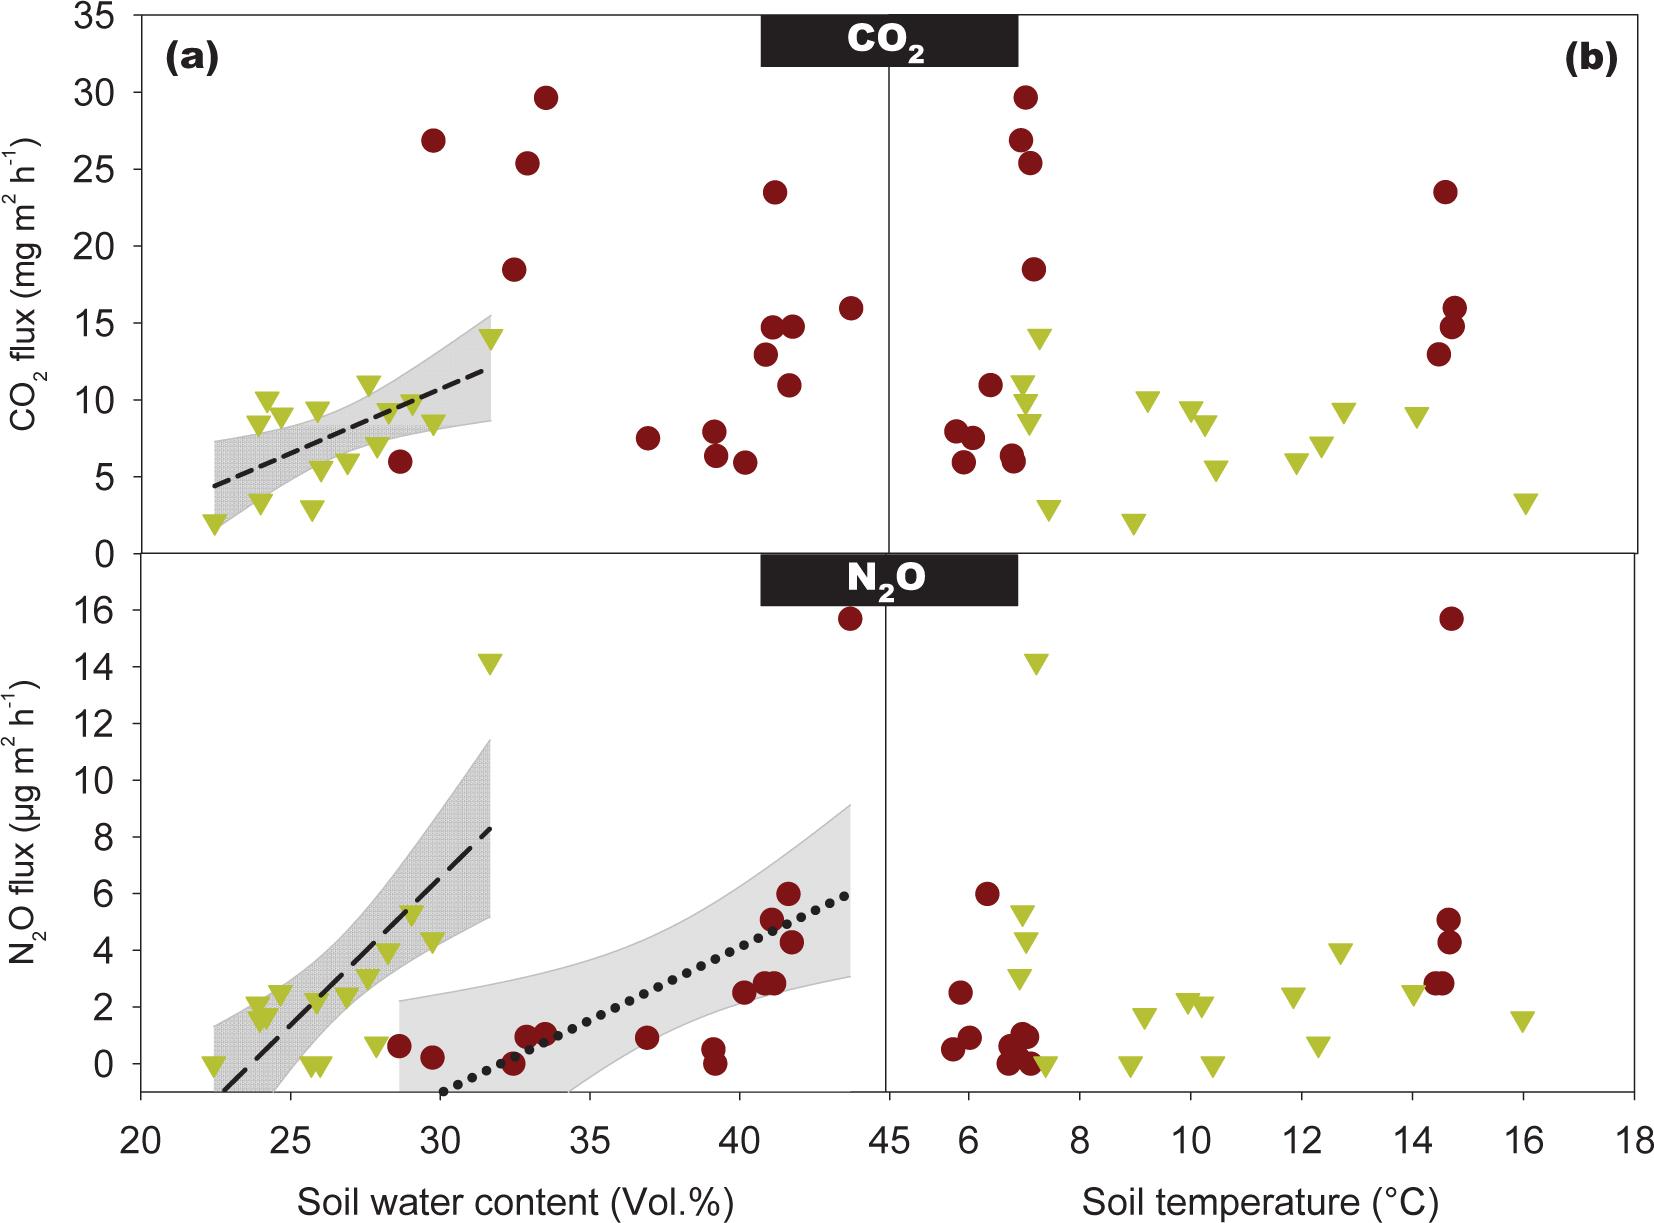
Figure 9
Figure 10
Results of mixed model analysis of variance (F-statistics and p-value of main effects and interactions) for greenhouse gas emissions_ Significant effects (in case of significant interactions, highest order interaction) are marked in bold_Tabelle 2_ Ergebnis der Varianzanalyse (gemischtes Model; F-Werte und p-Werte der Haupteffekte und ihrer Wechselwirkungen) für Treibhausgasemissionen_ Signifikante Effekte (bei signifikanten Interaktionen, die Interaktion höchster Ordnung) sind fett gekennzeichnet_
| Effect Site refers to experimental location, date to measurement date, N is N fertilization treatment, CC is soil cover treatment, Rep is replication. | N2O | CO2 | ||
|---|---|---|---|---|
| F-statistic | p>F | F-statistic | p>F | |
| Site | 0.00 | 0.9866 | 6.18 | 0.0180 |
| Date | 6.46 | 0.0039 | 1.58 | 0.2197 |
| Site × Date | 1.53 | 0.2290 | 9.68 | 0.0004 |
| N | 0.51 | 0.4785 | 0.00 | 0.9503 |
| Site × N | 2.98 | 0.0922 | 1.21 | 0.2782 |
| Date × N | 0.00 | 0.9966 | 3.16 | 0.0553 |
| Site × Date × N | 0.05 | 0.9541 | 1.51 | 0.2345 |
| CC | 3.33 | 0.0195 | 9.17 | <.0001 |
| Site × CC | 0.31 | 0.8716 | 0.25 | 0.9090 |
| Date × CC | 1.81 | 0.0967 | 2.84 | 0.0113 |
| Site × Date × CC | 0.4 | 0.9137 | 0.78 | 0.6188 |
| N × CC | 1.14 | 0.3506 | 1.19 | 0.3325 |
| Site × N × CC | 0.68 | 0.6070 | 0.19 | 0.9397 |
| Date × N × CC | 1.50 | 0.1825 | 1.79 | 0.1018 |
| Site × Date × N × CC | 0.66 | 0.7226 | 0.16 | 0.9954 |
| Rep | 0.29 | 0.7510 | 0.73 | 0.4877 |
| Date × Rep | 1.18 | 0.3311 | 0.88 | 0.4856 |
Regression relations between soil chemical and physical parameters and greenhouse gas emissionsTabelle 3_ Regressionsbeziehungen bodenchemischer und bodenphysikalischer Parameter mit Treibhausgasemissionen
| Site | Factors | Equation | R2 | p-value |
|---|---|---|---|---|
| Pötting | Soil mineral N vs CO2 | y = -4.36 + 0.57x | 0.32 | 0.028 |
| DOC vs N2O | y = -8.82 + 0.37x | 0.41 | 0.046 | |
| Soil water content vs. N2O | y = -16.56 + 0.52x | 0.39 | 0.013 | |
| Lichtenwörth | DOC vs. N2O | y = -5.21 + 0.26x | 0.58 | 0.011 |
| Soil water content vs. CO2 | y = -14.11 + 0.83x | 0.41 | 0.011 | |
| Soil water content vs. N2O | y = -24.63 + 1.04x | 0.56 | 0.001 |
Overview of measured parameters, methods and sampling datesTabelle 1_ Überblick über die gemessenen Parameter, die Methoden und Beprobungstermine
| Parameter | Method | Sampling date Sampling dates at the two sites were ± 2 days. |
|---|---|---|
| Aboveground biomass | Dry matter at 105°C | 14 November 2012 |
| CN ratio | CNS analyzer | - |
| CO2, N2O | Closed chamber method | 22 November 2012, 1 February 2013, 6 March 2013 |
| Soil mineral N | Photometric | 22 November 2012, 1 February 2013, 6 March 2013 |
| DOC DOC was measured from a mixed soil sample of three replicates. | Photometric | 22 November 2012, 1 February 2013, 6 March 2013 |
| Soil water content | Capacitance | 22 November 2012, 1 February 2013, 6 March 2013 |
| Soil temperature | Thermistor | 22 November 2012, 1 February 2013, 6 March 2013 |