
Table 1
Phylogenetic classification of the ITS/18S rDNA coding sequences of the fungal isolates
Tabelle 1. Phylogenetische Klassifikation der ITS/18S rDNA kodierenden Sequenzen der Pilzisolate
| No | Primer Pair | Closest identified phylogenetic relatives [EMBL accession numbers] | Query cover | Ident | ACBR strain No | accession No |
|---|---|---|---|---|---|---|
| α 14 | NL1/NL4 | Doratomyces purpureofuscus (Cephalotrichum purpureofuscum) genomic DNA sequence contains 28S rRNA gene, strain UAMH 9209 [LN851018.1] | 99% | 99% | MA6020 | KY454753 |
| O | NS5/NS8 | Roussoella intermedia strain CBS 170.96 18S ribosomal RNA gene, partial sequence [KF443390.1] | 99% | 100% | MA6025 | KY454758 |
| Y | NL1/NL4 | Purpureocillium sp. JCM 28545 gene for 28S ribosomal RNA, partial sequence [LC134235.1] | 100% | 99% | MA6015 | KY454754 |
| BL 3 | NL1/NL4 | Ochroconis longiphorum strain CBS 435.76 28S ribosomal RNA gene, partial sequence [KF156135.1] | 96% | 99% | MA6021 | KY454755 |
| BL 4 | NL1/NL4 | Ochroconis longiphorum strain CBS 435.76 28S ribosomal RNA gene, partial sequence [KF156135.1] | 99% | 99% | MA6017 | KY454756 |
| V | ITS1/ITS4 | Penicillium janthinellum [EF634422.1] | 100% | 99% | MA6016 | KY454760 |
| Z | ITS1/ITS4 | Pyrenochaeta inflorescentiae [EU552153.1] | 97% | 98% | MA6019 | KY454761 |
| H | ITS1/ITS4 | Penicillium canescens [AY373901.1] | 100% | 99% | MA6018 | KY454762 |
| NL1/NL4 | Pyrenochaeta inflorescentiae culture-collection CBS:119222 18S ribosomal RNA gene, partial sequence; internal transcribed spacer 1, 5.8S ribosomal RNA gene, and internal transcribed spacer 2, complete sequence; and 28S ribosomal RNA gene, partial sequence | 99% | 99% | KY454757 | ||
| U | [EU552153.1] | MA6024 | ||||
| NS5/NS8 | Pyrenochaeta sp. GMG_PPb7 18S ribosomal RNA gene, partial sequence; internal transcribed spacer 1, 5.8S ribosomal RNA gene, and internal transcribed spacer 2, complete sequence; and 28S ribosomal RNA gene, partial sequence [FJ439593.2] | 99% | 99% | KY454759 | ||
| X1 | ITS1/ITS4 | Purpureocillium lilacinum | 99% | 100% | MA6022 | KY454763 |
| G | ITS1/ITS4 | Penicillium canescens [AF033493.1] | 99% | 99% | MA6023 | KY454764 |
Table 2
GC Results: Measured US EPA PAH concentrations and standard deviations of the 12 soil samples (S1-12). Values are presented as mg/kg dry weight and standard deviations were calculated (mg/kg dryweight±standard deviation)
Tabelle 2. GC-Ergebnisse: Gemessene US EPA PAK-Konzentrationen und Standardabweichungen der 12 Bodenproben (S1-12) sind in der Tabelle dargestellt. Die Werte sind also mg/kg Trockengeweicht dargestellt und die Standardabweichung wurde berechnet (mg/kg Trockengewicht±Standardabbweichung)
| sample | S1 | S2 | S3 | S4 | S5 | S6 | S7 | S8 | S9 | S10 | S11 | S12 |
|---|---|---|---|---|---|---|---|---|---|---|---|---|
| Naphtalene | 5.8±1.2 | 4.8±1.0 | 12.8±2.6 | 9.4±1.9 | 6.8±1.4 | 31.5±6.3 | 0.1±0.02 | <0.3(0.0) | <0.3 (0.0) | 0.1±0.01 | <0.3(0.0) | <0.3(0.0) |
| Acenaphthylene | 5.8±1.2 | 1.8±0.4 | <2.7(0.00) | 0.9±0.2 | 0.9±0.2 | 5.2±1.0 | 0.1±0.02 | <0.3(0.0) | 0.4±0.1 | 0.2±0.03 | 0.7±0.1 | 0.3±0.1 |
| Acenatphene | 6.9±1.4 | 4.3±0.9 | 11.2±2.2 | 8.5±1.7 | 6.8±1.4 | 24.9±5.0 | 0.6±0.1 | 0.4±0.1 | 0.4±0.1 | 0.1±0.02 | <0.3 (0.0) | 0.3±0.1 |
| Flurene | 10.1±2.0 | 6.3±1.3 | 14.8±3.0 | 10.3±2.1 | 8.3±1.7 | 34.3±6.9 | 0.5±0.1 | 0.4±0.1 | 0.4±0.1 | 0.1±0.02 | 0.5±0.1 | 0.6±0.1 |
| Phenanthrene | 55.20±11.0 | 28.3±5.7 | 70.2±14.0 | 48.3±9.7 | 36.5±7.3 | 154.0±31.0 | 5.9±1.2 | 4.4±0.9 | 4.1±0.8 | 1.0±0.2 | 6.4±1.3 | 5.7±1.2 |
| Anthracene | 22.5±4.5 | 11.4±2.3 | 22.2±4.4 | 18.1±3.6 | 14.4±2.9 | 67.7±13.5 | 1.4±0.3 | 1.2±0.2 | 1.6±20.3 | 0.4±0.01 | 2.1±0.4 | 1.4±0.3 |
| Fluoranthene | 78.0±15.6 | 29.1±5.8 | 48.2±9.6 | 39.0±7.8 | 30.8±6.2 | 141.0±28.0 | 7.5±1.5 | 12.6±2.5 | 10.0±2.0 | 2.9±0.6 | 17.5±3.5 | 9.8±2.0 |
| Pyrene | 77.8±15.6 | 30.4±6.1 | 47.9±9.6 | 41.6±8.3 | 32.2±6.4 | 108.0±22.0 | 7.5±1.5 | 24.4±4.9 | 10.0±2.0 | 2.3±0.5 | 14.5±2.9 | 7.7±2.0 |
| Benz[a]anthracene | 36.5±7.3 | 13.5±2.7 | 19.9±4.0 | 16.6±3.3 | 13.0±2.6 | 64.3±12.9 | 4.7±1.0 | 23.5±4.7 | 9.8±2.0 | 1.9±0.4 | 9.8±2.0 | 5.9±1.2 |
| Chrysene | 37.4±7.5 | 13.3±2.7 | 20.7±4.1 | 15.8±3.2 | 12.5±2.5 | 68.6±13.7 | 5.9±1.2 | 27.3±5.5 | 11.0±2.2 | 2.2±0.4 | 10.2±2.0 | 7.1±1.4 |
| Benzo(b) fluoranthene | 33.0±6.6 | 10.4±2.1 | 14.4±2.9 | 10.9±2.2 | 9.0±1.8 | 36.1±7.2 | 6.5±1.3 | 28.1±5.6 | 11.9±2.4 | 1.9±0.4 | 9.1±1.8 | 7.1±1.4 |
| Benzo(k) fluoranthene | 26.6±5.3 | 9.5±1.9 | 12.7±2.5 | 10.6±2.1 | 8.5±1.7 | 45.3±9.1 | 4.2±0.8 | 33.0±6.6 | 10.4±2.1 | 1.7±0.3 | 8.0±1.6 | 5.0±1.0 |
| Benzo(a)pyrene | 30.6±6.1 | 10.9±2.2 | 14.3±2.9 | 11.9±2.4 | 9.76±2.0 | 44.7±8.9 | 5.0±1.0 | 27.1±5.4 | 9.8±2.0 | 1.8±0.4 | 8.5±1.7 | 5.1±1.0 |
| Indeno(1,2,3-cd)pyrene | 21.3±4.3 | 7.0±1.4 | 8.5±1.7 | 8.3±1.7 | 6.0±1.2 | 20.1±4.0 | 3.1±0.6 | 19.6±3.9 | 8.2±1.6 | 1.7±0.3 | 5.2±1.0 | 2.8±0.6 |
| Dibenzo(a,h) anthracene | 5.9±1.2 | 1.7±0.4 | <2.7(0.0) | 1.6±0.3 | 1.3±0.3 | 4.8±1.0 | 1.1±0.2 | 5.5±1.1 | 2.0±0.4 | 0.5±0.1 | 1.2±0.2 | 0.7±0.1 |
| Benzo(g,hi,i) perylene | 19.6+3.9 | 6.5±1.3 | 7.8±1.6 | 6.4±1.3 | 5.2±1.1 | 17.2±3.4 | 3.4±0.7 | 22.7±4.5 | 7.2±1.5 | 1.8±0.4 | 4.2±0.8 | 2.7±0.5 |
| sum | 472.9±94.6 | 189.4±38.0 | 325.6±65.1 | 258.1±51.7 | 202.0±40.4 | 867.8±173.9 | 57.4±11.5 | 230.2±46.0 | 97.2±39.5 | 20.6±4.0 | 97.6±19.4 | 62.2±12.9 |
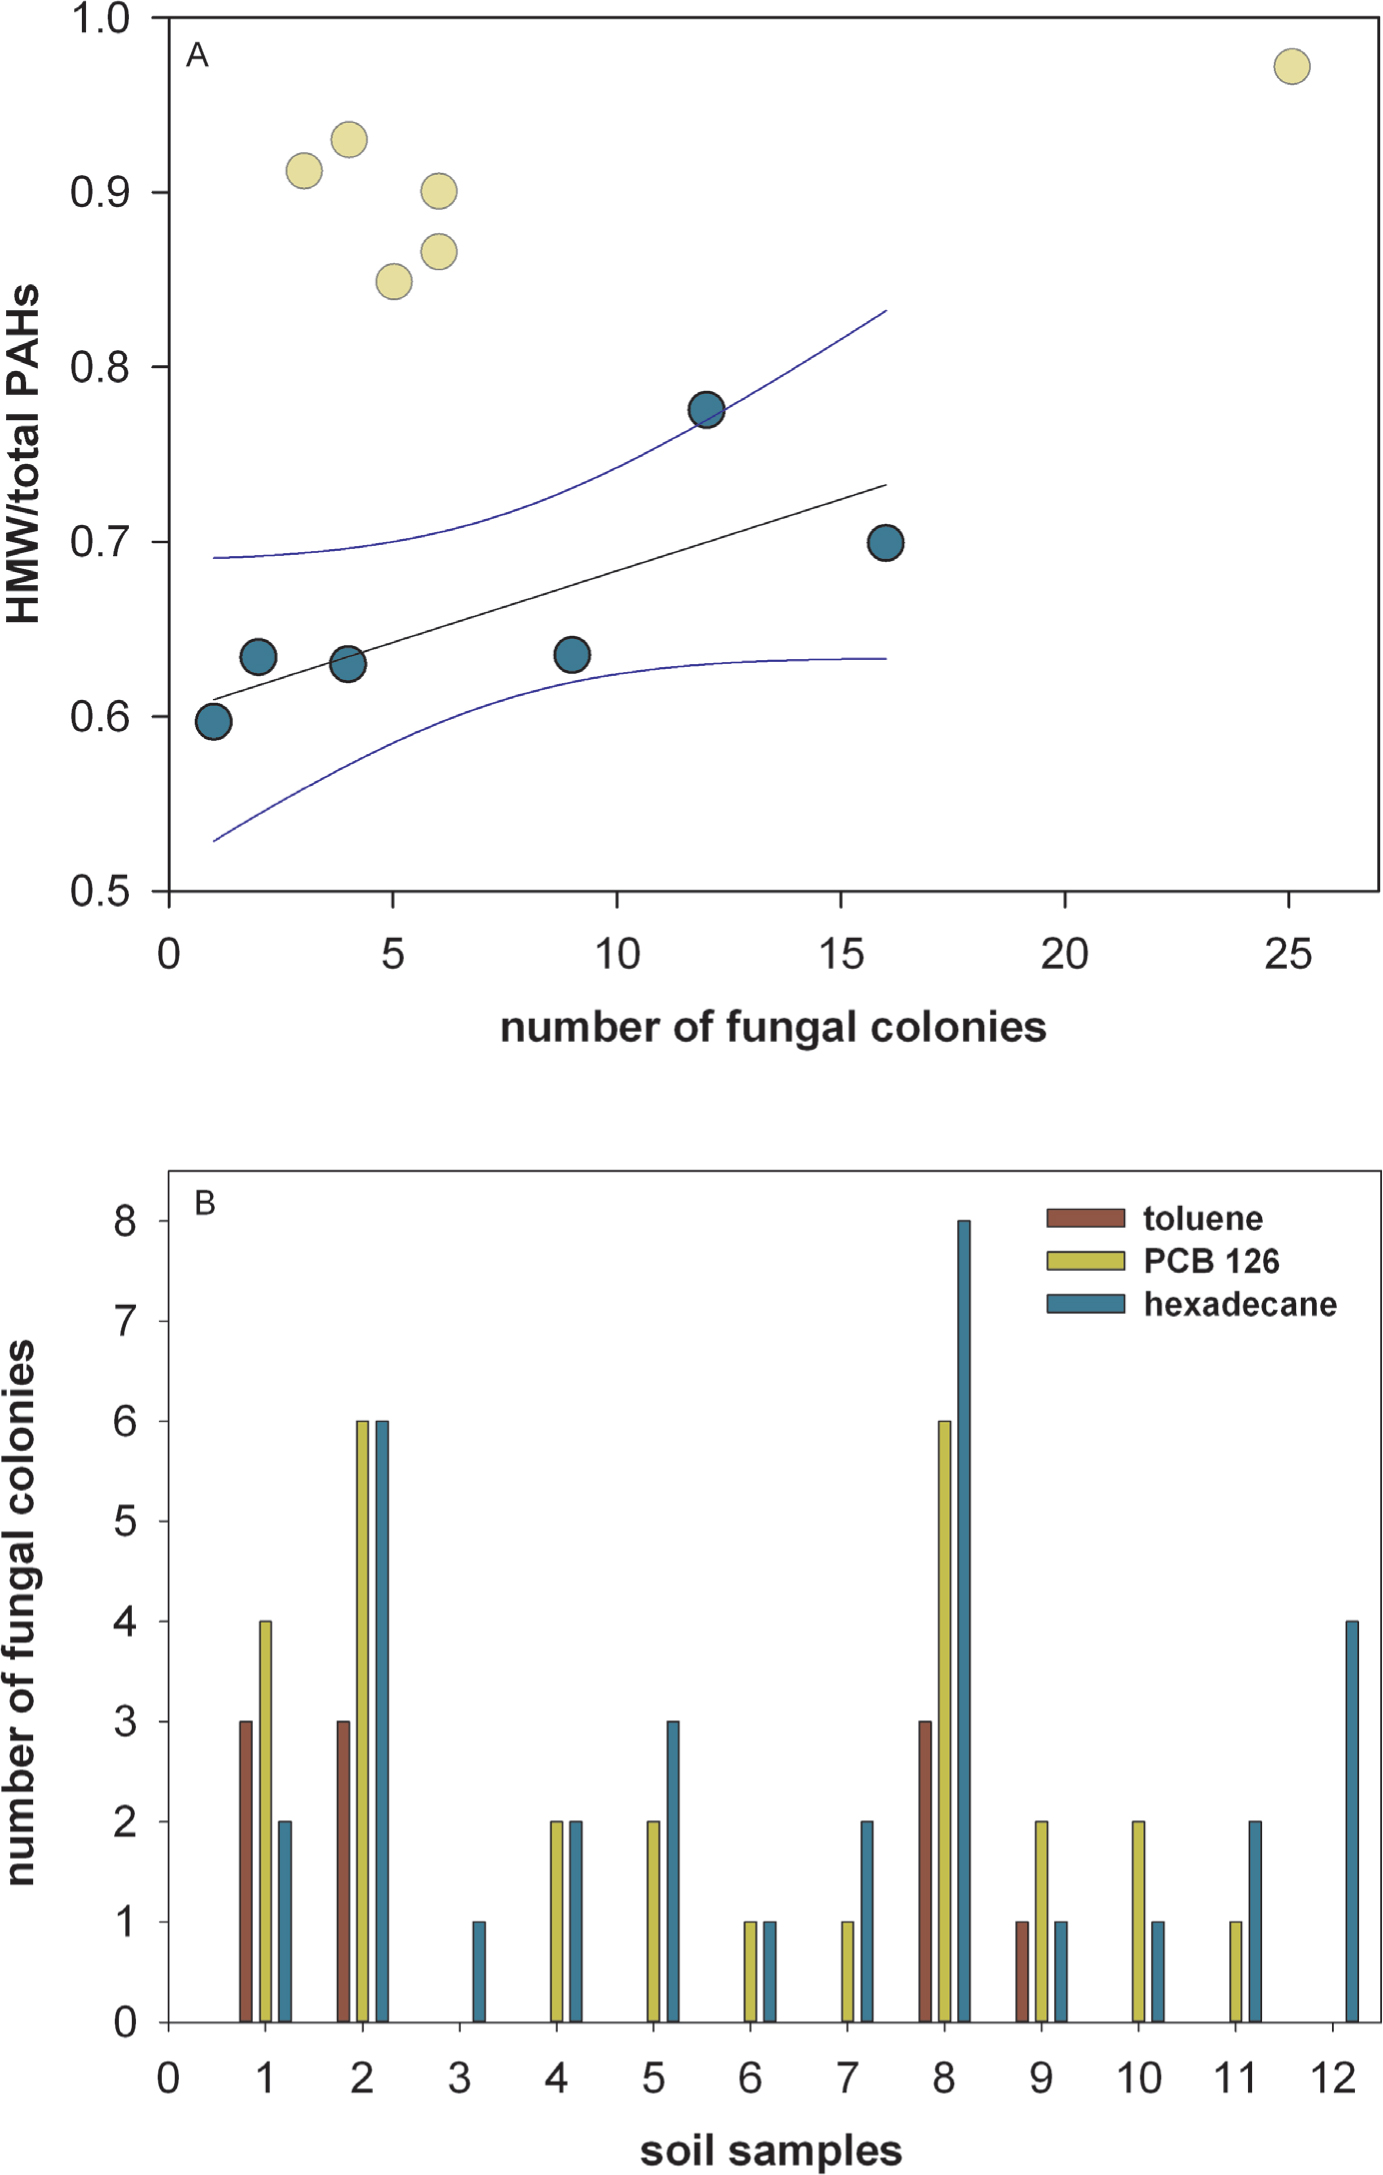
Figure 1
Regression model of PAH ratio against fungal colonies and fungal colonies isolated from each sample. A: Ratio of high molecular weight (HMW) PAHs to total PAHs on the y-axis against the total number of fungal colonies (x-axis) was plotted. A linear regression was done (black line) using the samples with low HMW/total PAH ratio (blue dots) with a confidence interval of 95% (blue line). The excluded samples with high HMW/total PAH ratio (indicating high age) was colored in green and excluded from the linear regression. B: Number of fungal colonies isolated from each sample grown on toluene (red), PCB 126 (green) and hexadecane (blue).
Abbildung 1. Regressionsmodell des PAK-Verhältnisses gegen die Anzahl der Pilzkolonien und der Gesamtanzahl der Pilzkolonien isoliert von den verschiedenen Proben. A: Verhältnis der hochmolekulargewichtigen (HMW) PAKs gegen die Gesamtanzahl der PAKs auf der y-Achse geplottet gegen die Gesamtanzahl der isolierten Pilzkolonien auf der x-Achse. Eine lineare Regressionsgerade wurde geplottet (schwarze Linie) mit Proben mit niedrigem HMW/total PAK Verhältnis (blau, runde Symbole) und ein Konfidenzintervall von 95 % berechnet (blaue Linie). Proben mit hohem HMW/total PAK-Verhältnisses wurden nicht in die lineare Regression genommen (grüne Punkte). B: Anzahl der Pilzkolonien isoliert von jeder Probe, welche in Anwesenheit von Toluol (rot), PCB 126 (grün) und Hexadekan (blau) gewachsen sind.
Table 3
Results of the second microtiter plate screening: Number of colonies of having the same growth pattern of all 93 fungal isolates on toluene, hexadecane and PCB 126. + = good growth, ~ = very slow growth and - = no growth. Hex = hexadecane, Tol = toluene, PCB = PCB 126
Tabelle 3. Ergebnisse des zweiten Mikrotiterplatten-Screenings: Anzahl der Kolonien mit demselben Wachstumsmuster innerhalb der 93 isolierten Kolonien in Gegenwart von Toluol, Hexadekan und PCB 126. + = gutes Wachstum, ~ = sehr langsames Wachstum und - = kein Wachstum. Hex = Hexadekan Tol = Toluol, PCB = PCB 126
| colony numbers | Hex | Tol | PCB |
|---|---|---|---|
| 21 | + | + | - |
| 14 | + | + | ~ |
| 9 | + | + | + |
| 8 | + | - | - |
| 6 | + | ~ | ~ |
| 5 | + | - | ~ |
| 4 | - | - | - |
| 3 | ~ | + | - |
| 3 | + | ~ | - |
| 2 | - | + | - |
| 2 | ~ | - | - |
| 2 | ~ | - | ~ |
| 2 | ~ | ~ | ~ |
| 2 | ~ | + | ~ |
| 2 | + | ~ | + |
| 2 | ~ | ~ | + |
| 1 | - | ~ | - |
| 1 | - | - | ~ |
| 1 | - | ~ | ~ |
| 1 | ~ | ~ | - |
| 1 | - | ~ | + |
| 1 | ~ | ~ | ~ |
Table 4
Growth pattern of the chosen fungal isolates for sequencing: + = good growth, ~ = very slow growth and - = no growth. Hex = hexadecane, Tol = toluene, PCB = PCB 126
Tabelle 4. Wachstumsmuster der zum Sequenzieren ausgewählten Pilzisolate: + = gutes Wachstum, ~ = sehr langsames Wachstum und - = kein Wachstum. Hex = Hexadekan Tol = Toluol, PCB = PCB 126
| No | Hex | Tol | PCB |
|---|---|---|---|
| α 14 | + | + | ~ |
| O | + | + | - |
| U | + | + | + |
| V | + | + | - |
| X 1 | + | + | - |
| Y | + | + | - |
| Z | + | + | ~ |
| BL 3 | + | + | + |
| BL 4 | ~ | + | ~ |
| G | + | - | ~ |
| H | + | - | ~ |
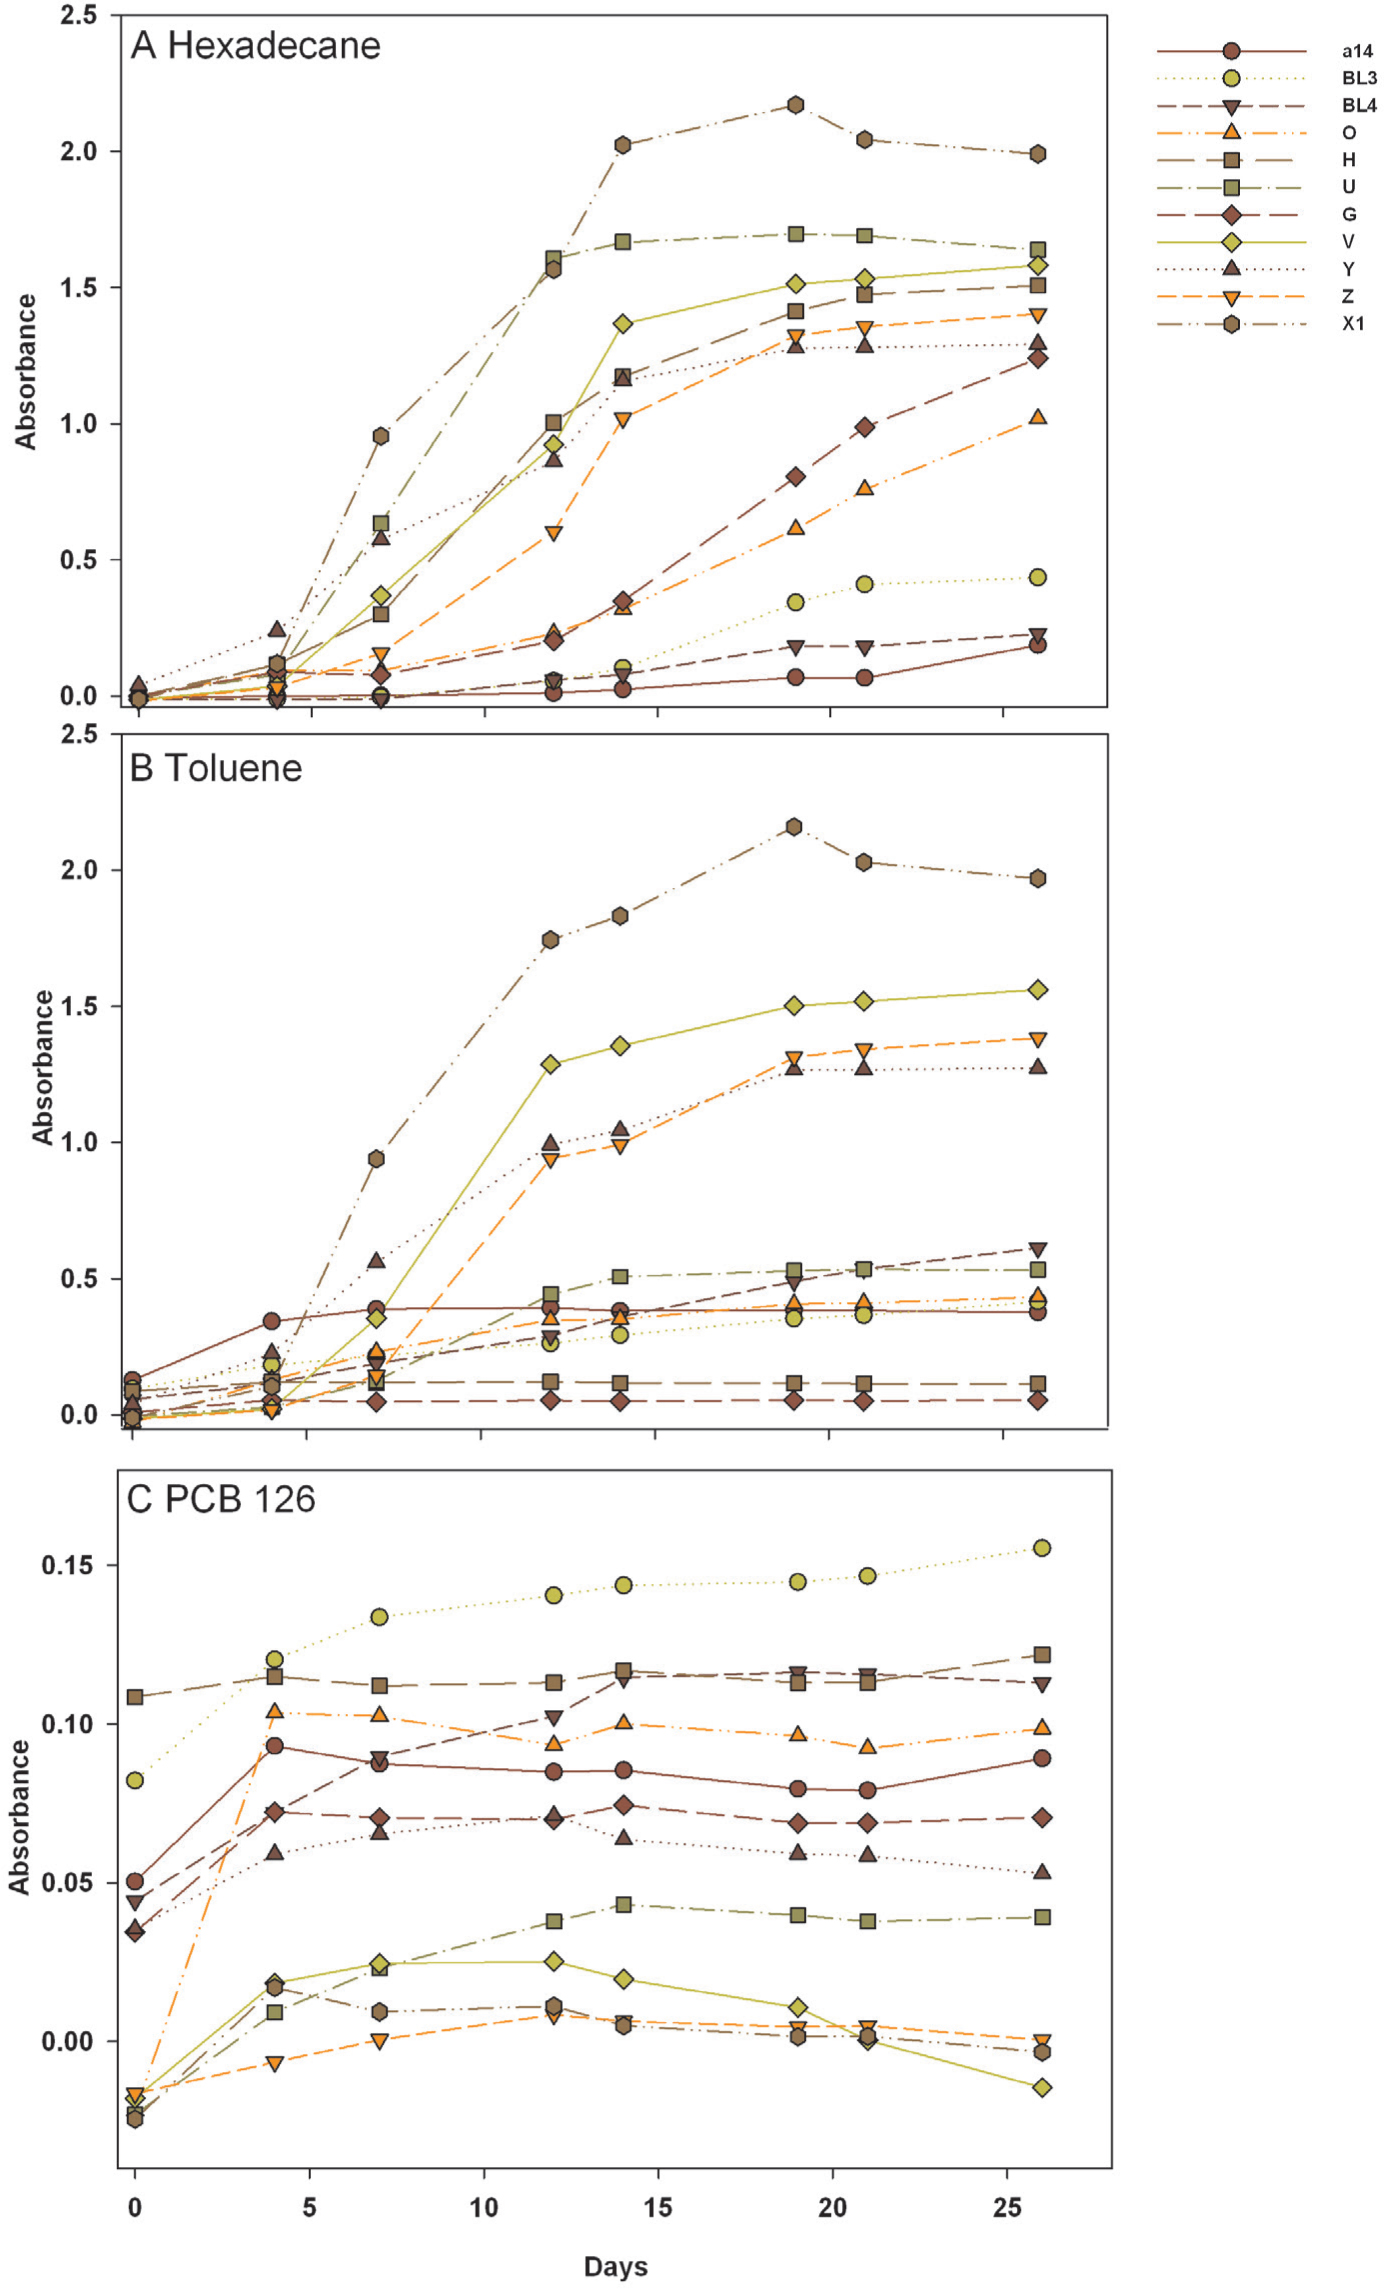
Figure 2
Fungal growth curves. Growth curves of the 11 selected fungal strains for identification grown in the presence of A hexadecane, B toluene and C PCB 126. Growth was measured through detected changes in the OD 700 using a Tecan reader.
Abbildung 2. Wachstumskurven der Pilzstämme. Wachstumskurven der 11 identifizierten Pilzstämme, die in Gegenwart von A Hexadekan, B Toluol und C PCB 126 gewachsen sind. Das Wachstum wurde durch Änderung der OD 700 mit Hilfe eines Tecan Readers detektiert.
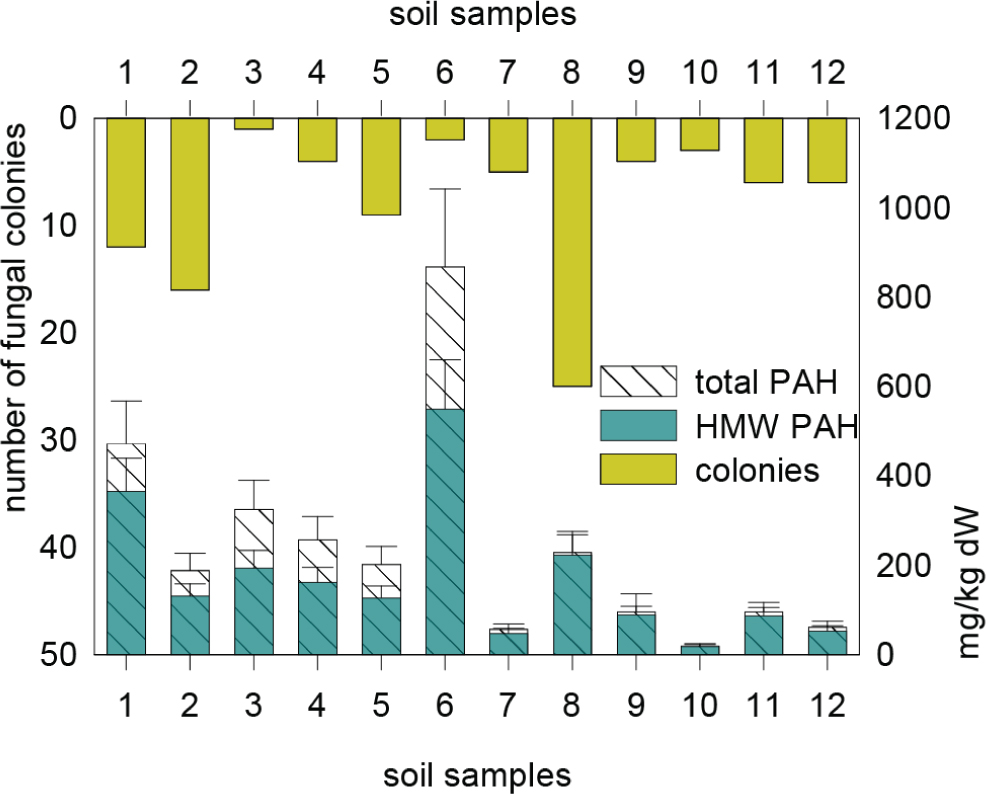
Figure 3
PAH concentrations and number of fungal colonies isolated from each sample. Top, left axis (green): Total sum of colonies isolated in the presence of toluene, PCB 126 or hexadecane, and wells containing glucose. Bottom, right axis: total concentration (pattern) and proportion of HMW PAHs (blue). X-axis presents the different samples.
Abbildung 3. PAK-Konzentrationen und die Anzahl der von jeder Probe isolierten Pilzkolonien. Obere, linke Achse: grün: Gesamtanzahl der Kolonien isoliert in Anwesenheit von Toluol, PCB 126 oder Hexadecan als einzige Kohlenstoffquelle und Näpfchen mit Glukose. Untere, rechte Achse: Gesamtkonzentration (Muster) und Proportion an hochmolekulargewichtigen PAKs (blau). Die x-Achse zeigt die verschiedenen Proben.