
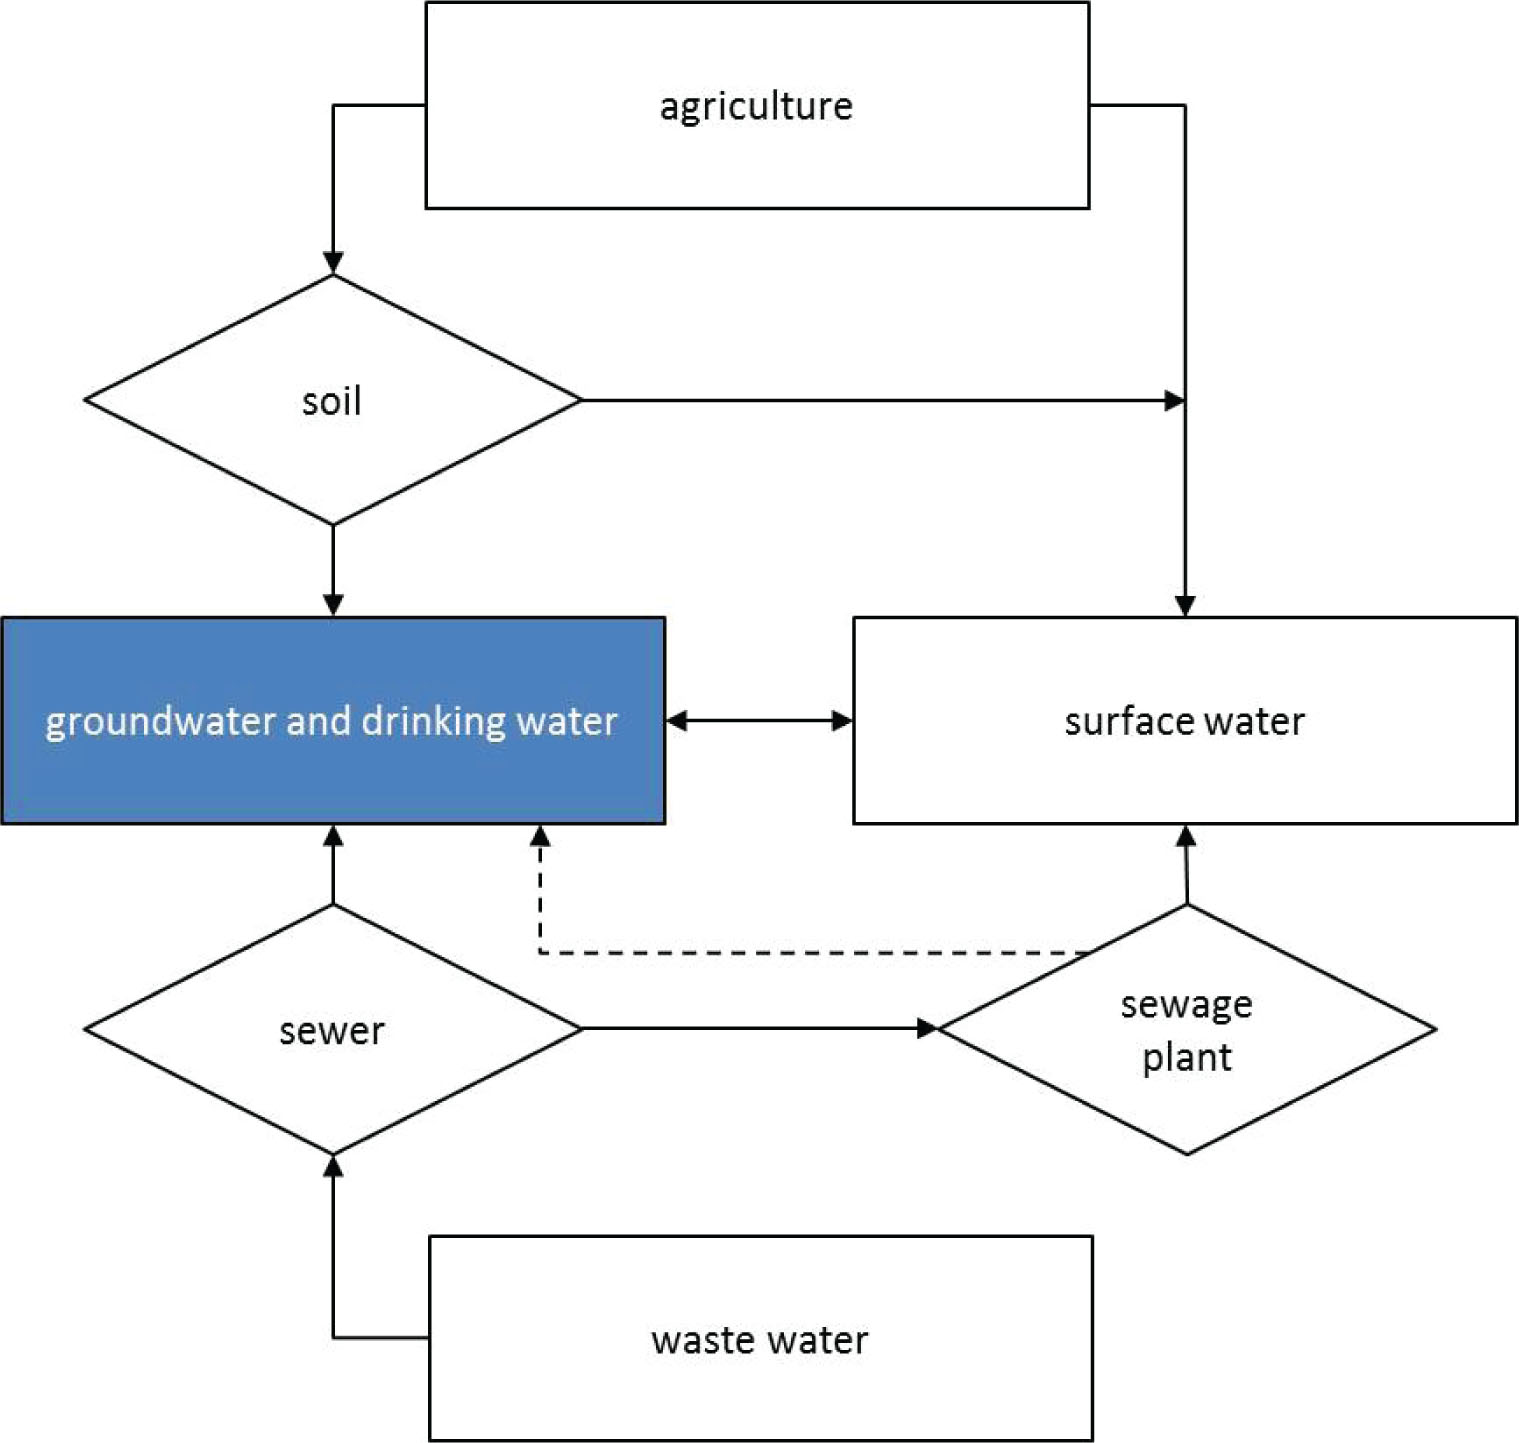
Figure 1
Pathways of pharmaceuticals in groundwater and drinking water
Abbildung 1. Einbringungswege von Arzneistoffen in Grund- und Trinkwasser
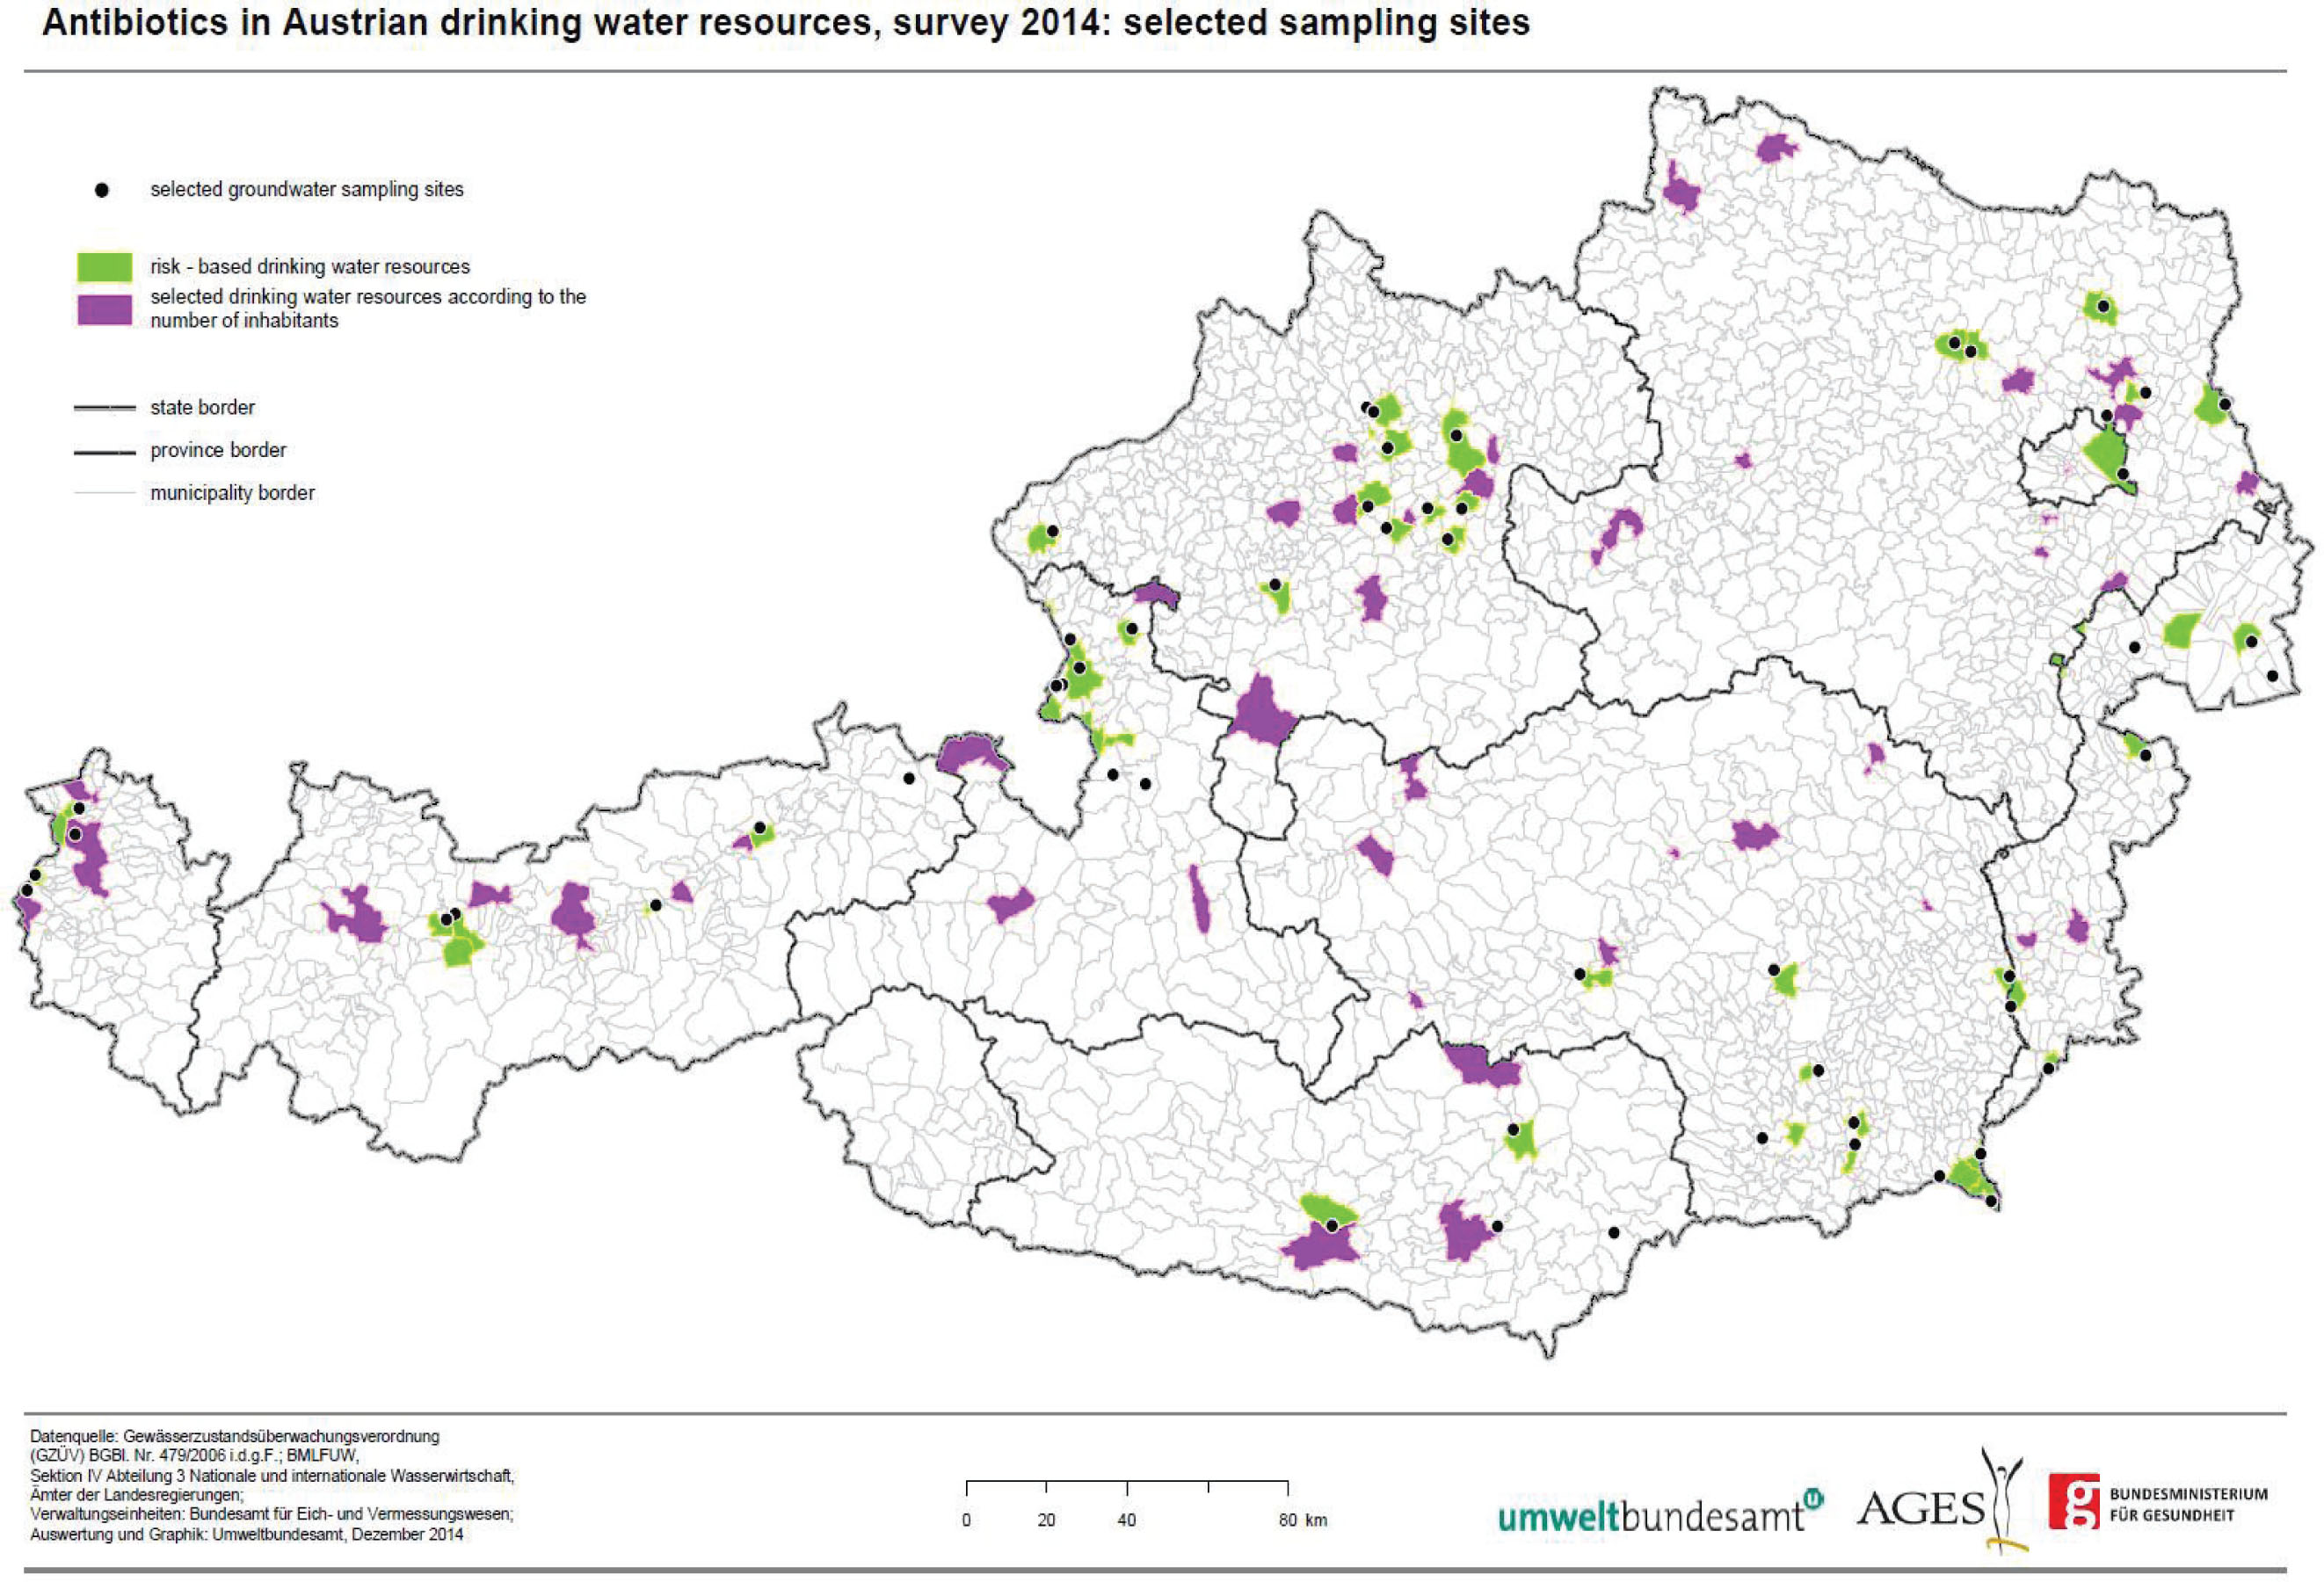
Figure 2
Antibiotics in Austrian drinking water resources, survey 2014: selected sampling sites
Abbildung 2. Antibiotika in österreichischen Trinkwasserressourcen, Monitoring 2014: Probenziehungsorte
Table 1
Samples according to site (state) and selection criterion (based on risk versus population distribution)
Tabelle 1. Probenanzahl nach Bundesland und Auswahlkriterium der jeweiligen Messstelle (risikobasiert versus Berücksichtigung gemäß regionaler Bevölkerungsverteilung) Samples from sites chosen according Samples from sites chosen according
| State | Samples from sites chosen according to population distribution | Samples from sites chosen according to the risk of contamination |
|---|---|---|
| Burgenland | 5 | 11 |
| Carinthia | 7 | 5 |
| Lower Austria | 24 | 10 |
| Upper Austria | 20 | 23 |
| Salzburg | 8 | 14 |
| Styria | 16 | 20 |
| Tyrol | 10 | 7 |
| Vorarlberg | 6 | 8 |
| Vienna | 4 | 2 |
| Total | 100 | 100 |
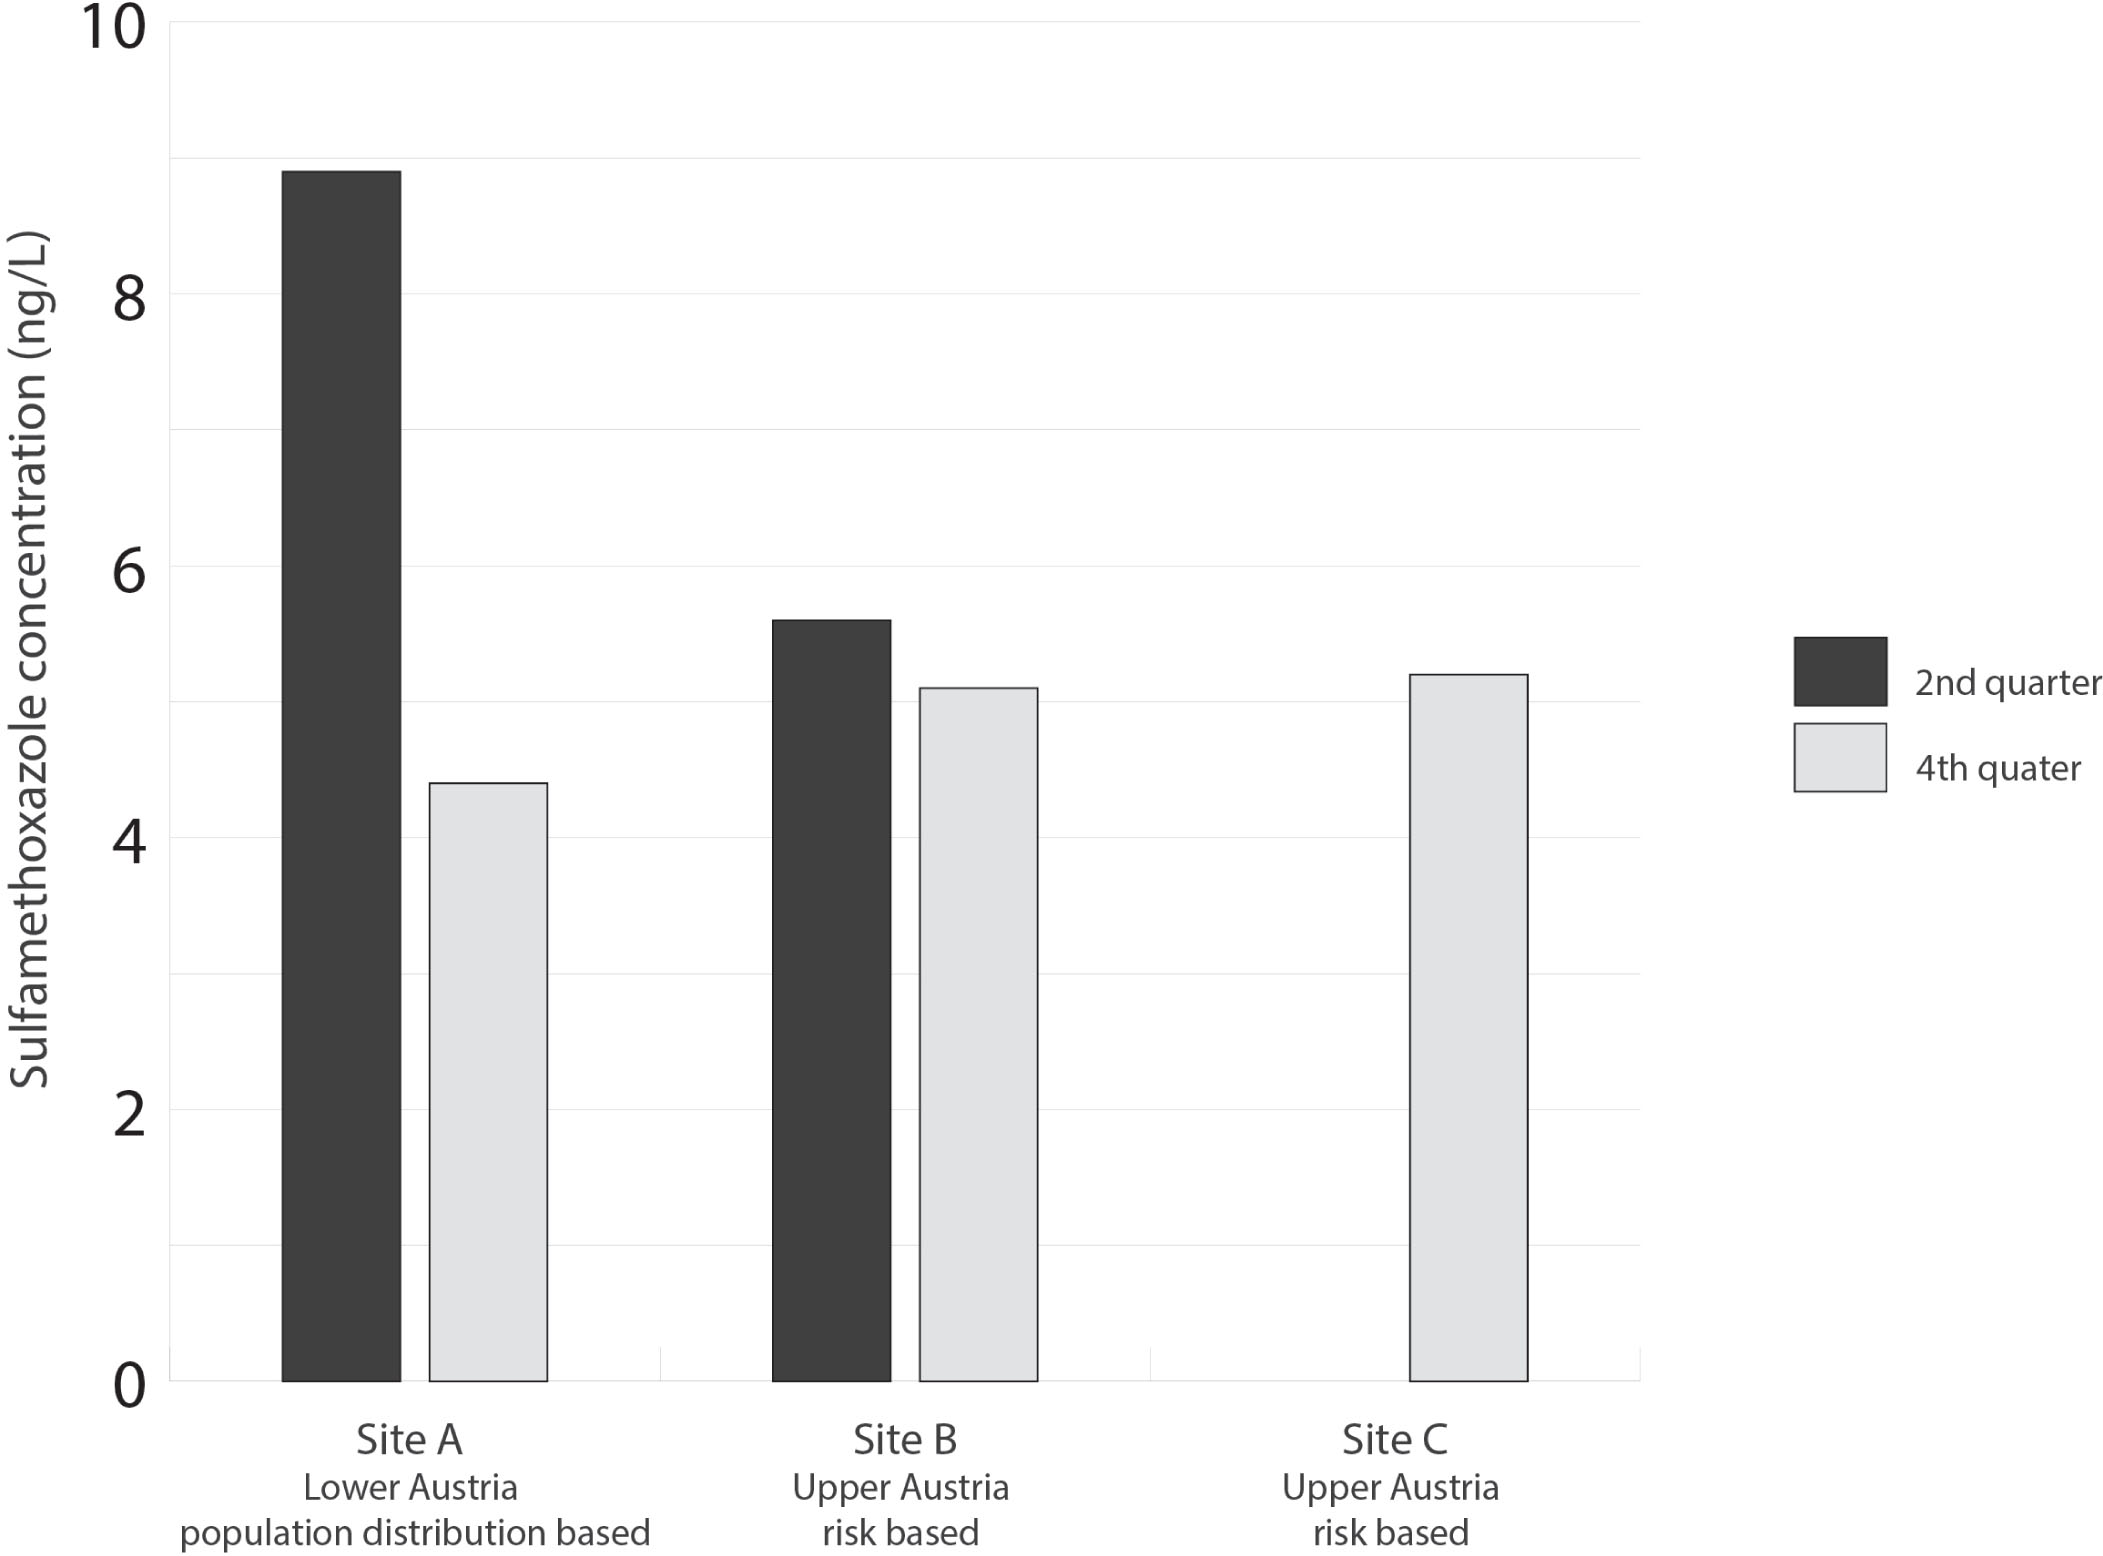
Figure 3
Occurrence of sulfamethoxazole in drinking water resources in concentrations above the limit of quantification (>2.5 ng/l) in 5 of 200 samples.
Abbildung 3. Vorkommen von Sulfamethoxazol in Trinkwasserressourcen in Konzentrationen über der Bestimmungsgrenze von 2,5 ng/L in 5 von 200Proben.