
Table 1
The top 10 up-regulated genes and top 10 down-regulated genes.
| Genes | Log2 FC | Corrected p Value | Gene Title |
|---|---|---|---|
| Up-regulated | |||
| SSBP2 | 2.04 | 1.43E-10 | single-stranded DNA binding protein 2 |
| CDH10 | 2.68 | 1.43E-10 | cadherin 10, type 2 (T2-cadedrin) |
| FAM171A1 | 2.18 | 2.45E-10 | family with sequency similarity 171, member A1 |
| EFNB3 | 2.05 | 8.76E-10 | ephrin-B3 |
| PCYT1B | 2.16 | 9.13E-10 | phosphate cytidylytransferase 1, choline, β |
| RNF157 | 2.26 | 1.16E-09 | ring finger protein 157 |
| CDK18 | 2.46 | 1.57E-09 | cyclin-dependent kinase 18 |
| LRFN5 | 3.63 | 2.01E-09 | leucine rich repeat and fibronectin type III domain containing 5 |
| CACNA2D4 | 4.11 | 2.92E-09 | calcium channel, voltage-dependent, a2/δ subunit 4 |
| P PARGC1B | 2.97 | 5.94E-09 | peroxisome proliferator-activated receptor γ, coactivator 1 β |
| Down-regulated | |||
| GH1 | –9.74 | 1.49E-21 | growth hormone 1 |
| CSH1 | –8.67 | 3.69E-15 | chorionic somatomammotropin hormone 1 (placental lactogen) |
| DLK1 | –9.33 | 4.16E-15 | δ-like 1 homolog (Drosophila) |
| CSH2 | –9.17 | 3.14E-13 | chorionic somatomammotropin hormone 2 |
| HIP1R | –2.16 | 5.43E-12 | huntingtin interacting protein 1 related |
| CDKN2A | –2.33 | 4.74E-11 | cyclin-dependent kinase inhibitor 2A (melanoma, p16, inhibits CDK4) |
| MGP | –2.86 | 8.06E-11 | matrix Gla protein |
| KCNJ6 | –3.79 | 9.50E-11 | potassium inwardly-rectifying channel, subfamily J, member 6 |
| SPRY4 | –2.32 | 1.03E-10 | sprouty homolog 4 (Drosophila) |
| MEG3 | –5.72 | 1.60E-10 | maternally expressed 3 (non-protein coding) |
Corrected p value <0.05 and [log2 FC (fold change)] >2 were set as the cut-off to identify differentially expressed genes.
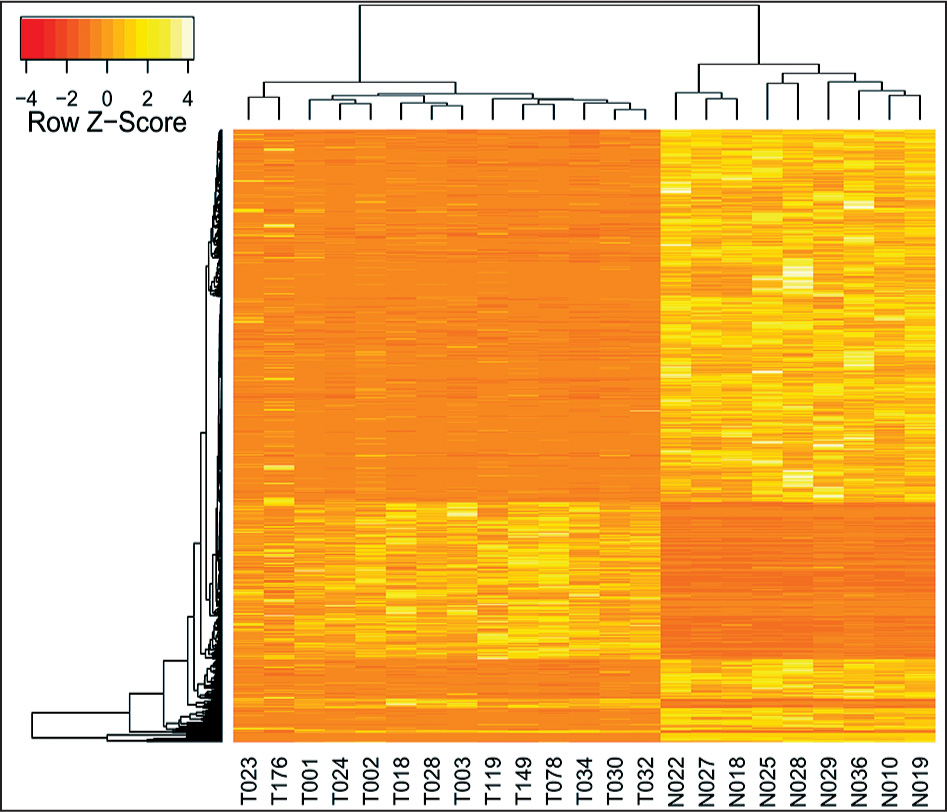
Cluster analysis of DEGs. DEGs: differentially expressed genes; T: tumor samples; N: healthy normal samples. Cluster analysis was performed both at gene level (vertical) and sample level (horizontal).
Table 2
Significantly enriched terms.
| Category | Term ID | Corrected p Value | Number of DEGs | Number of Genes | Term |
|---|---|---|---|---|---|
| KEGG | K04610 | 3.18E-04 | 10 | 69 | complement and coagulation cascades |
| K04512 | 3.97E-04 | 11 | 84 | extracellular matrix-receptor interaction | |
| K04010 | 4.55E-03 | 20 | 271 | MAPK signaling pathway | |
| K04115 | 5.32E-02 | 8 | 69 | p53 signaling pathway | |
| K00350 | 6.79E-03 | 9 | 87 | transforming growth factor β signaling pathway | |
| K04630 | 7.62E-03 | 13 | 155 | Jak-STAT signaling pathway | |
| K04080 | 1.14E-02 | 18 | 256 | neuroactive ligand-receptor interaction | |
| K04510 | 1.27E-02 | 15 | 202 | focal adhesion | |
| K05218 | 2.08E-02 | 7 | 71 | Melanoma | |
| K05412 | 2.90E-02 | 7 | 76 | arrhythmogenic right ventricular cardiomopathy | |
| K05210 | 4.63E-02 | 7 | 84 | colorectal cancer | |
| K04920 | 4.70E-02 | 6 | 67 | adipocytokine signaling pathway | |
| GO BP | GO:0032501 | 2.26E-24 | 266 | 4974 | multicellular organismal process |
| (top 10) | GO:0010243 | 6.92E-13 | 57 | 596 | response to organic nitrogen |
| GO:0007275 | 4.19E-12 | 112 | 2080 | multicellular organismal development | |
| GO:0048583 | 2.00E-10 | 99 | 1624 | regulation of response to stimulus | |
| GO:0023051 | 4.23E-10 | 110 | 1866 | regulation of signaling | |
| GO:0010646 | 5.12E-10 | 110 | 1872 | regulation of cell communication | |
| GO:0048812 | 1.38E-09 | 49 | 571 | neuron projection morphogenesis | |
| GO:0048667 | 3.03E-09 | 48 | 566 | cell morphogenesis involved in neuron differentiation | |
| GO:0007243 | 3.09E-09 | 64 | 879 | intracellular protein kinase cascade | |
| GO:0022008 | 6.39E-09 | 63 | 900 | neurogenesis | |
| GO CC | GO:0005576 | 1.31E-14 | 132 | 2164 | extracellular region |
| (top 10) | GO:0005615 | 1.19-E-09 | 61 | 848 | extracellular space |
| GO:0005587 | 1.37E-05 | 4 | 6 | collagen type IV | |
| GO:0005581 | 1.90E-05 | 12 | 88 | collagen | |
| GO:0043005 | 5.12E-05 | 39 | 634 | neuron projection | |
| GO:0005578 | 5.72E-05 | 18 | 204 | proteinaceous extracellular matrix | |
| GO:0031012 | 8.74E-05 | 9 | 62 | extracellular matrix | |
| GO:0016323 | 1.39E-04 | 15 | 158 | basolateral plasma membrane | |
| GO:0005887 | 5.55E-04 | 59 | 1216 | integral to plasma membrane | |
| GO:0005584 | 9.84E-04 | 2 | 2 | collagen type I | |
| GO MF | GO:0005201 | 2.40E-10 | 17 | 78 | extracellular matrix structural constituent |
| (top 10) | GO:0008201 | 1.20E-07 | 18 | 129 | heparin binding |
| GO:0097367 | 1.60E-07 | 22 | 191 | carbohydrate derivative binding | |
| GO:0042803 | 5.71E-06 | 38 | 553 | protein homodimerization binding | |
| GO:0005179 | 9.11E-11 | 14 | 110 | hormone activity | |
| GO:0000981 | 1.75E-05 | 22 | 253 | sequence specific DNA binding RNA polymerase II transcription factor activity | |
| GO:0001077 | 4.36E-05 | 10 | 67 | RNA polymerase II core promoter proximal region sequence-specific DNA binding transcription factor activity involved in positive regulation of transcription | |
| GO:0019199 | 5.05E-05 | 11 | 82 | transmembrane receptor protein kinase activity | |
| GO:0005102 | 1.92E-04 | 55 | 1093 | receptor binding | |
| GO:0048407 | 2.70E-04 | 4 | 11 | platelet-derived growth factor binding |
ID: identifier; DEGs: differentially expressed genes; KEGG: Kyoto Encyclopedia of Genes and Genomes; GO: gene ontology; BP: biological process; CC: cellular component; MF: molecular functions.
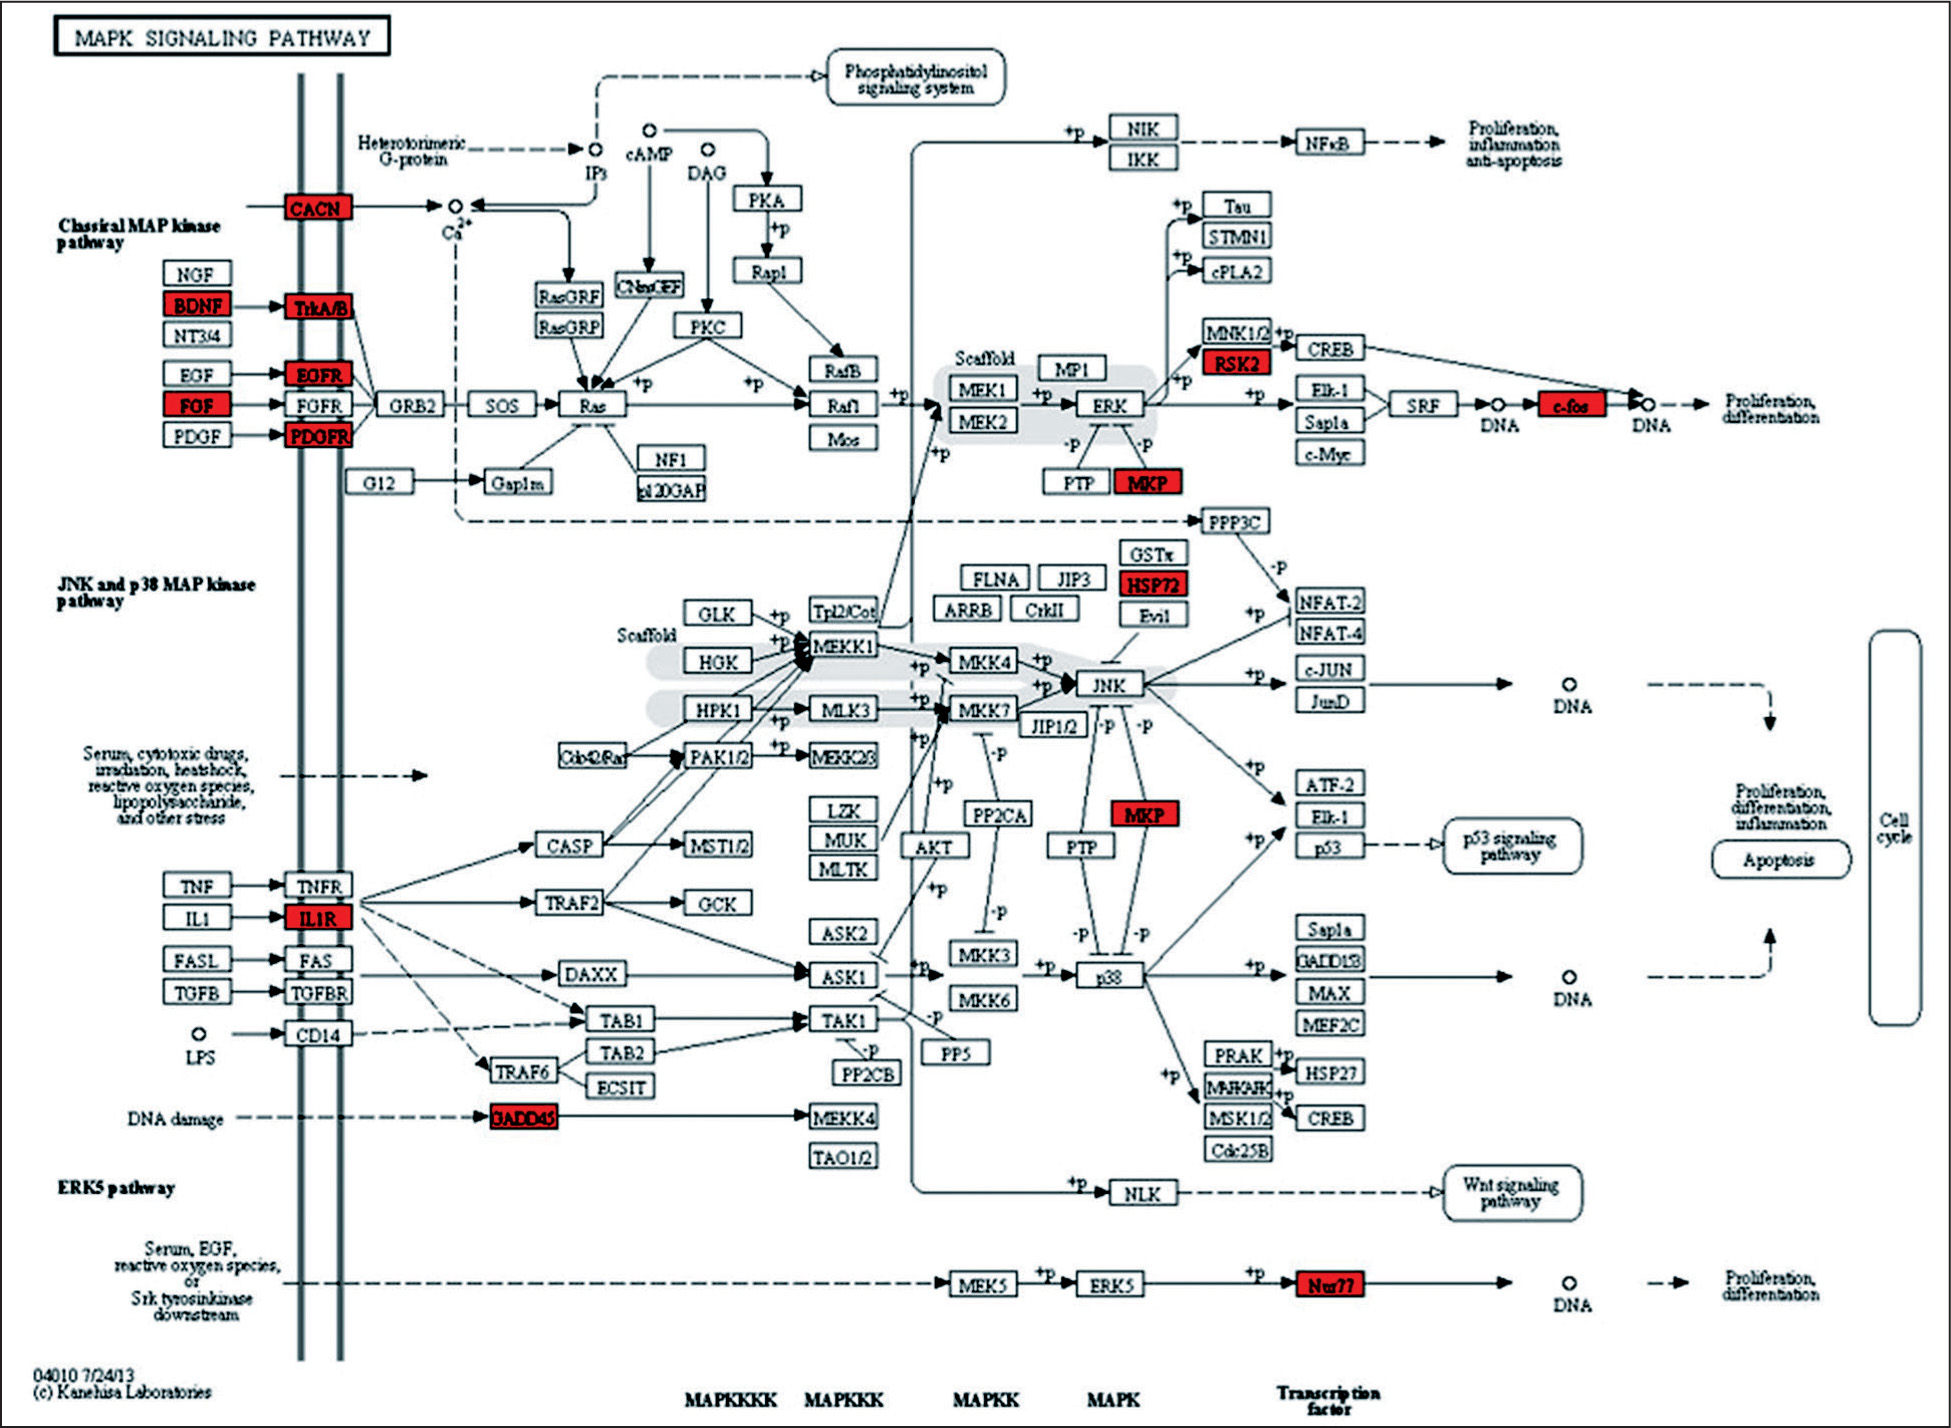
The MAPK signaling pathway. Genes down-regulated in NFPAs are shown in green, while up-regulated genes are in red.
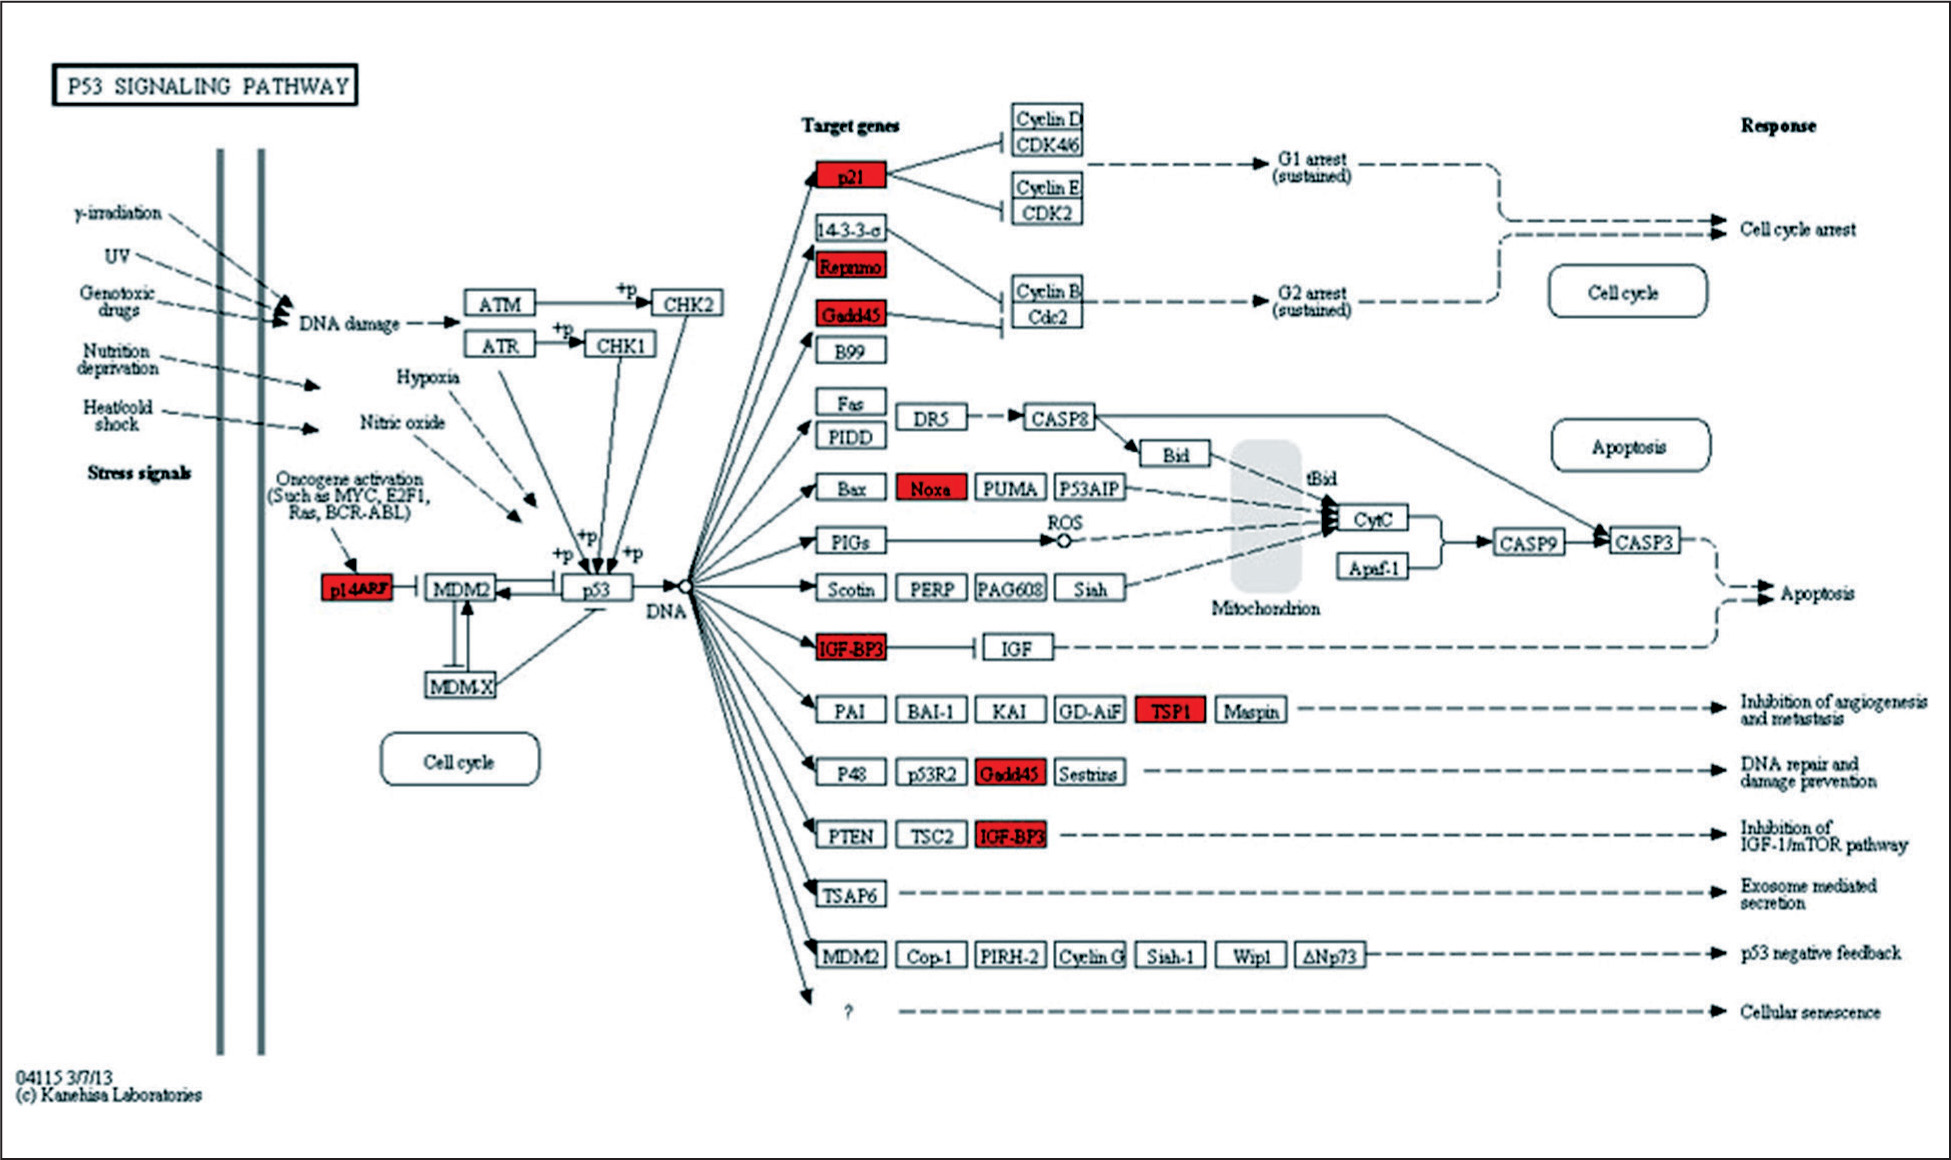
The p53 signaling pathway. Genes down-regulated in NFPAs are shown in green, while up-regulated genes are in red.
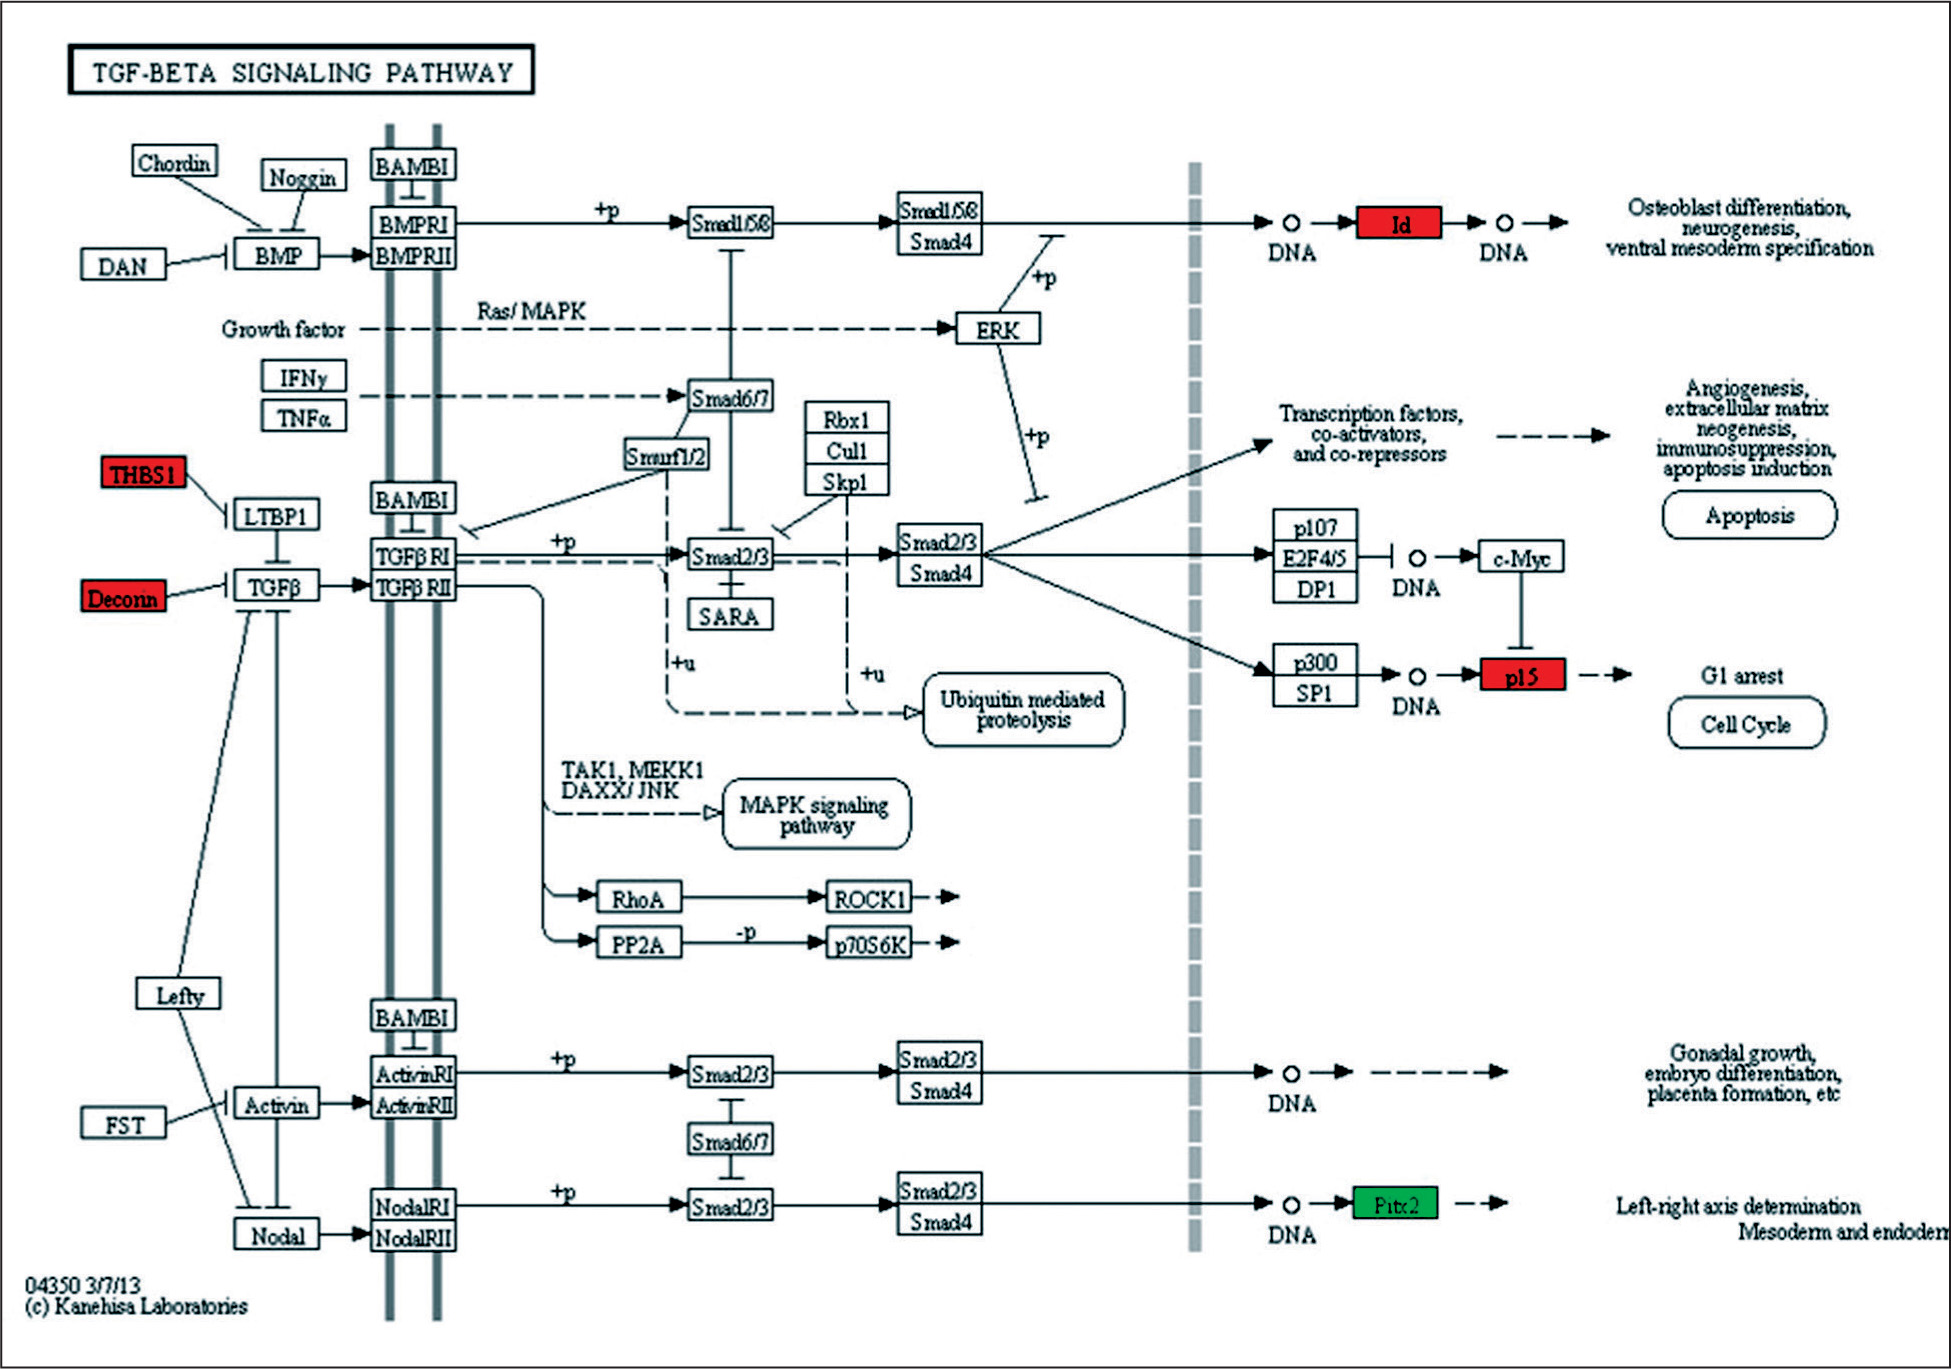
The TGFβ signaling pathway. Genes down-regulated in NFPAs are shown in green, while up-regulated genes are in red.
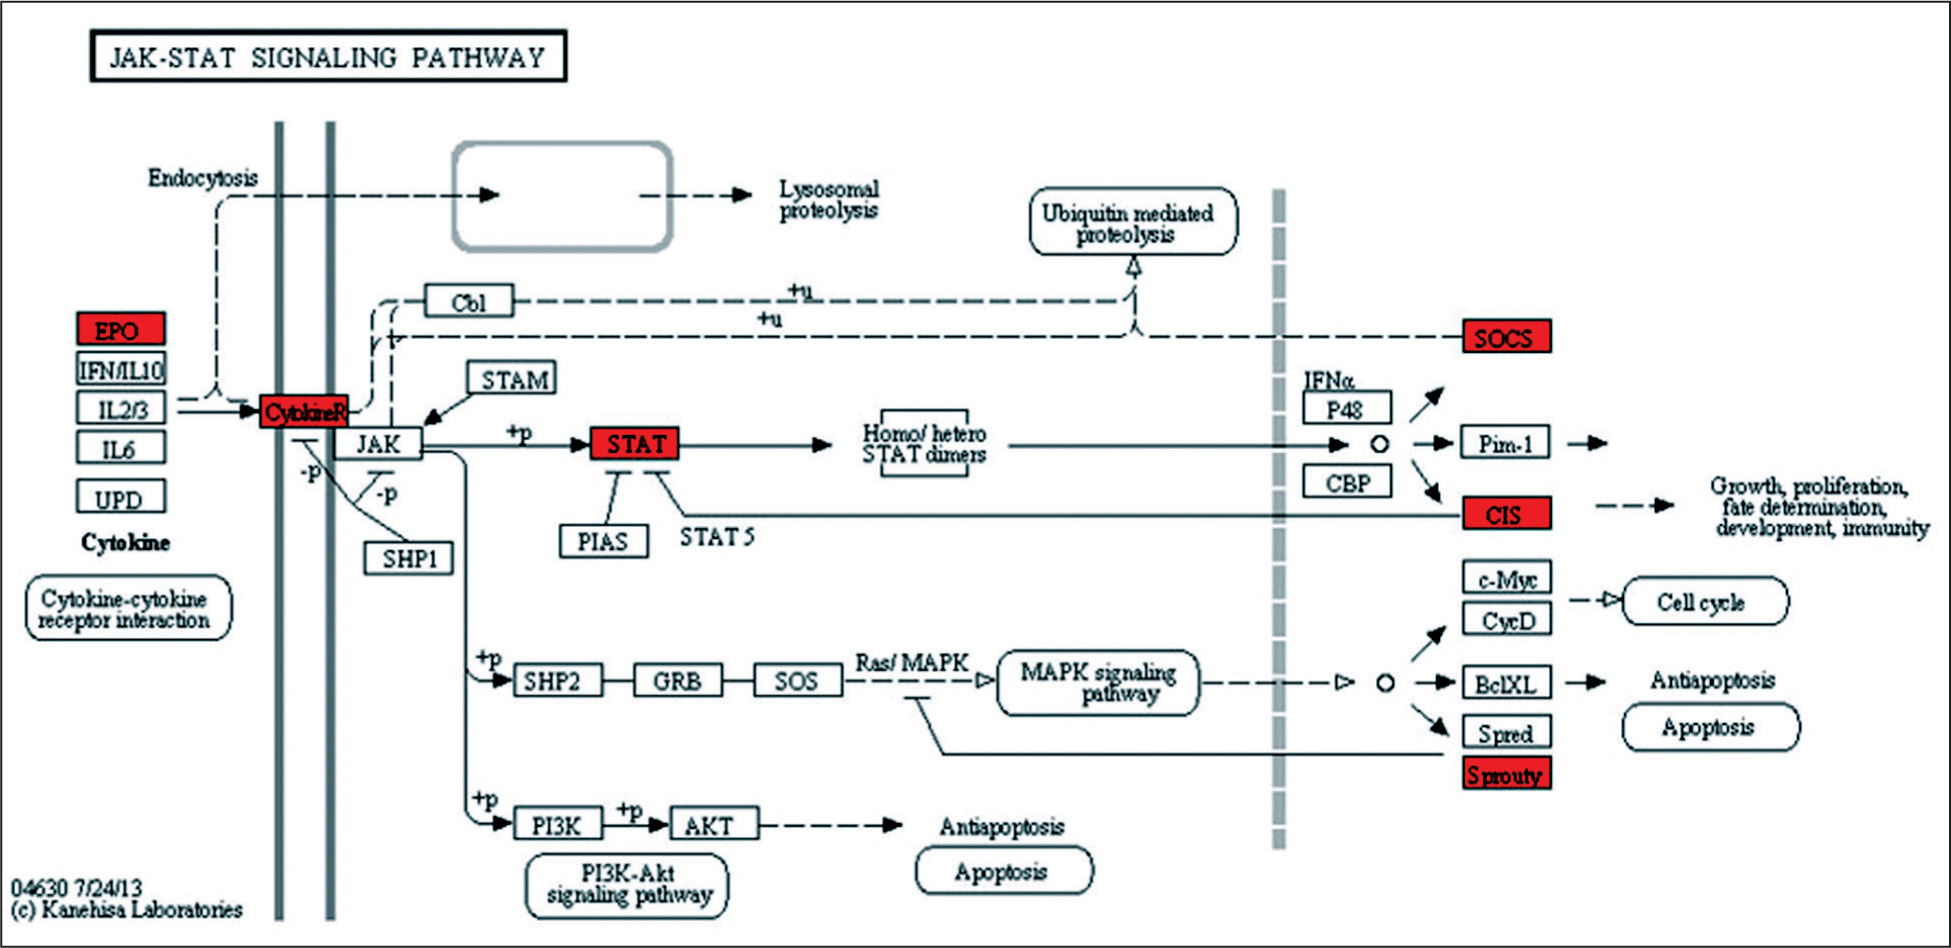
Jak-STAT signaling pathway. Genes down-regulated in NFPAs are shown in green, while up-regulated genes are in red.
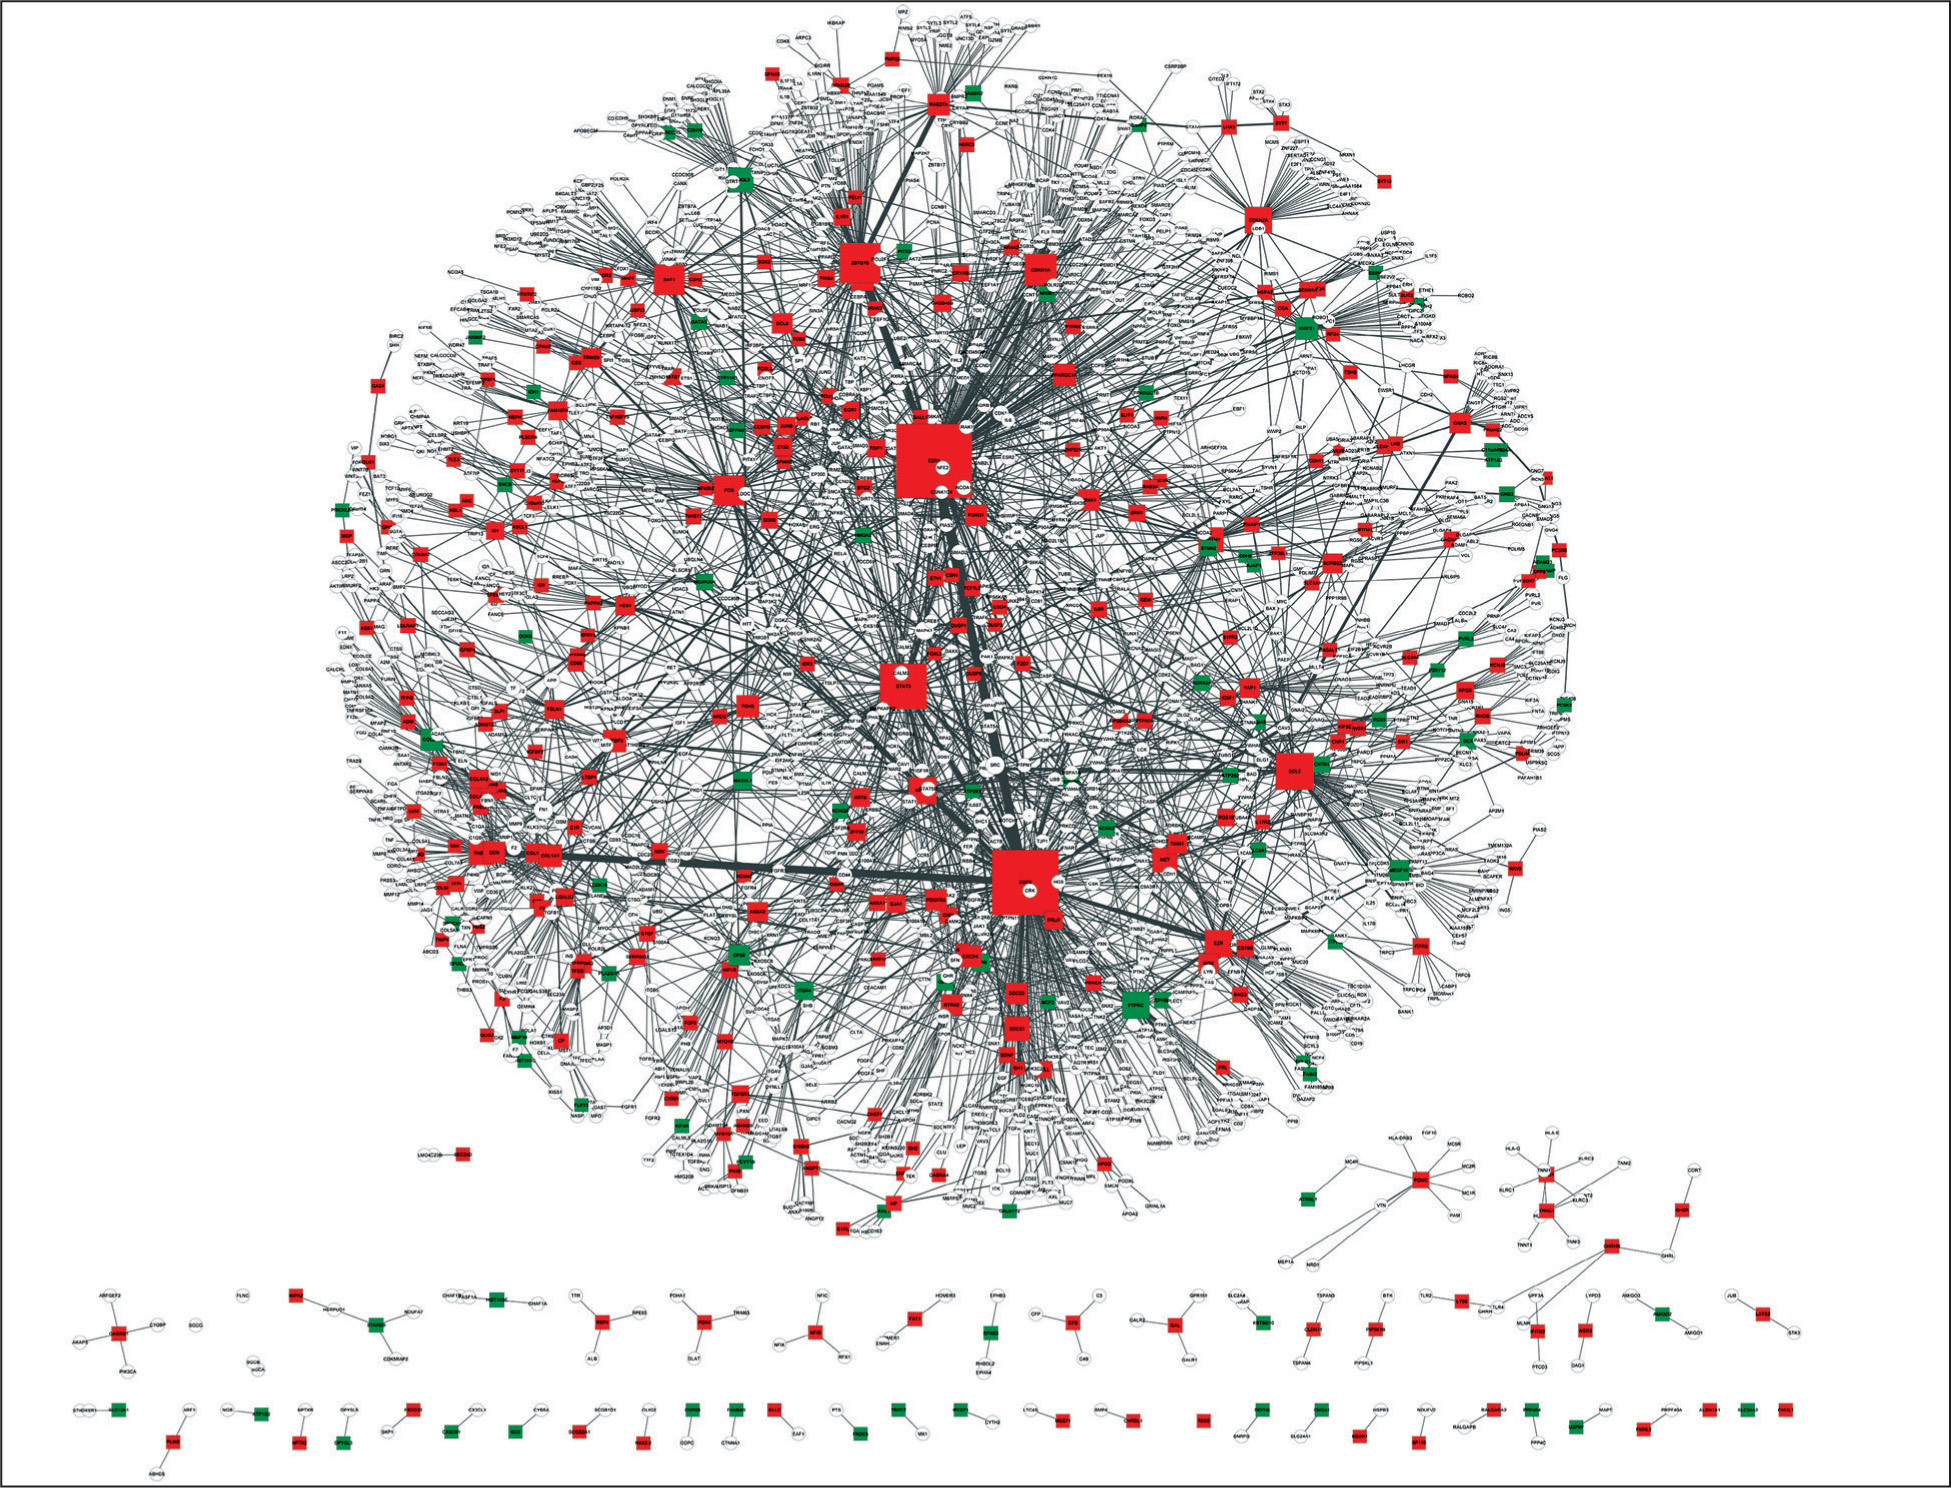
The whole PPI network of DEGs. Red nodes represent the genes up-regulated in NFPAs, and green nodes represent the genes down-regulated in NFPAs. Circle nodes stand for known disease genes, whereas triangle nodes stand for potential novel disease genes. Node size positively correlates with node degree, namely, the number of neighbors. PPI: protein-protein interaction; DEGs: differentially expressed genes; NFPAs: non-functioning pituitary adenomas.
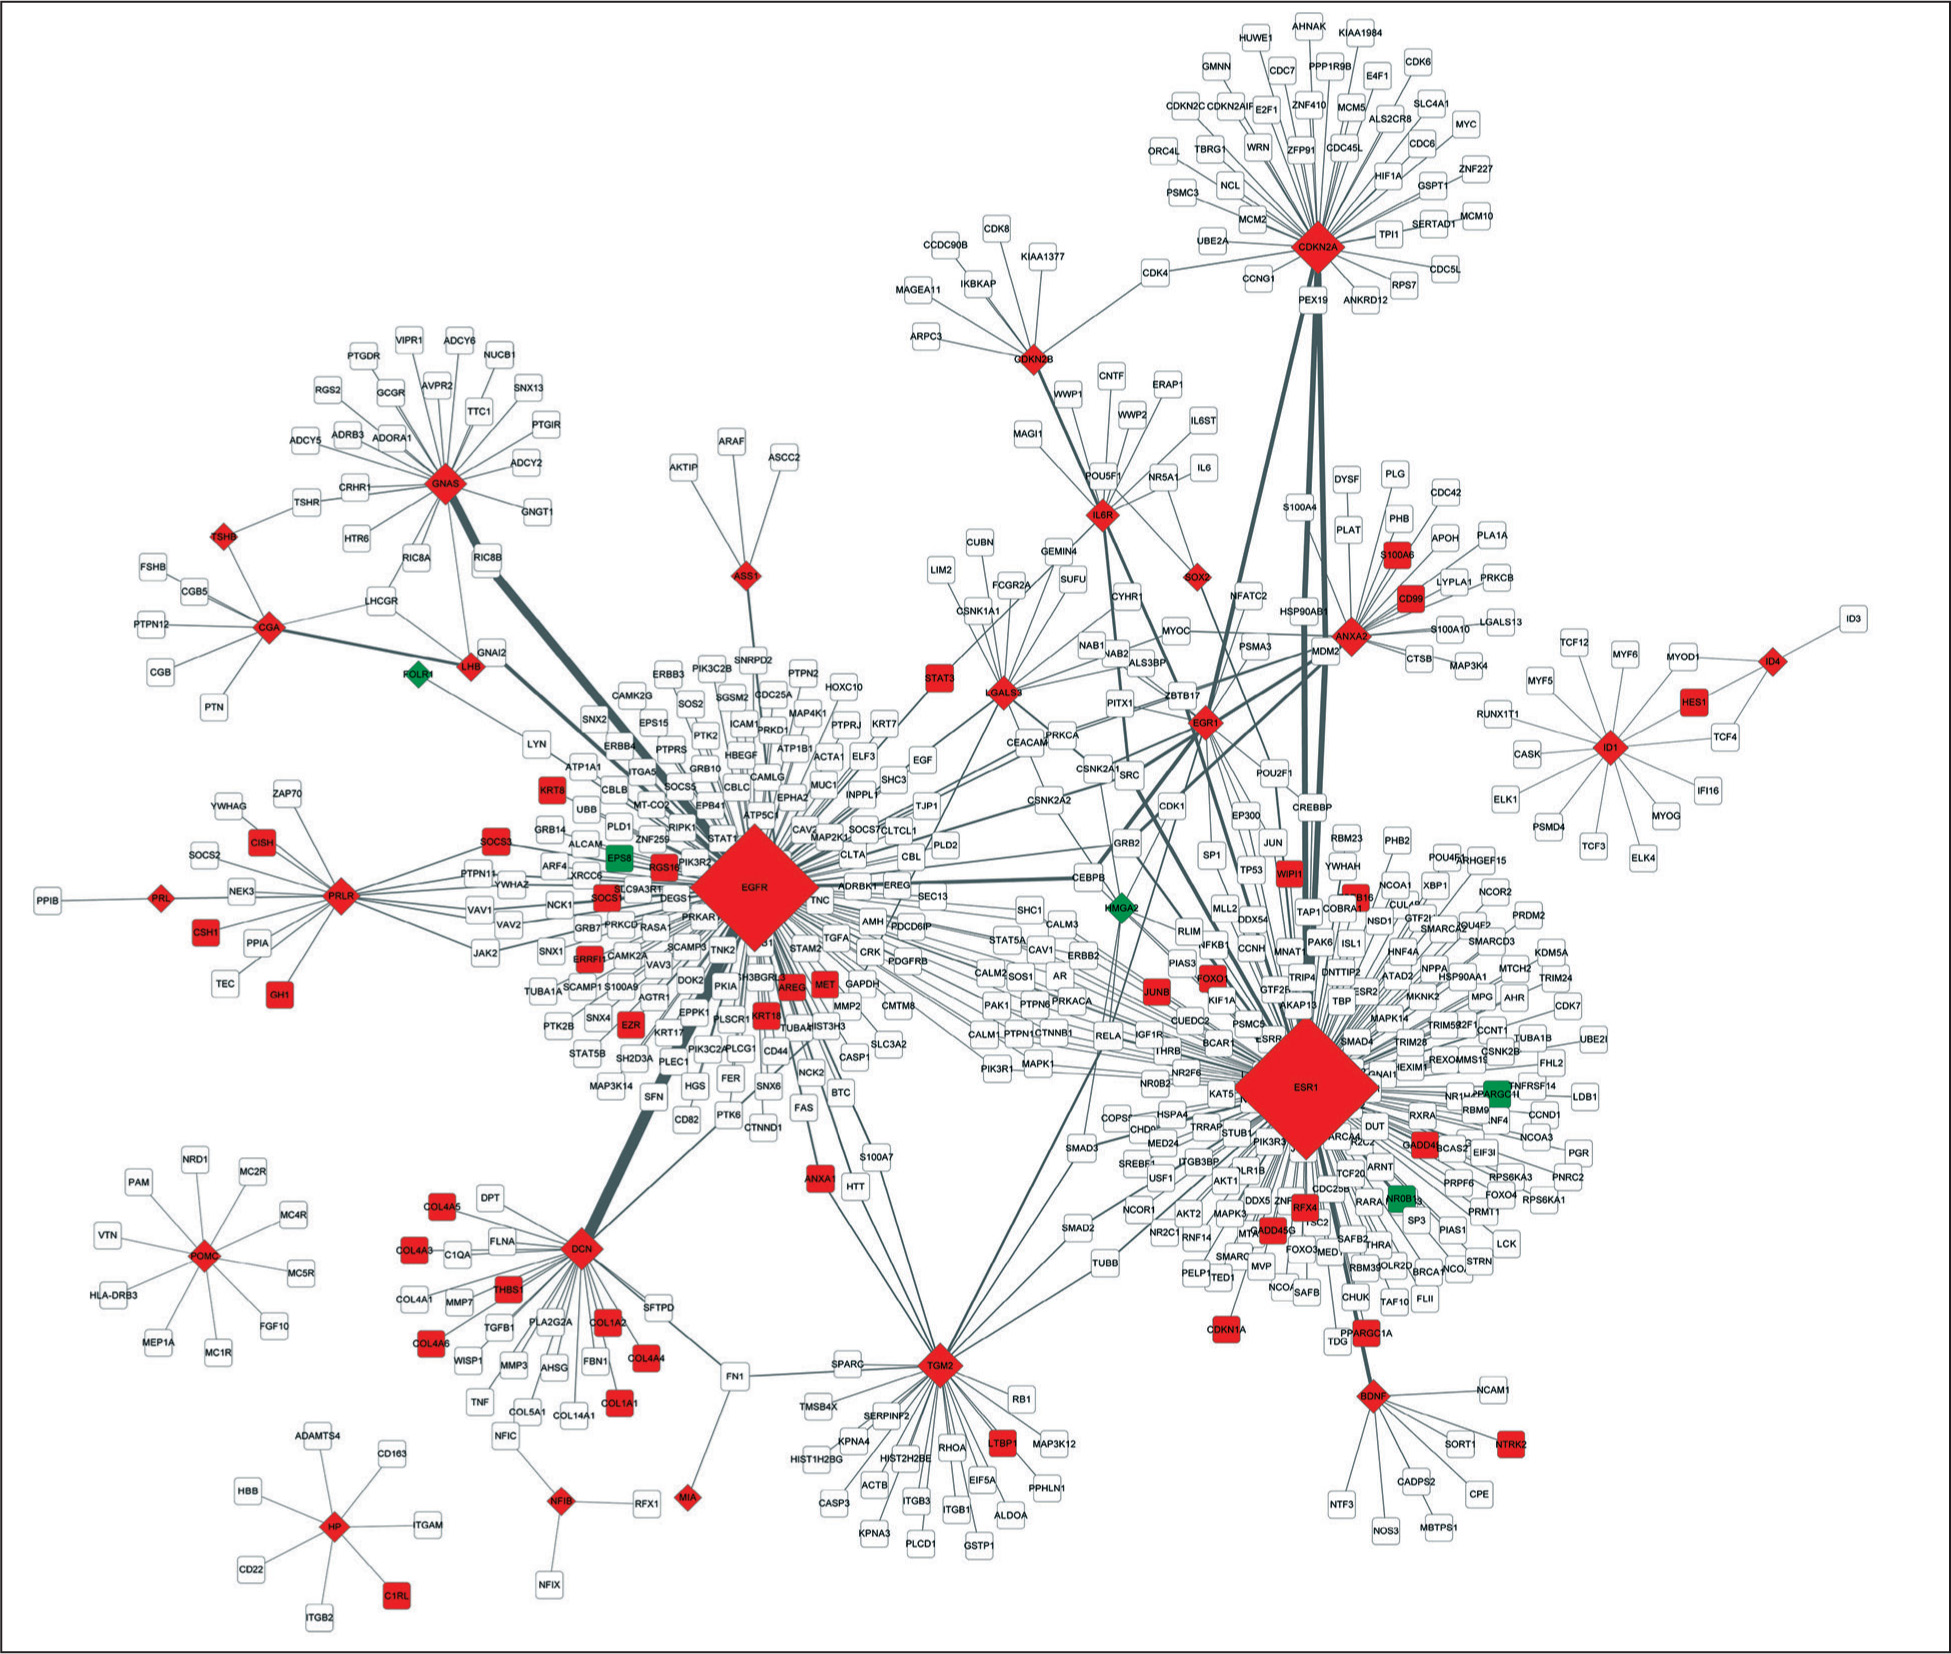
The PPI sub-network containing the top 10 DEGs. Red nodes represent the genes up-regulated in NFPAs, and green nodes represent the genes down-regulated in NFPAs. Circle nodes stand for known disease genes, whereas triangle nodes stand for potential novel disease genes. Node size positively correlates with node degree, namely, the number of neighbors. PPI: protein-protein interaction; DEGs: differentially expressed genes; NFPAs: non-functioning pituitary adenomas.