
Table 1
Description of the primers used in the quantitative RT-PCR analysis
| Gene | Forward primer (5′ to 3′) | Reverse primer (5′ to 3′) |
|---|---|---|
| COL 1 | AAGGCTTCAAGGTCCCCCTGGTG | CAGCACCAGTAGCACCATCATTTC |
| COL 2 | GGCAATAGCAGGTTCACGTACA | CGATAACAGTCTTGCCCCACTT |
| COL X | CGTCTTCAGCGCCAAGC | CGCCATTCTTCACCAGATCAAA |
| ACP | CATTCGGCGGACAAATTAGATG | CCTACAAACGCAGACTACAGAA |
| SOX9 | CTGAGTCATTTGCAGTGTTTTCT | CATGCTTGCATTGTTTTTGTGT |
| GAPDH | GGCGATGCTGGCGCTGAGTAC | TGGTTCACACCCATGACGA |
[i] F, forward (sense) primer; R, reverse (anti-sense) primer
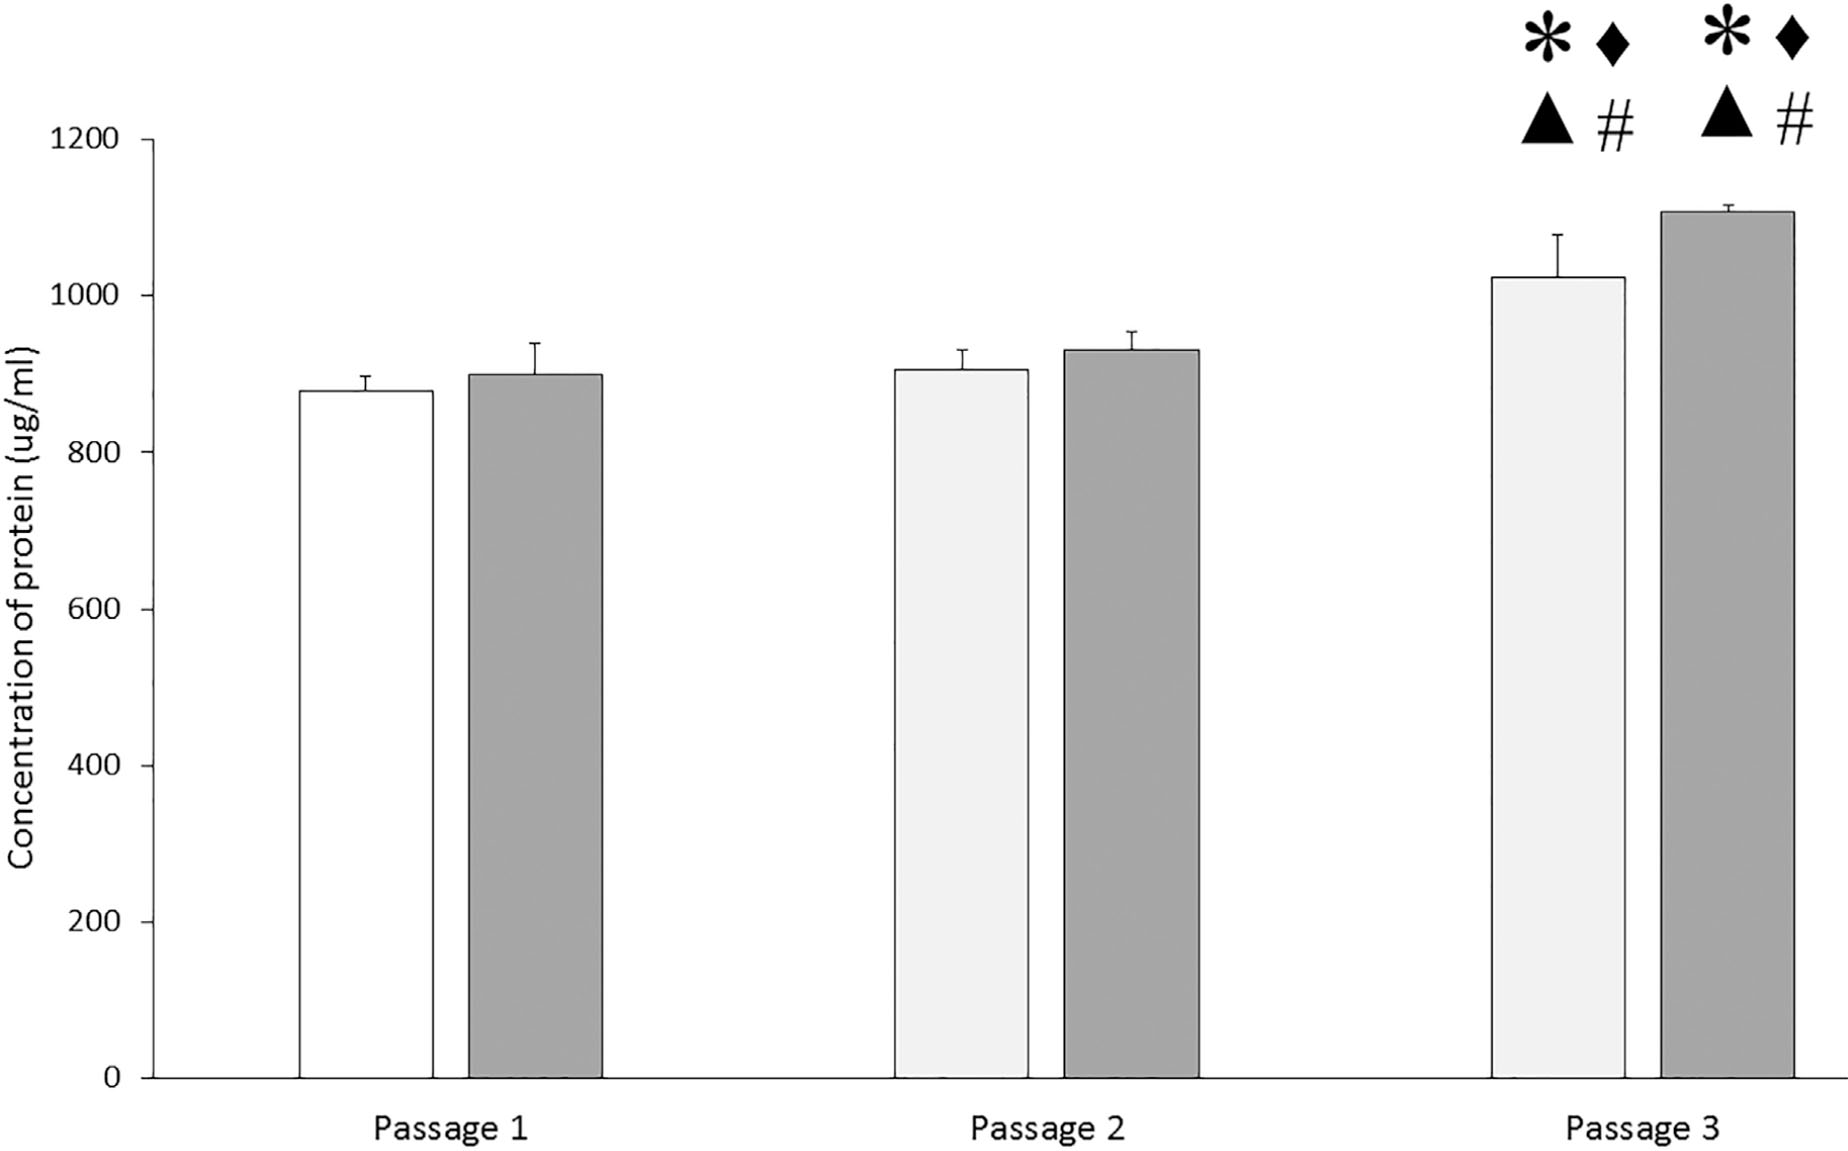
Figure 1
Protein concentrations for iCCM for every passage at different collection time points. There are no significant differences in the passage 3 protein concentration between 48 h (unfilled bars) (1023.22 ± 55.85 μg/ml) and 72 h (gray bars) (1108.64 ± 7.82 μg/ml). *significant differences with P1 (48 h), ▴ significant differences with P1 (72 h), ♦ significant differences with P2 (48 h), and #significant differences with P2 (72 h).
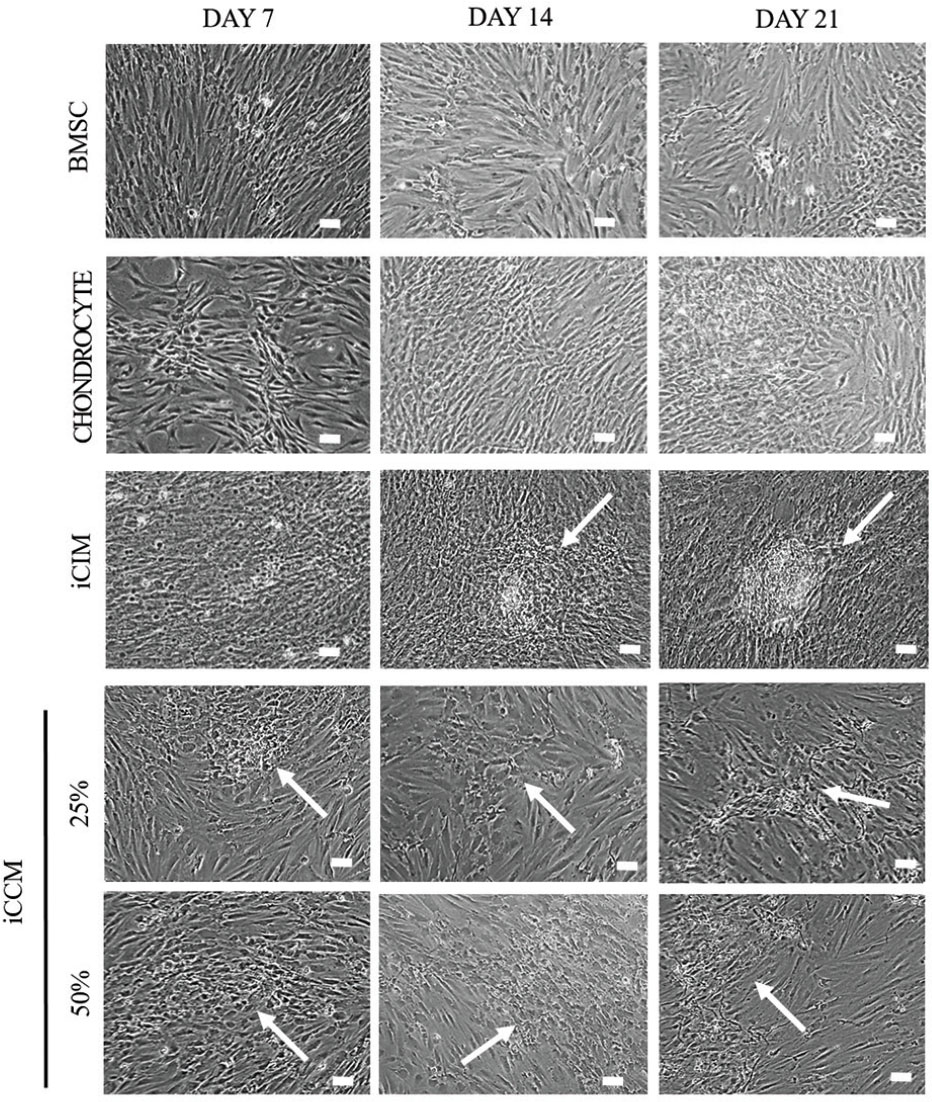
Figure 2
Morphology of BMSCs, chondrocyte and iCIM and iCCM. Arrows show the formation of aggregates. Bars represent 100 μm.
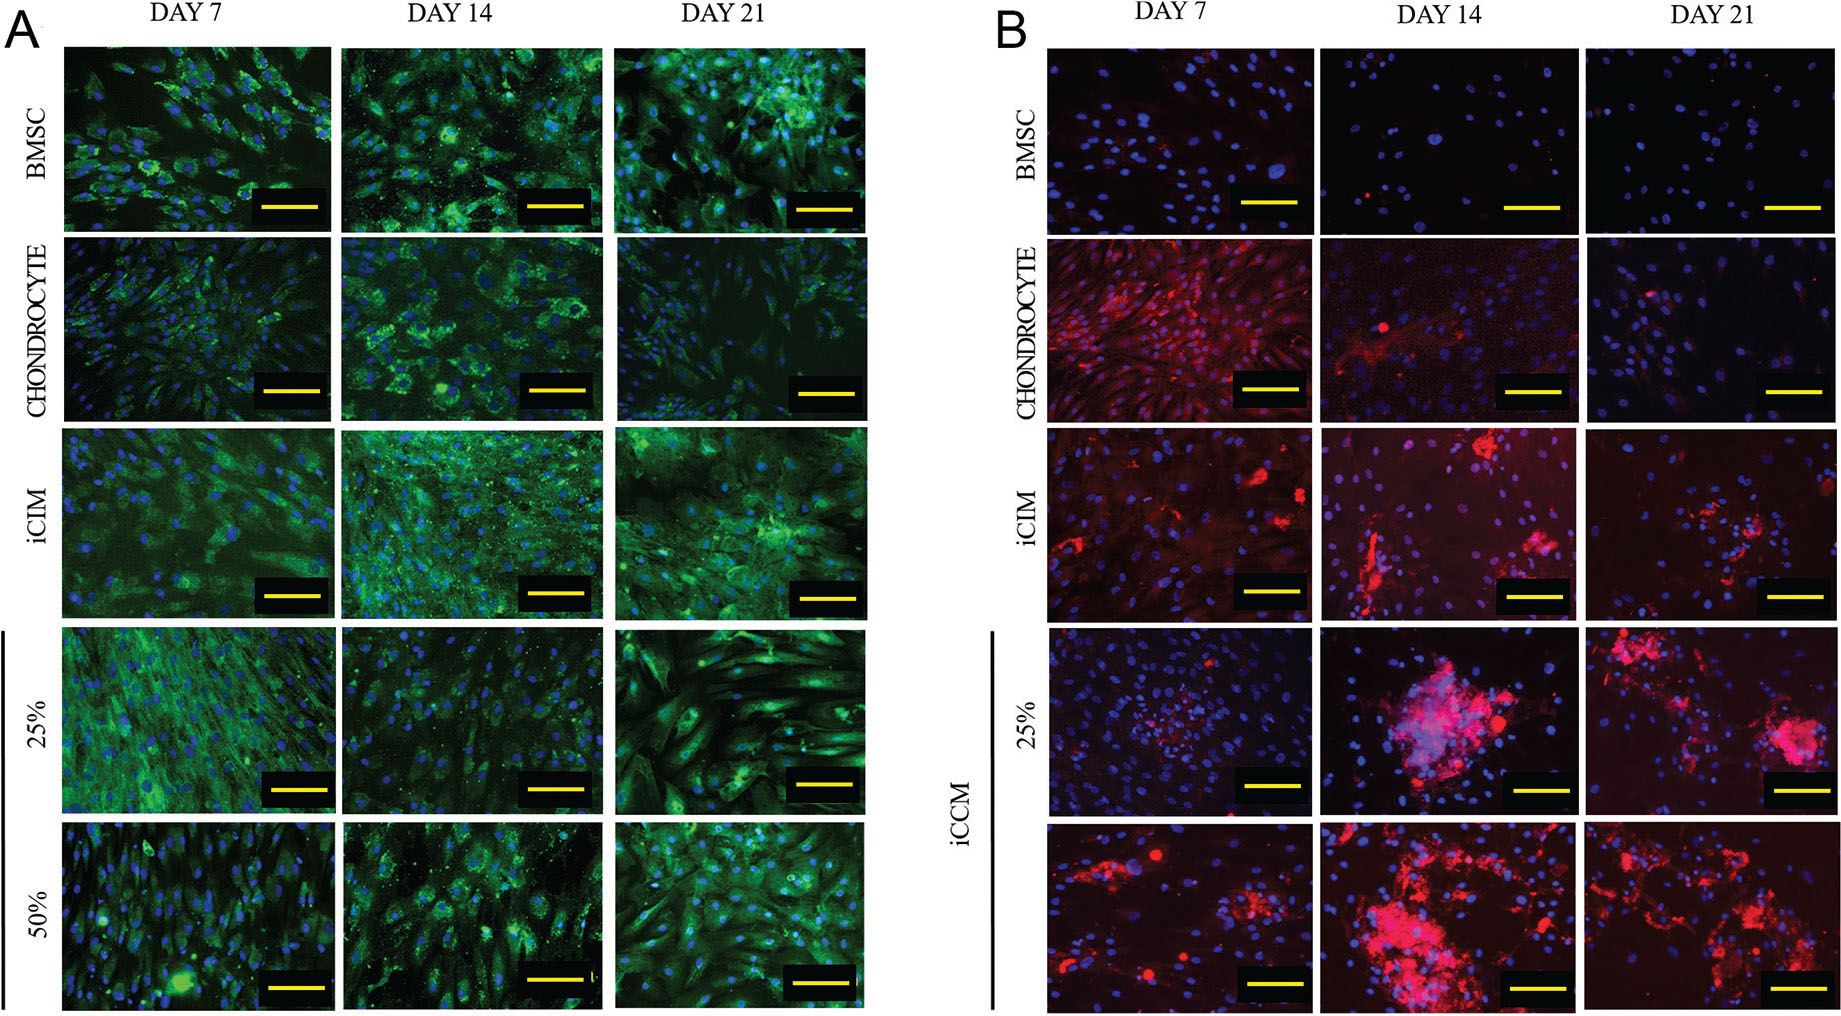
Figure 3
Immunofluorescence images of BMSCs, Chondrocytes, and iCIM and iCCM on days 7, 14, and 21. Cells were stained for (A) collagen 1 (green) and (B) collagen 2 (red). Nuclei were stained with DAPI (blue). Yellow bar represents 100 μm.
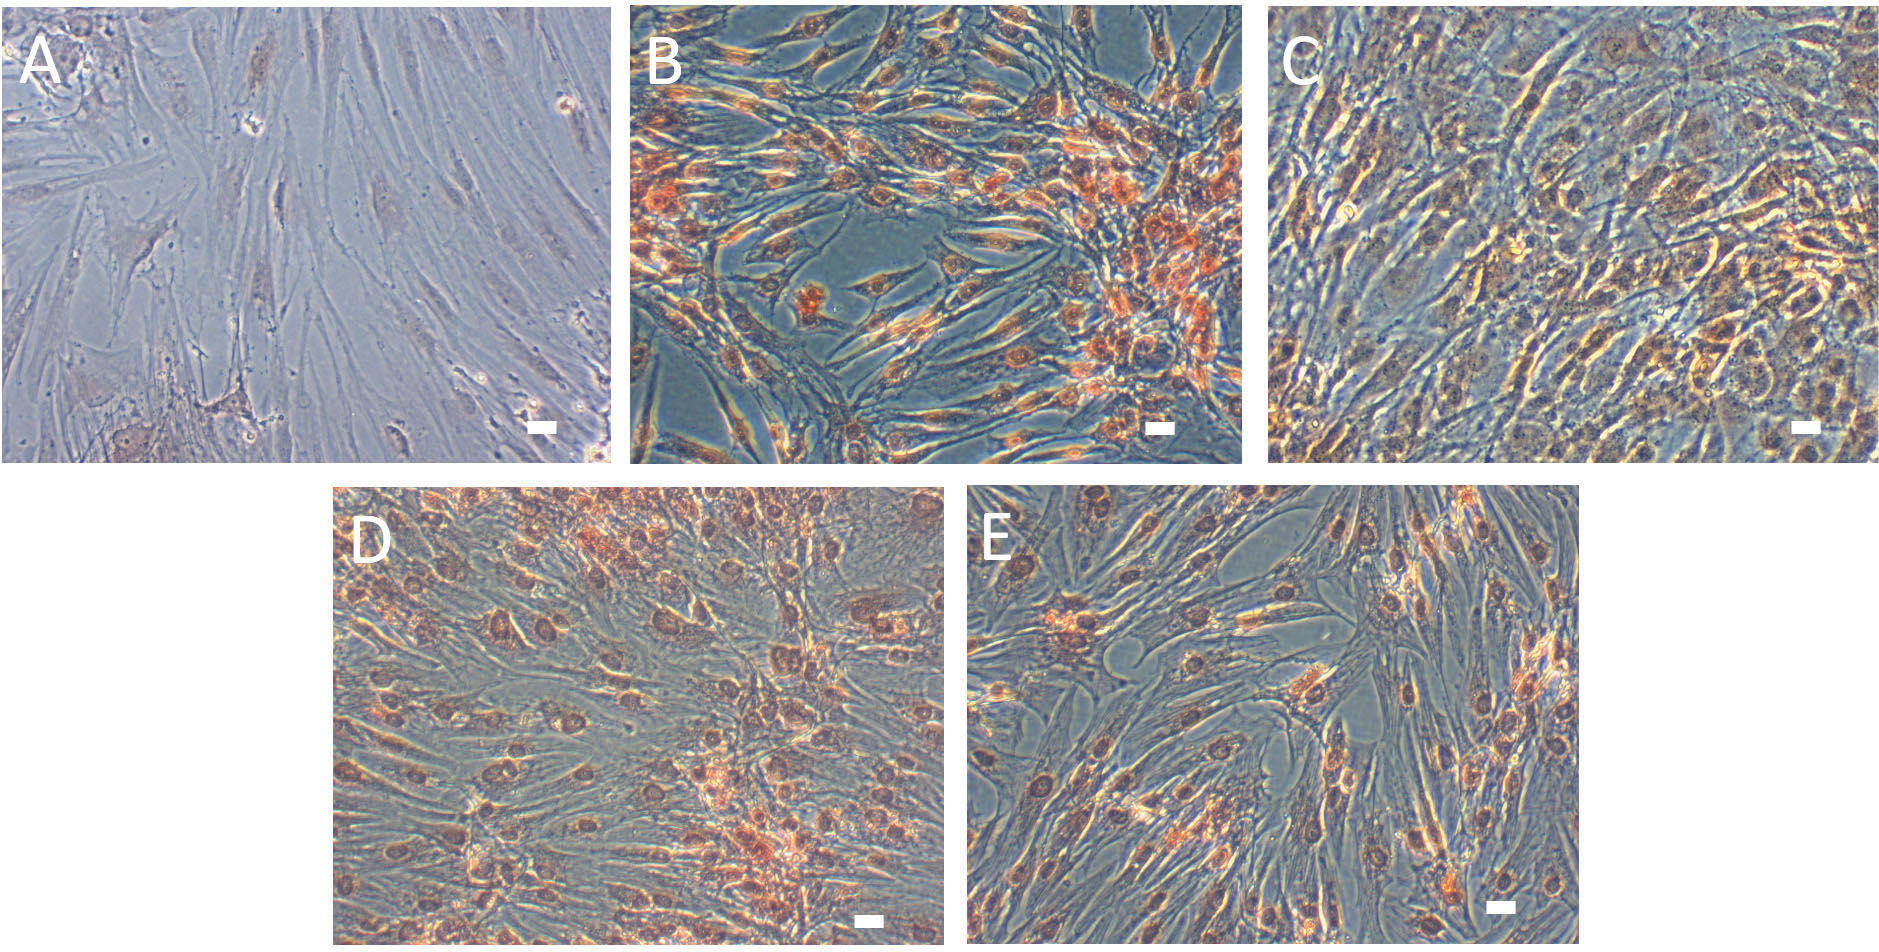
Figure 4
iCCM and chondrocytes showed positive staining for Safranin-O, indicating that the synthesis of the extracellular matrix (GAG) happened as early as day 7. (A) BMSCs, (B) Chondrocytes, (C) iCIM, (D) iCCM 25%, and (E) iCCM 50%. Bars represent 100 μm.
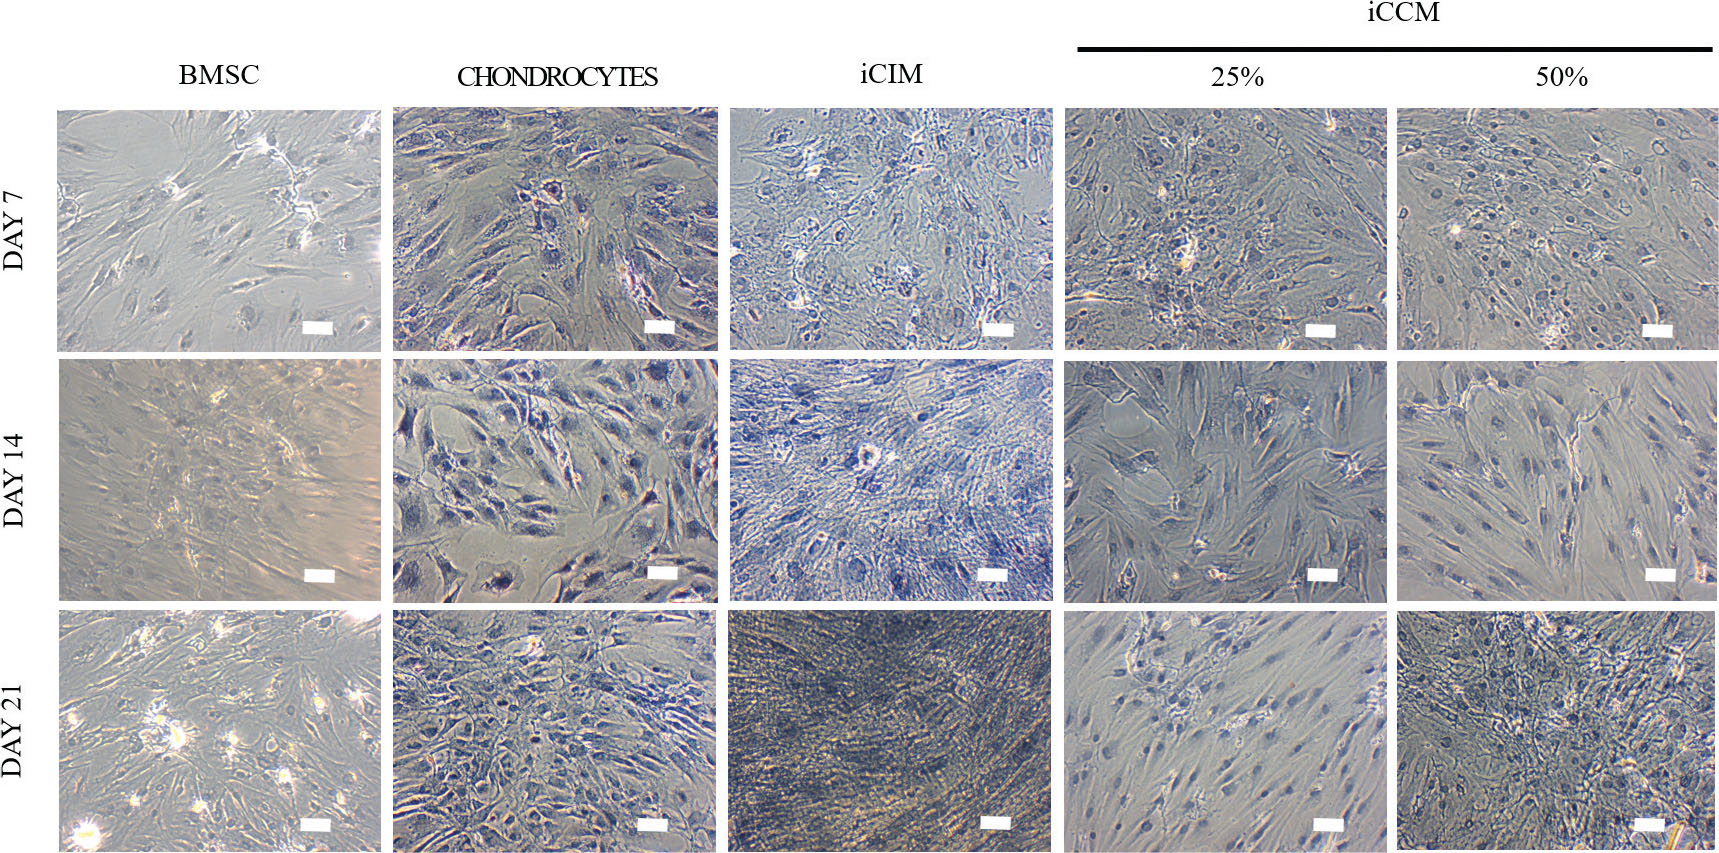
Figure 5
Toluidine blue staining of BMSCs, Chondrocytes, iCIM and tested groups of iCCM at days 7, 14 and 21. Bars represent 100 μm.
Table 2
COL 2, ACP, SOX9, COL 1 and COL 10 gene expression of BMSCs, iCIM, iCCM, and chondrocytes
| COL 2 | ACP | SOX9 | COL 1 | COL 10 | |
|---|---|---|---|---|---|
| BMSCs | 0.000110 ± 0.000067* | 0.0279 ± 0.0377* | 0.000127 ± 0.000159* | 0.584 ± 0.181* | 0.000118 ± 0.000102* |
| iCIM | 0.001068 ± 0.000882† | 0.0636 ± 0.0711 | 0.024188 ± 0.041229† | 0.417 ± 0.404 | 0.000268 ± 0.000212†,# |
| iCCM | 0.001047 ± 0.000929‡ | 0.0467 ± 0.0408 | 0.003450 ± 0.005637‡ | 0.173 ± 0.283 | 0.000736 ± 0.000183‡,§ |
| Chondrocytes | 0.154506 ± 0.006891 | 0.0952 ± 0.0038 | 0.544180 ± 0.098256 | 0.160 ± 0.028 | 0.060961 ± 0.049591 |