
Figure 1
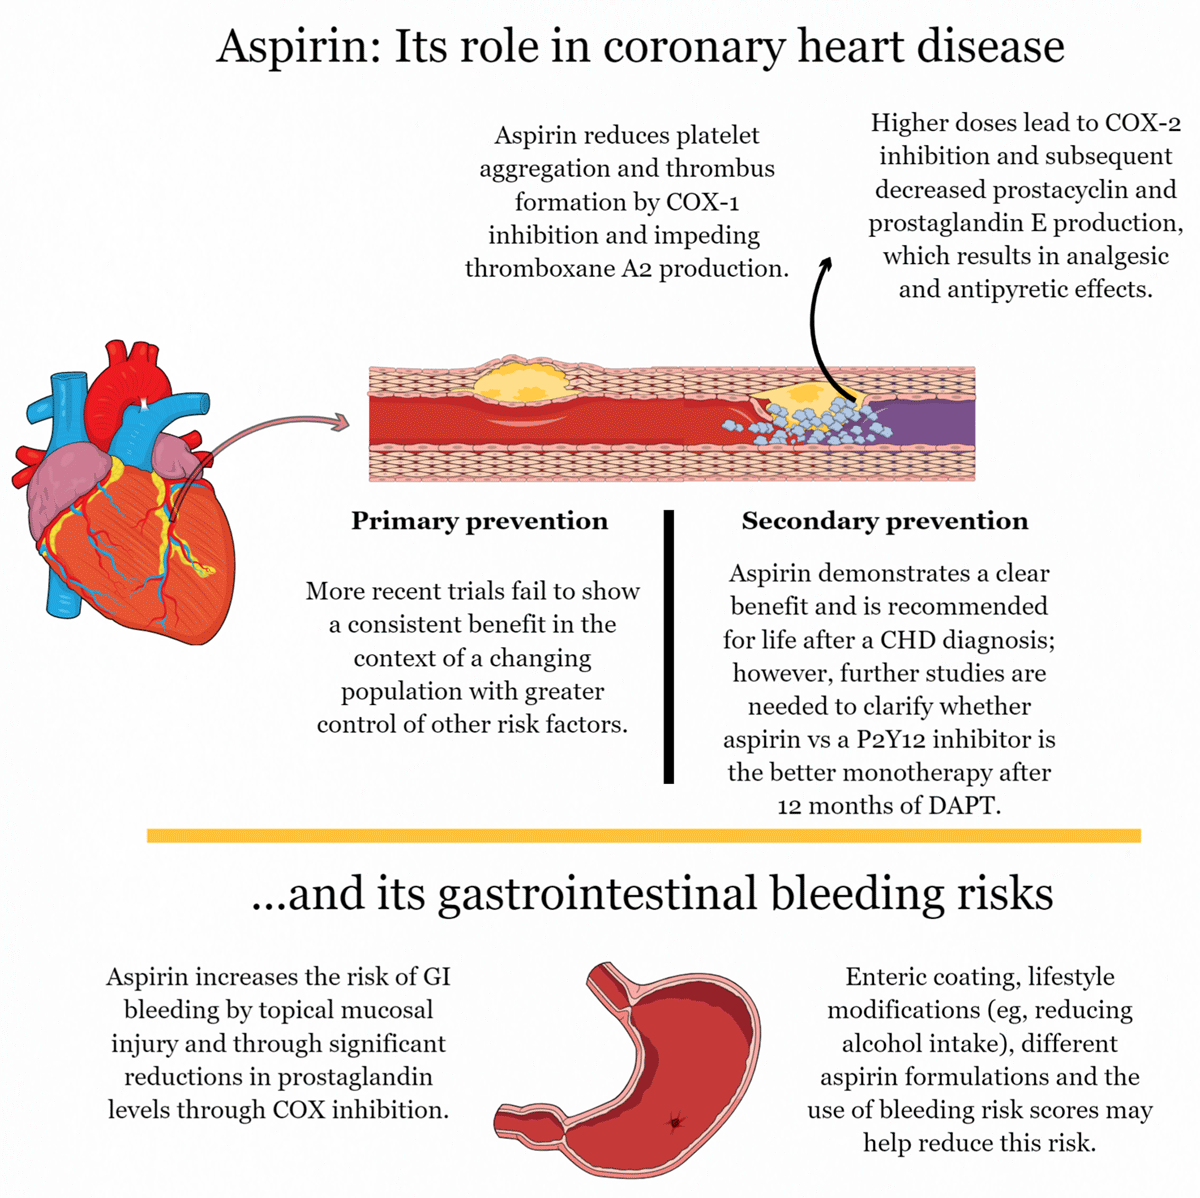
The role of aspirin in primary and secondary prevention. COX: cyclooxygenase isoenzyme; CHD: coronary heart disease; P2Y12: a chemoreceptor for adenosine diphosphate; DAPT: dual antiplatelet therapy; GI: gastrointestinal.
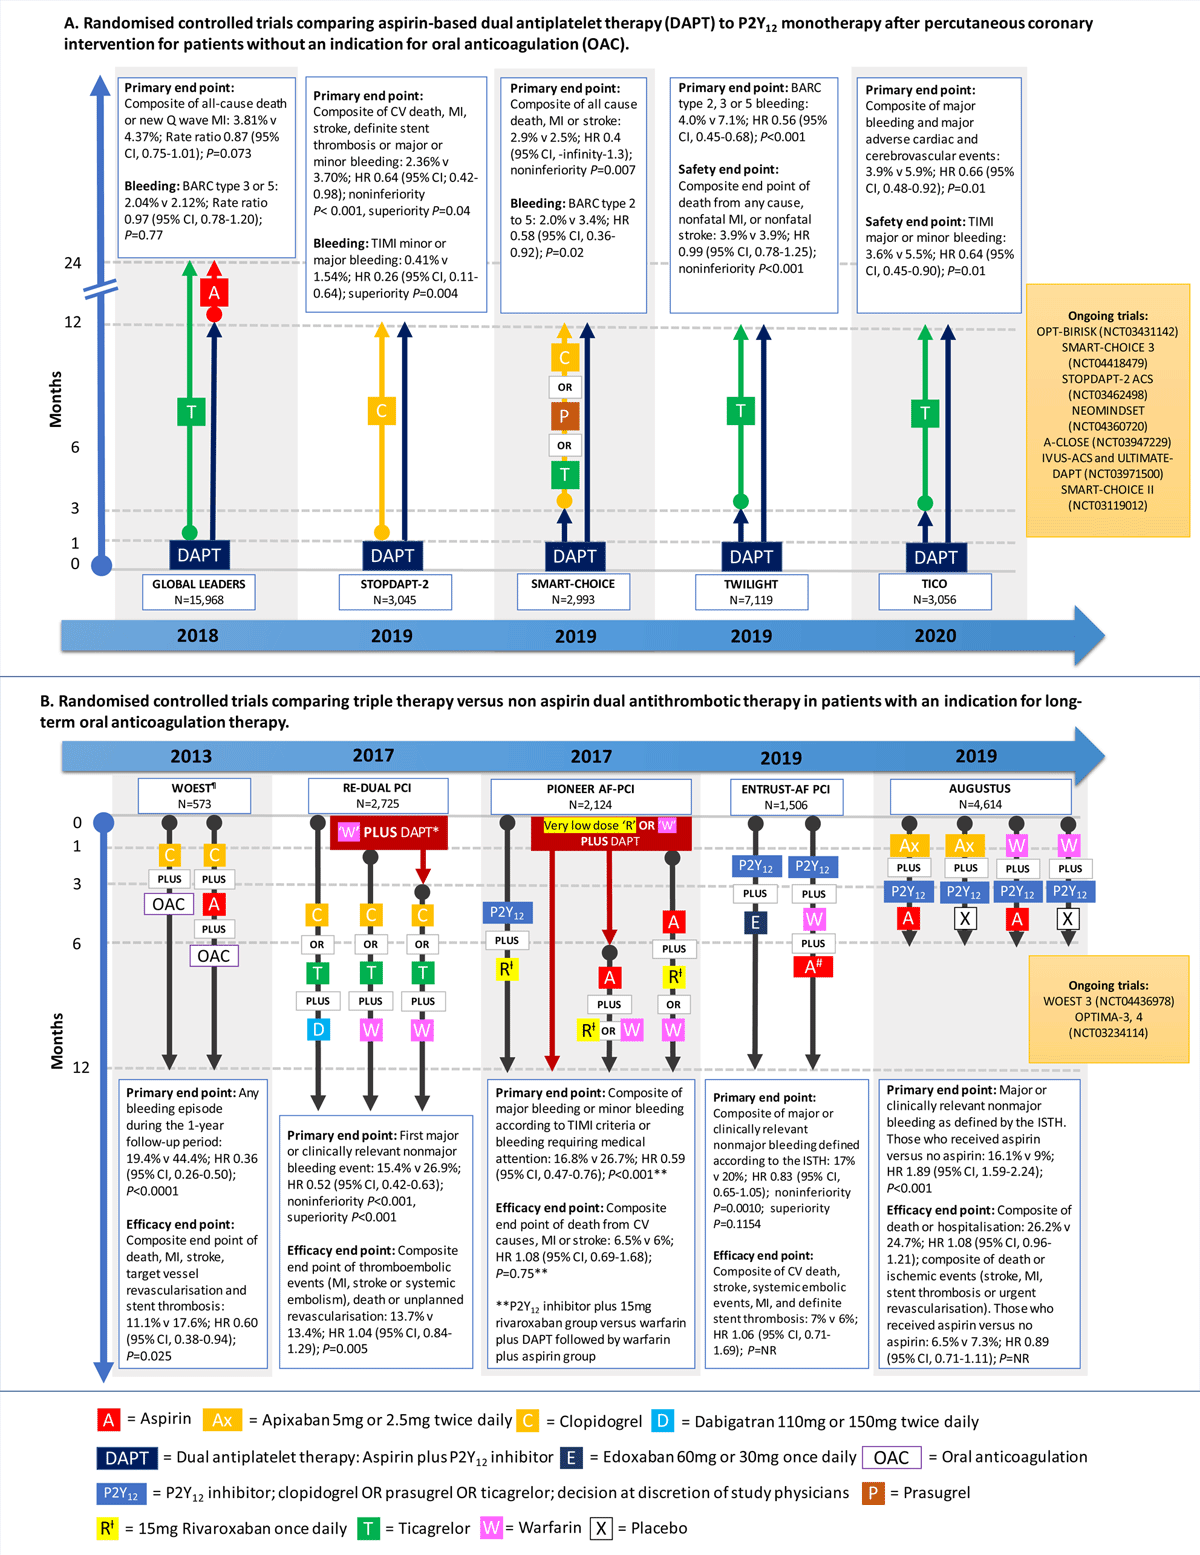
Figure 2
Recent trials assessing aspirin-free strategies following primary percutaneous coronary intervention in patients with and without a dual indication for oral anticoagulation.5,9 NR: not reported; HR: hazard ratio; CI: confidence interval; CV: cardiovascular; ISTH: International Society of Thrombosis and Haemostasis; MI: myocardial infarction; BARC: bleeding academic research consortium; TIMI: thrombolysis in myocardial infarction.
¶ Allocated antiplatelet therapy was continued for at least 1 month, up to 1 year in those with stable coronary disease who received a bare metal stent. The decision on duration was at the discretion of the attending physician. In patients with an acute coronary syndrome or those who received a drug-eluting stent, clopidogrel was continued for at least 1 year.
* Aspirin was continued for 1 month in those with a bare metal stent and 3 months in those with a drug-eluting stent.
# Aspirin was continued for a minimum of 1 month and up to 12 months at the investigator’s discretion.
Very–low-dose rivaroxaban = 2.5 mg twice daily.
Table 1
Major guideline and consensus recommendations for aspirin use in primary and secondary prevention of cardiovascular disease.*12,15,16,17,18 ACS: acute coronary syndrome; AF: atrial fibrillation; ASCVD: atherosclerotic cardiovascular disease; ACC: American College of Cardiology; AHA: American Heart Association; CAD: coronary artery disease; CCS: chronic coronary syndrome; CVD: cardiovascular disease; DAPT: dual antiplatelet therapy; ESC: European Society of Cardiology; MI: myocardial infarction; OAC: oral anticoagulation; PCI: percutaneous coronary intervention; USPSTF: United States Preventive Services Task Force; VTE: venous thromboembolism.
| PRIMARY PREVENTION RECOMMENDATION17 | SECONDARY PREVENTION RECOMMENDATION (FOCUS ON CAD) | ||||
|---|---|---|---|---|---|
| GUIDELINE | YEAR | RECOMMENDATION | GUIDELINE | YEAR | RECOMMENDATION |
| ESC | 2016* | Not recommended in those with no overt signs of cardiovascular disease (III B). | ESC | 201912 202016 | Patients with atrial fibrillation and recent PCI with a concurrent indication for OAC: In AF patients with CCS or ACS who undergo uncomplicated PCI, early cessation (≤ 1 week) of aspirin and continuation of dual therapy with an OAC and a P2Y12 inhibitor (preferably clopidogrel) for up to 6 or 12 months, respectively, is recommended if the risk of stent thrombosis is low or if concerns about bleeding risk prevail over concerns about risk of stent thrombosis (Class I). OAC monotherapy alone is then continued 12 months post PCI.16 |
| USPSTF | 2016 | Recommend aspirin in those aged 50–59 years with ≥ 10% 10-year CVD risk and with no increased bleeding risk (grade: B). | ACC/AHA | 201618 202015 | In patients treated with DAPT, a daily aspirin dose of 75–100 mg is recommended (1B-NR). Aspirin therapy is almost always continued indefinitely in patients with coronary artery disease.18 ACC expert consensus decision pathway for anticoagulant and antiplatelet therapy in patients with AF or VTE undergoing PCI or with ASCVD: For patients requiring both anticoagulation and antiplatelet therapy, we strongly recommend that the default strategy after recent PCI be dual antithrombotic therapy consisting of anticoagulation and a P2Y12 inhibitor (preferably clopidogrel). Anticoagulation monotherapy alone should be continued 12 months post PCI.15 Aspirin 75–100 mg for patients with previous MI or revascularization (I A); consider aspirin in CAD patients without a history of MI but with definitive evidence of CAD on imaging (IIb C).12 |
| ACC/AHA | 2019 | Consider aspirin use in those aged 40–70 years with higher ASCVD risk and with no increased bleeding risk (IIb A). | |||
[i] * Guideline update due 2021.
Table 2
Summary of major primary prevention trials to date. Baseline characteristics represent an average of the complete trial population (ie, both control and treatment arms).17,20,21,22,23,24,25,26,27,28,29,30,31,32,33,34 BMD: British Male Doctors; PHS: Physicians Health Study; TPT: Thrombosis Prevention Trial; HOT: Hypertension Optimal Treatment; PPP: Primary Prevention Project; WHS: Women’s Health Study; POPADAD: Progression of Arterial Disease and Diabetes; JPAD: Japanese Primary Prevention of Atherosclerosis With Aspirin for Diabetes; AAA: Aspirin for Asymptomatic Atherosclerosis; JPPP: Japanese Primary Prevention Project; ARRVIE: Aspirin to Reduce Risk of Initial Vascular Events; ASCEND: A Study of CV Events in Diabetes; ASPREE: Aspirin in Reducing Events in the Elderly; TIPS-3: The International Polycap Study-3; BP: blood pressure; CI: confidence interval; CV: cardiovascular; CVD: cardiovascular disease; BP: blood pressure; ABI: ankle brachial index; GI: gastrointestinal; IHD: ischemic heart disease; LDL-c: low density lipoprotein cholesterol; MI: myocardial infarction; NS: nonsignificant; PPI: proton pump inhibitor; SBP: systolic blood pressure; TIA: transient ischemic attack; UA: unstable angina; UK: United Kingdom; US: United States; BMI: body mass index.
| STUDY | BMD17 | PHS20 | TPT21 | HOT22 | PPP23 | WHS24 | POPADAD25 | JPAD26 | AAA27 | JPPP28 | ARRIVE31 | ASCEND32 | ASPREE33 | TIPS-334 |
|---|---|---|---|---|---|---|---|---|---|---|---|---|---|---|
| Year | 1988 | 1989 | 1998 | 1998 | 2001 | 2005 | 2008 | 2008 | 2010 | 2014 | 2018 | 2018 | 2018 | 2020 |
| No. Participants | 5,139 | 22,071 | 5,085 | 18,790 | 4,495 | 39,876 | 1276 | 2,539 | 3,350 | 14,464 | 12,546 | 15,480 | 19,114 | 5,713 |
| Design | Randomized(computer), unblinded (2:1 randomization in favor of the aspirin group) | Randomized double-blind, placebo-controlled trial 2 × 2 factorial design | Randomized, double-blind, placebo-controlled trial. 2 × 2 factorial design | Prospective randomized double-blind placebo 2 × 2 factorial design | Centrally randomized open-label trial 2 × 2 factorial design | Randomized double-blind placebo- controlled trial 2 × 2factorial design | Randomized double-blind, placebo-controlled trial 2 × 2 factorialdesign | Randomized open-label trial (blinded end point assessment) | Double-blind, randomized controlled trial | Randomized open-label, parallel group | Randomized double-blind, multicenter, placebo-controlled trial | Randomized double-blind, placebo-controlled trial Factorial Design | Randomized double-blind, placebo-controlled trial | Randomized double-blind, placebo-controlled trial with a 2×2×2 factorial design |
| AspirinDose | 300 mg or 500 mg daily aspirin | 325 mg every other day | 75 mg controlled- release aspirin | 75 mg aspirin | 100mg enteric- coated aspirin | 100 mg every other day | 100 mgdaily | 81 mg or 100 mg aspirin daily | 100 mg aspirindaily | Enteric-coated aspirin 100 mg daily | 100 mg enteric-coatedaspirin | 100 mg enteric- coated aspirin | 100 mg enteric-coatedaspirin | Enteric-coated aspirin 75 mg per day |
| Comparison | No aspirin | Placebo | Placebo | Placebo | No aspirin | Placebo | Placebo | No aspirin | Placebo | No aspirin | Placebo | Placebo | Placebo | Placebo |
| Population | Healthy male doctorsin UK between 50–78 years | Healthy male doctors in USages 40–84 years | Men between aged 45 to 69 yearsat high risk for CVD | Men and women aged 50–80years with a diastolic BP between 100 mm Hg and115 mm Hg on two occasions | Men and women ≥ 50with at least one of the major recognized CV riskfactors | Healthy female health professionals ≥45 years | Men and women ≥ 40years with diabetes and ABI ≤ 0.99 | Men and women aged30–85 years w/diabetes | Men and women aged 50–75 years w/ABI ≤ 0.95 | Men and women aged 60–85 years w/hypertension, hyperlipidemia or diabetes | Men aged ≥ 55 years with 2–4 CV risk factors; women aged ≥ 60 years with ≥ 3 CV risk factors | Men and women aged ≥ 40 years with diabetes | Men and women aged ≥ 70 years | Men aged > 50 years and women aged ≥ 55 years with an elevated INTERHEART score (intermediate or high risk) |
| PARTICIPANT CHARACTERISTICS | ||||||||||||||
| Age (%, mean or median) | < 60 = 47% 60–69 = 39% 70–79% = 14% | 40–49 = 41% 50–59 = 34% 60–69 = 19% 70–84 = 7% | Mean: 57.5 years | Mean 62 years | Mean 64 years | Mean55 years | Mean 60 years | Mean 65 years | Mean 62 years | Mean71 years | Mean 64 years | Mean 63 years | 65–73 = 49.9% ≥ 74 = 50.1% | Mean 63.9 years |
| Men | 100% | 100% | 100% | 53% | 42% | 0% | 44% | 54% | 28% | 42% | 70% | 63% | 44% | 47% |
| BMI (kg/m2) | ≥ 26.4 = 25% | 27.4 | 28.4 | 27.6 | 26 | 29.3 | 24 | - | 24.2; BMI > 25 = 79% | 28.4; BMI > 25 = 79% | 30.7; BMI > 25 = 85% | 28.1 BMI > 30 = 30% | 25.8 | |
| Smoker | 31% | 11% | 41% | 16% | 15% | 13% | 31% | 21% | 33% | 13% | 29% | 8% | 3.9 | 9% |
| Hypertension | Mean SBP 135.6 mm Hg | Hypertension (39%) | Mean SBP 139 mm Hg | Mean BP 170/105 mm Hg | Mean BP 145/85 | Hypertension 26% | Mean BP 145/79 mm Hg | Mean BP 135/77 mm Hg; hypertension 58% | Mean 148/84 mm Hg | Mean BP 137/78 mm Hg; hypertension 85% | Mean SBP 145 mm Hg; hypertension 63% | MeanSBP 136 mm Hg | Hypertension (65%) | Mean SBP 145mmHg |
| Hyperlipidemia | – | Cholesterol ≥ 6.7mmol/L (4%) | Mean cholesterol 6.4 mmol/L | Mean cholesterol 6.1 mmol/L | Mean cholesterol 6.1 mmol/L | Cholesterol ≥ 6.2 mmol/L or self-reported physician- diagnosed high cholesterol (30%) | Mean cholesterol 5.5 mmol/L | Mean cholesterol 5.2 mmol/L | Mean cholesterol 6.2 mmol/L | Mean cholesterol 5.2 mmol/L | Hyperlipidemia 58% (> 5.2 mmol/L in men; > 6.2 mmol/L in women) | Mean cholesterol 4.2 mmol/L | Mean cholesterol 5.2%; hyperlipidemia 66% | Mean LDL-c 3.1 mmol/L |
| Diabetes | 2% | 2% | – | 8% | 17% | 3% | 100% | 100% | 3% | 34% | 0% | 100% | 10.8% | 36.7% |
| Statin use (%) | – | – | Potential interaction with warfarin arm, somay have been avoided | – | 16% | – | – | 26% | Lipid-lowering agents (includingstatins) 4% at start, increased to 25% at 5 years | – | 43% | 75% | 34% | 50% (treatment allocation) |
| PPI (%) | – | – | – | – | – | – | – | – | – | – | – | Approx. 25% at trial completion | 25% at trial entry | – |
| OUTCOME DATA | ||||||||||||||
| Follow-up (years) | Median5.5 | Median 5 | Median 6.8 | Mean 3.8 | Mean 3.6 | Mean 10.1 | Median 6.7 | Median 4.4 | Mean 8.2 | Median 5 | Median 5 | Median 7.4 | Median 4.7 | Mean 4.6 |
| Primary end point (aspirin vs control) | Definite MI or stroke resulting in death (63.2 vs 62.3per 10,000 person-years; P= NS) | CV mortality (81 vs83; RR 0.96; 95% CI, 0.6–1.54) | IHD (154 vs 190events; P= .04) Excluding warfarin arm (83 vs 107 events; P= NS) | Major CV events excluding silent MI (315 vs368; RR 0.85; 95% CI, 0.73–0.99; P= .03) | Major CVevents (45 vs 64; RR 0.71; 95% CI, 0.48–1.04) | MajorCV events (477 vs 522; RR 0.91; 95% CI, 0.80–1.03; P= .13) | Major CV (116 vs 117; RR 0.98; 95%CI, 0.76–1.26; P= .86) CV death (43 vs 35; RR1.23; 95% CI, 0.79–1.93 P= .36) | Major CV events (68vs 86; HR 0.80; 95% CI, 0.58–1.10 P= .16) | MajorCV events (13.7 vs 13.3 per 1,000 person-years; HR1.03; 95% CI, 0.84–1.27) | Major CV events (193 vs 207; HR 0.94; 95% CI, 0.77–1.15; P= .54) | Major CV events (269 vs 281; HR 0.96; 95% CI, 0.81–1.13; P= .60) | Major CV events (658 vs 743; RR 0.88; 95% CI, 0.79–0.97; P= .01) | Death, dementia, or persistent physical disability (21.5vs 21.2 per 1,000 person-years; HR 1.01; 95% CI, 0.92–1.11; P= .79) | Death from CV causes, MI, or stroke Aspirin vs placebo (116 vs 134; HR 0.86; 95% CI, 0.67–1.10) |
| Secondary end point (aspirin vs control) | Nonfatal stroke (32.4 vs 28.5 per 10,000 person-years; P= NS) and nonfatal MI (42.4 vs 43.3 per 10,000 person-years; P= NS) | MI (139 vs 239; RR 0.56; 95% CI, 0.45–0.70; P < .0001) Stroke (119 vs 98; RR 1.22; 95% CI, 0.93–1.60; P= .15) | Stroke (47 vs 48; 2.9 vs 3.0 per 1,000 person-years; P= NS) | MI (82 vs 127; RR 0.64; 95% CI, 0.49–0.85; P= .002) Stroke (146 vs 148; RR 0.98; 95% CI, 0.78–1.24; P= .88) CV mortality (133 vs 140; RR 0.95; 95% CI, 0.75–1.20; P= .65) | Total CV events (141 vs 187; RR 0.77; 95% CI, 0.62–0.95); CV death (17 vs 31; RR 0.56; 95% CI, 0.31–0.99); All-cause mortality (62 vs 68; RR 0.81; 95%CI, 0.58–1.13) | Fatal MI (14 vs 12; RR 1.16; 95%CI, 0.54–2.51; P= .70) Fatal stroke (23 vs 22; RR1.04; 95% CI, 0.58–1.86; P= .90) CV death (120 vs126; RR 0.95; 95% CI, 0.74–1.22; P= .68) | All-causemortality, nonfatal MI, other vascular events: no significant difference betweengroups | CV mortality (1 vs 10; HR 0.10; 95% CI, 0.01–0.79; P= .0037) CHD events (28 vs 35; HR 0.81; 95% CI, 0.49 -1.33; P= .40) | Composite of primary endpoint or angina, claudication, or TIA (22.8 vs 22.9 per1,000 person-years; HR 1.00; 95% CI, 0.85–1.17) and all-cause mortality | Composite of primary end point or atherosclerosis (280vs 319; HR 0.89; 95% CI, 0.75–1.04; P= .14); CVdeath (58 vs 57; HR 1.03; 95% CI, 0.71–1.48; P= .89) | Composite and individual outcomes of the time to CVdeath, MI, or stroke; time to UA, time to TIA, and time to death (P= NS for all end points) | Any major vascular event (833 vs 936; RR 0.88; 95%CI, 0.80–0.97); GI cancer (157 vs 158; RR 0.99; P= NS) | Major CV events (10.7 vs 11.3 per 1,000 person-years; HR 0.95; 95% CI, 0.83–1.08) | Death from CV causes, MI, or stroke or cancer (153 vs 177; HR 0.86; 95% CI, 0.69–1.07) |
| Safety end point (aspirin vs control) | Extracranial bleeding (10.6 vs 7.4 per 10,000 person-years; P= NS) | Bleeding requiring transfusion (48 vs 28; RR 1.71; 95% CI, 1.09–2.69; P= .02) | Major bleeding event (8 vs 4; P= NS); intermediate bleeding event (48 vs 33; P= NS) | Fatal bleeds (7 vs 8); nonfatal major bleeds (129 vs 70; RR 1.8; P < .001) | Severe bleeding (24 vs 6; P < .0008) | GI bleeding requiring transfusion (127 vs 91; RR 1.40; 95% CI, 1.07–1.83; P= .02) | GI bleeding (28 vs 31; RR 0.90; 95% CI, 0.53–1.52; P= .69) | Hemorrhagic stroke or severe GI bleeding (10 vs 7; P= NS) | Major hemorrhage requiring hospitalization (34 vs 20; HR 1.71; 95% CI, 0.99–2.97) | Extracranial bleed requiring transfusion or hospitalization (62 vs 34; HR 1.85; 95% CI, 1.22–2.81; P= .0004) | GI bleeding events (61 vs 29; HR 2.11; 95% CI, 1.36–3.28; P= .0007) | Major bleeding event (314 vs 245; RR 1.29; 95% CI, 1.09–1.52; P= .003) | Major hemorrhage (8.6 vs 6.2 per 1,000 person-years; HR 1.38; 95% CI, 1.18–1.62; P < .0001) | Major bleeding (21 vs 19), minor bleeding (17 vs 14), and GI bleeding (12 vs 10) |