
Video 1
Parasternal long-axis view focused on the aortic valve demonstrating marked leaflet thickening and restricted systolic opening of a trileaflet aortic valve without overt valvular calcification; see also at https://vimeo.com/1207815788.
Video 2
Apical three-chamber view of simultaneous two-dimensional imaging (left panel) and color Doppler interrogation (right panel) demonstrating turbulent systolic flow across the aortic valve consistent with hemodynamically significant aortic stenosis. Mild aortic regurgitation is also present; see also at https://vimeo.com/1207819149.
Video 3
Parasternal short-axis view demonstrating a trileaflet aortic valve with markedly restricted leaflet excursion and asymmetric leaflet thickening despite minimal visible valvular calcification; see also at https://vimeo.com/1207820076.
Video 4
Parasternal long-axis view demonstrating preserved left ventricular systolic function and severe restriction of aortic valve opening. Despite a suboptimal acoustic window, progressive severe aortic stenosis is evident; see also at https://vimeo.com/1207821147.
Table 1
Serial echocardiographic assessment of aortic stenosis severity. TEE: transesophageal echocardiography; TTE: transthoracic echocardiography
| TIME POINT | MODALITY | AORTIC VALVE AREA (CM2) | MEAN GRADIENT (MM HG) |
|---|---|---|---|
| First visit | TTE | 0.9 | 32 |
| Subsequent 2-months visit | TEE | 1.2 | 24 |
| Subsequent 6-months visit | TTE | 1 | 34 |
| Subsequent 12-months visit | TTE | 0.79 | 41 |
| Subsequent 6-months visit | TTE | 0.85 | 40 |
| Intraoperative | TEE | 0.92 | 43 |
| Subsequent 6-months visit | TTE | - | 6 |
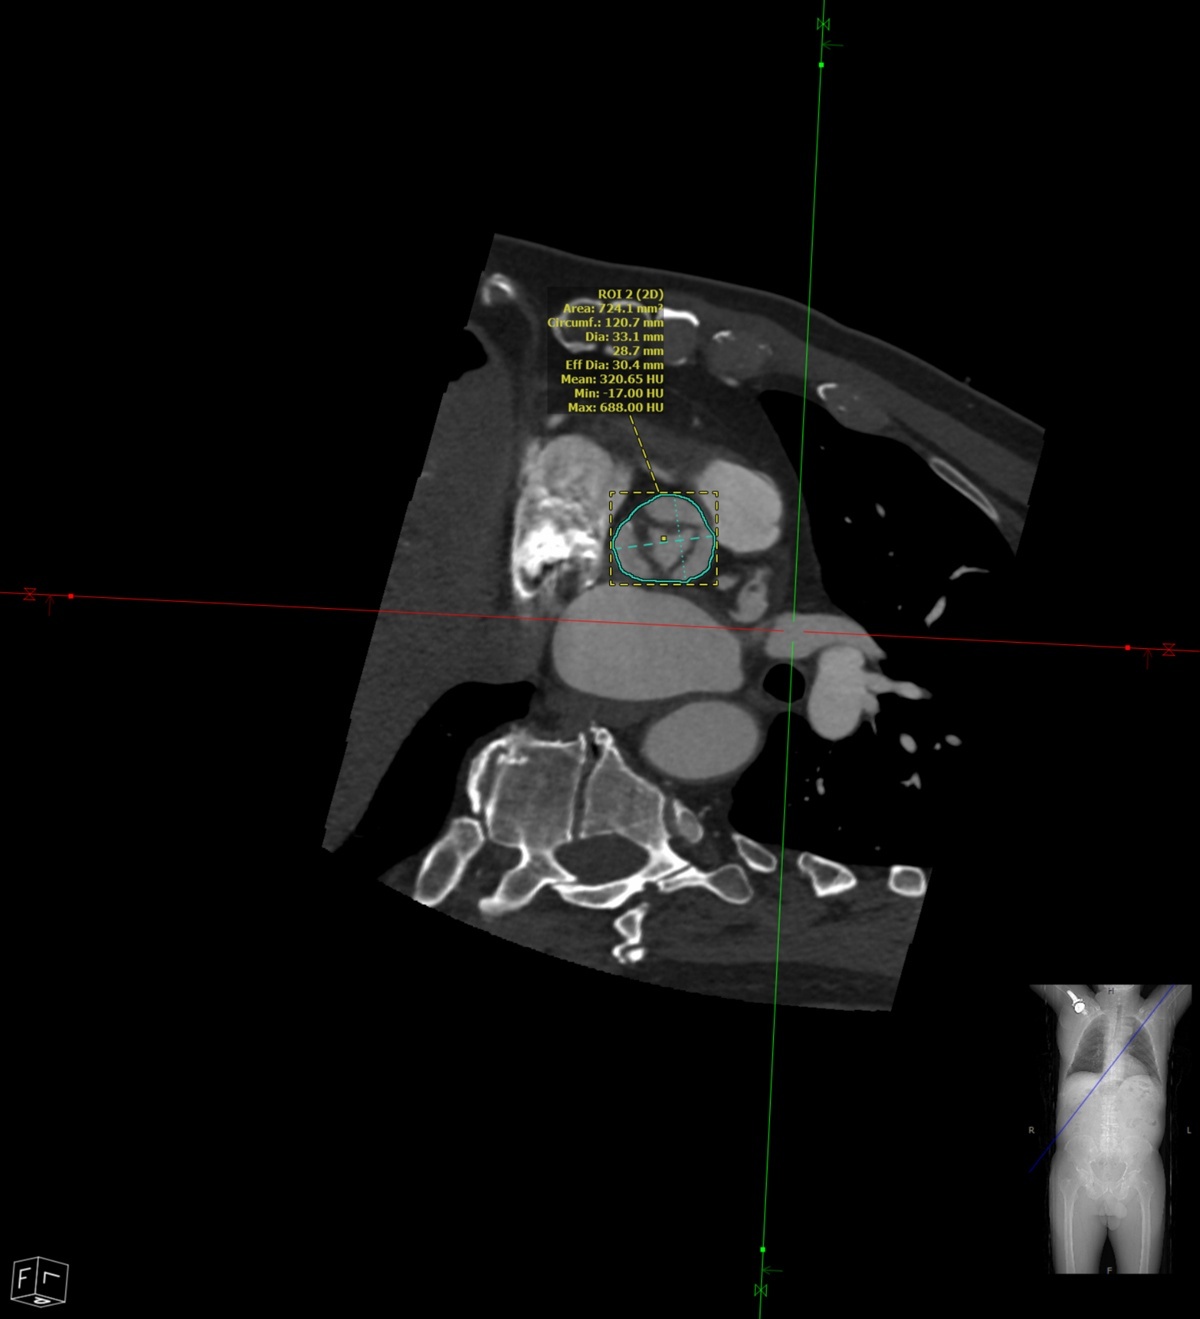
Figure 1
Cardiac computed tomography angiogram cross-sectional image demonstrating focal minimal calcification of the aortic valve (circled).
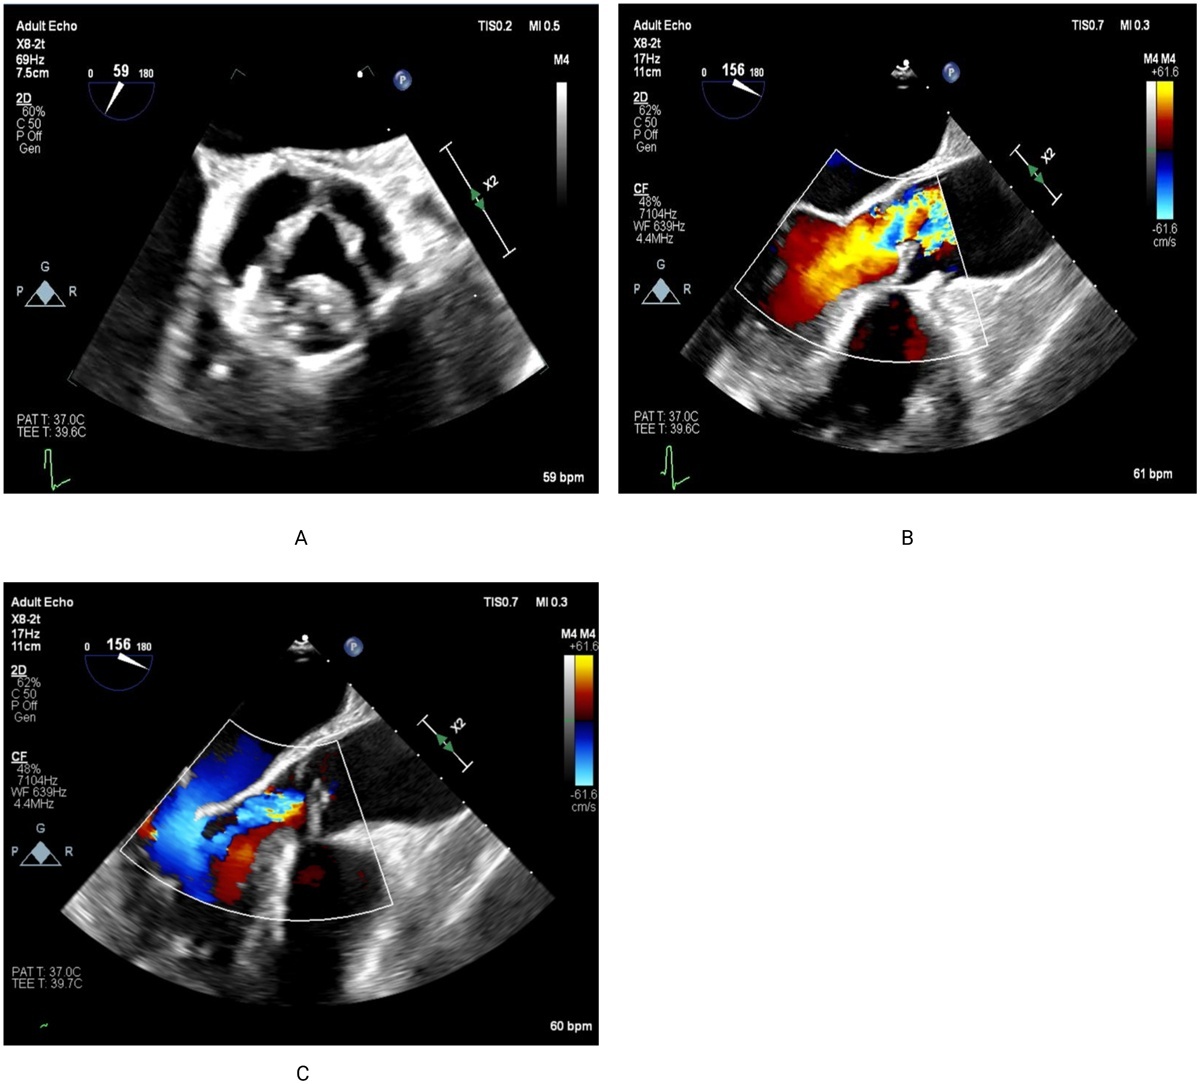
Figure 2
Transesophageal echocardiography findings. (A) Short-axis view of the aortic valve in systole demonstrating restricted leaflet opening with severe leaflet remodeling. (B) Long-axis view demonstrating aliasing at the level of the aortic valve before surgical intervention. (C) Long-axis view showing moderate aortic regurgitation.
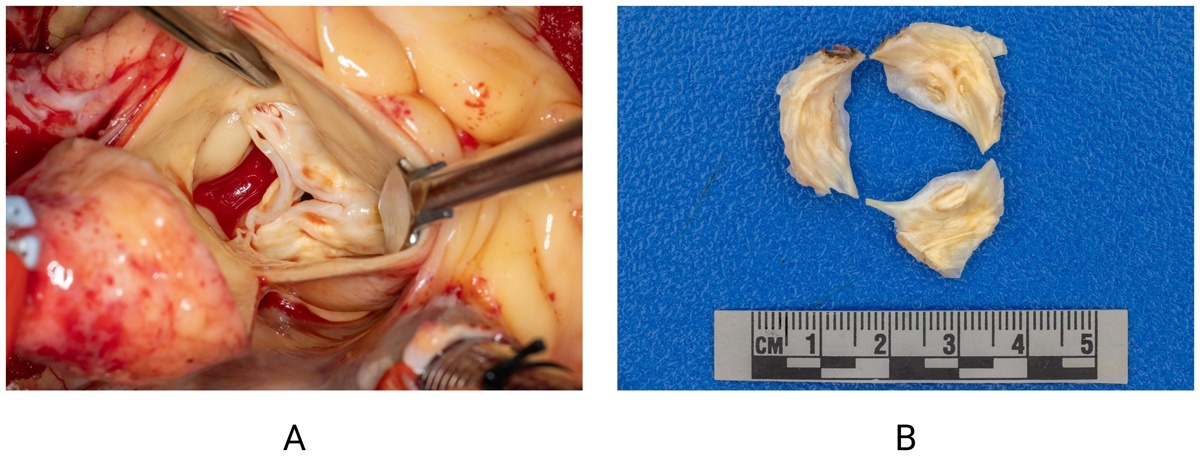
Figure 3
Surgical and pathological evaluation of the native aortic valve. (A) Intraoperative view of the aortic valve showing severe stenosis characterized by fibrotic thickening and degenerative changes of the leaflets. (B) Histopathological specimen of the aortic valve showing fibrotic changes with minimal calcification.