
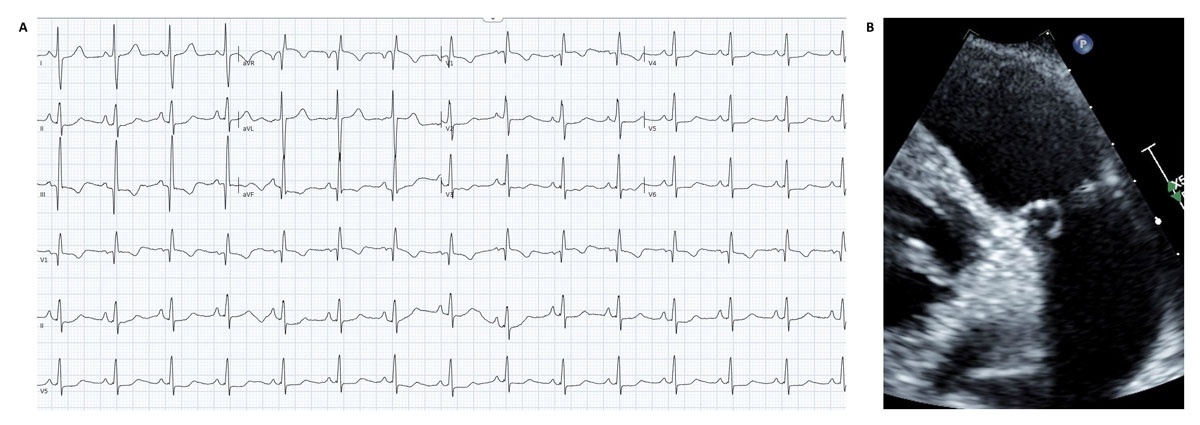
Figure 1
(A) Electrocardiogram after cardioversion demonstrating normal sinus rhythm with right axis deviation and right ventricular hypertrophy. (B) Echocardiogram frame (enlarged) during mid-systole showing thickened pulmonary valve leaflets with doming.
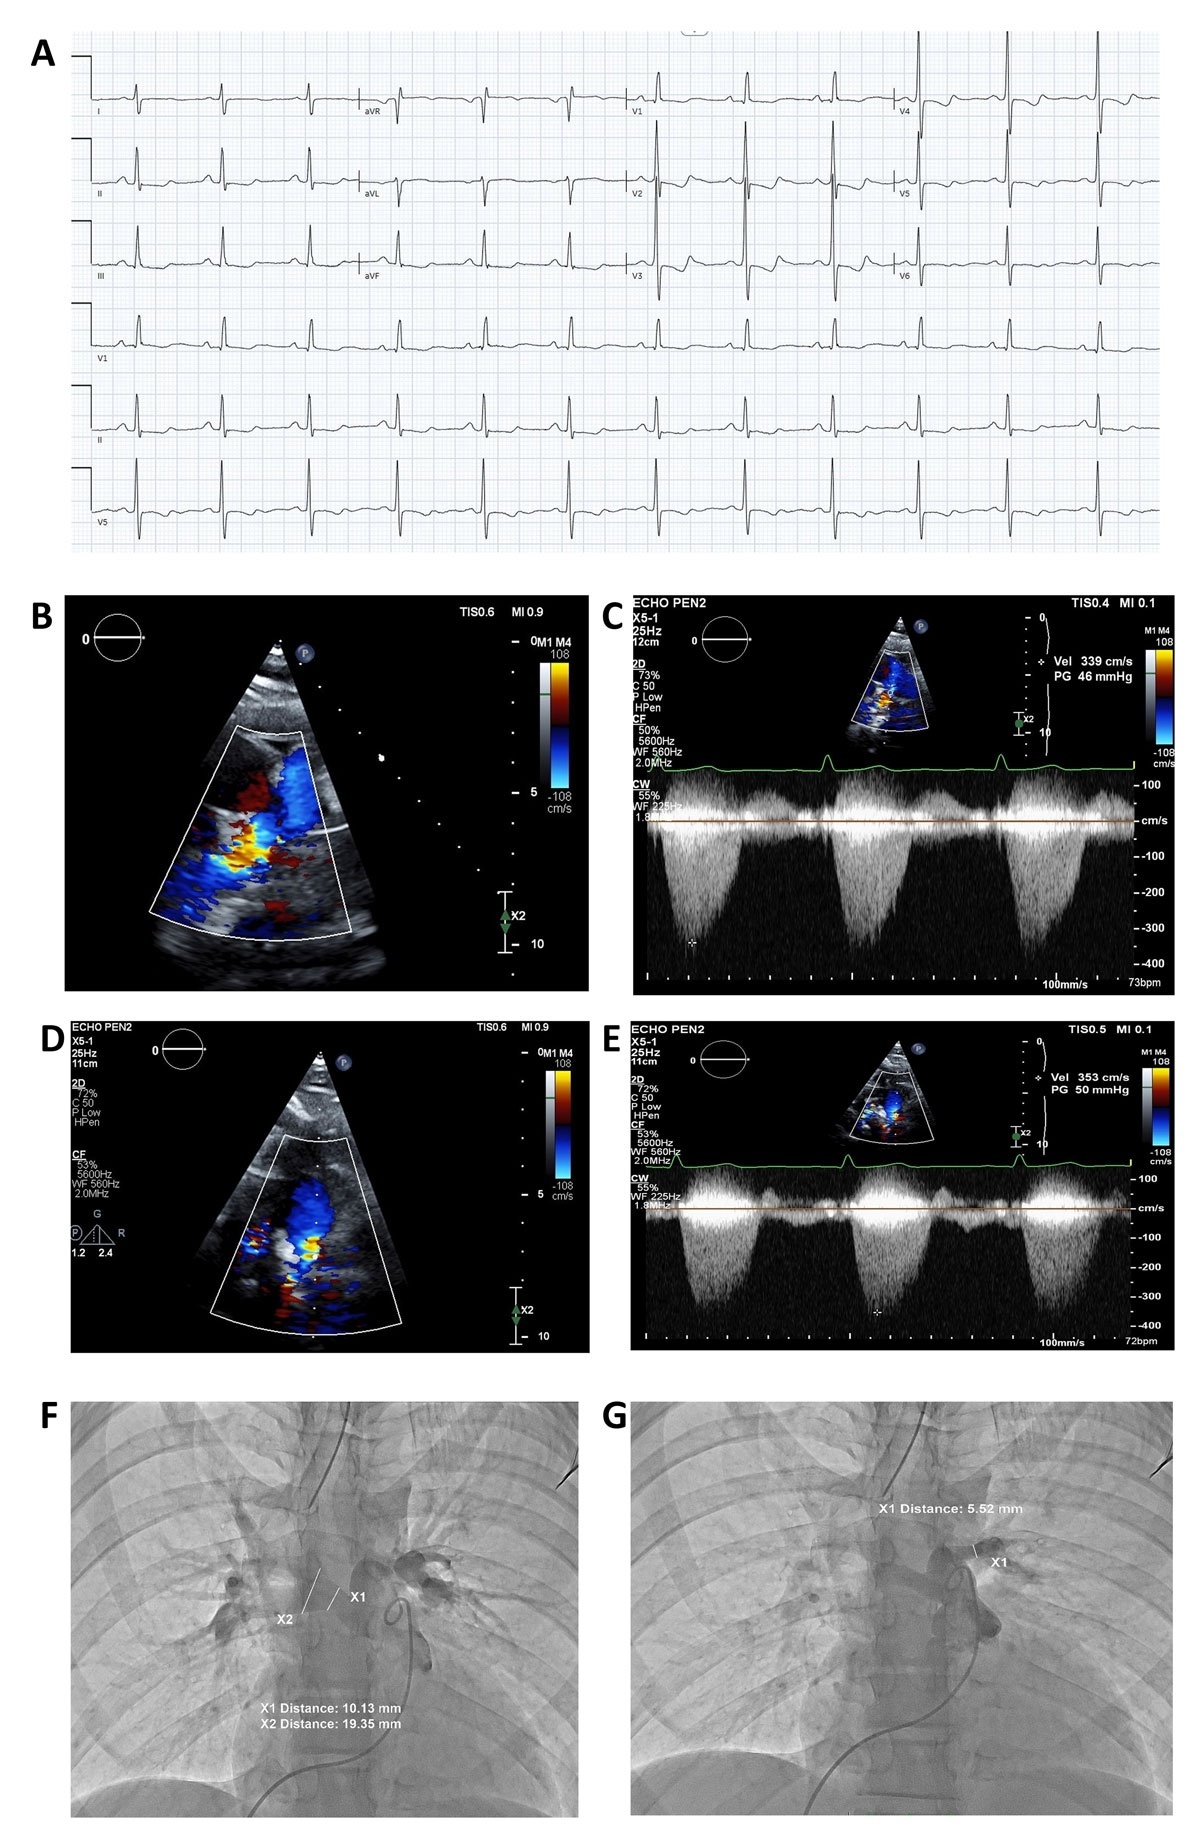
Figure 2
(A) Electrocardiogram demonstrates normal sinus rhythm with incomplete right bundle branch block and right ventricular hypertrophy. (B) Echocardiographic frame shows flow acceleration with color Doppler of the long axis of the right pulmonary artery. (C) Echocardiographic frame shows continuous wave Doppler of the long axis of the right pulmonary artery with peak velocity of 3.39 meters per second and peak gradient of 46 mm Hg. (D) Echocardiographic frame shows flow acceleration with color Doppler of the long axis of the left pulmonary artery. (E) Echocardiographic frame shows continuous wave Doppler of the long axis of the left pulmonary artery with peak velocity of 3.53 meters per second and peak gradient of 50 mm Hg. (F) Angiographic frame (anterior-posterior projection) shows injection of pigtail catheter into the main pulmonary artery with measurement of the proximal right pulmonary artery of 10.13 mm and distal right pulmonary artery of 19.35 mm. (G) Angiographic frame (anterior-posterior projection) shows injection of pigtail catheter into the main pulmonary artery with measurement of the proximal left pulmonary artery of 5.52 mm.
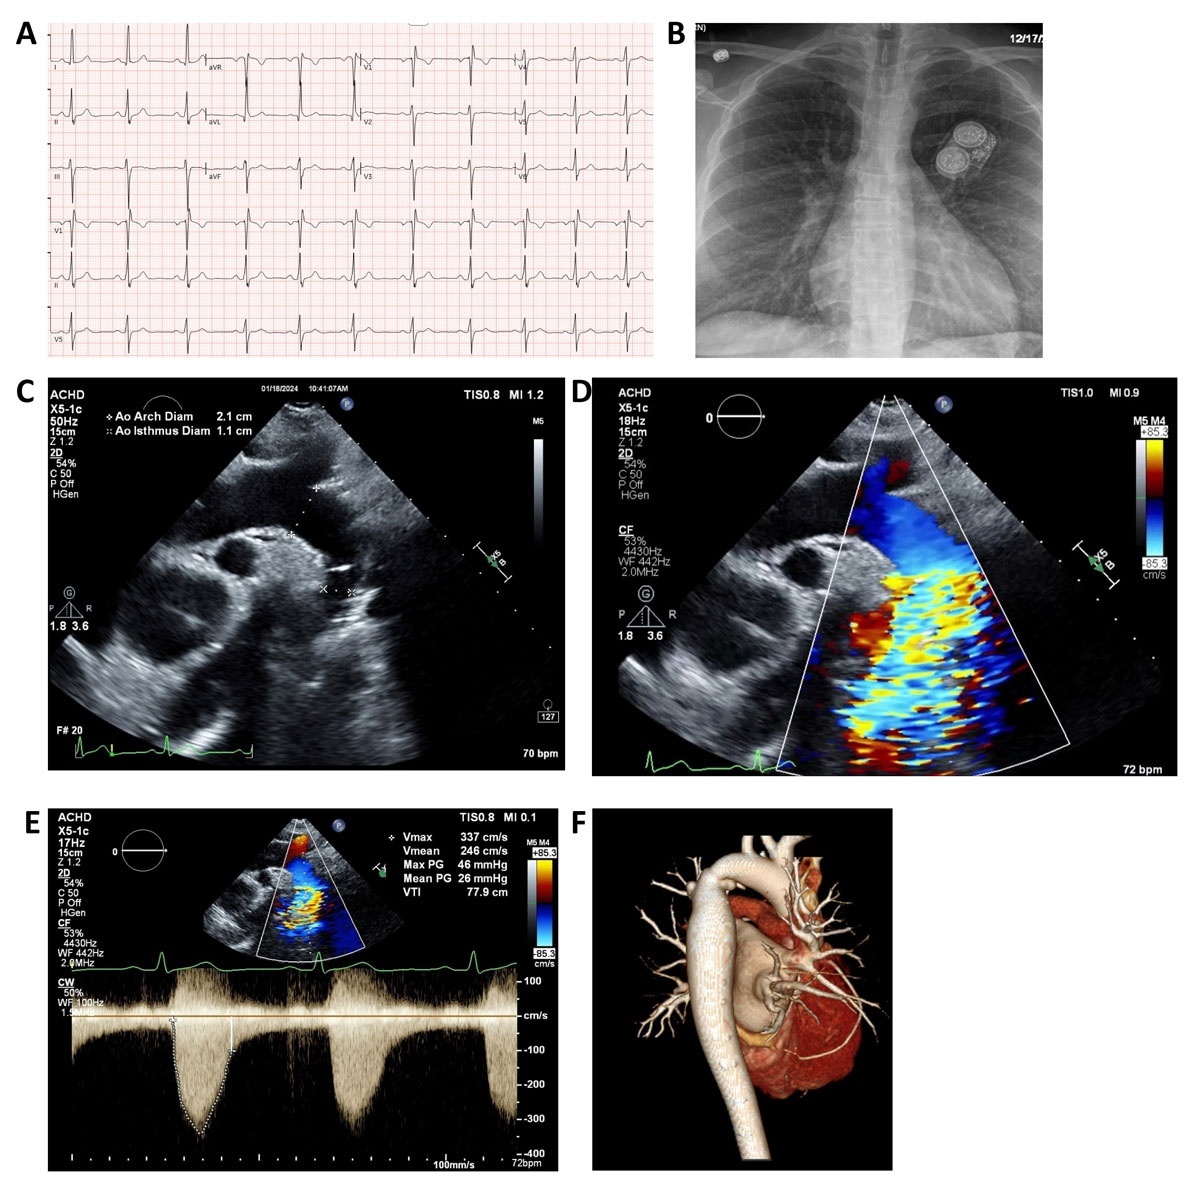
Figure 3
(A) Electrocardiogram demonstrating normal sinus rhythm with left atrial enlargement and left ventricular hypertrophy. (B) Chest x-ray (anterior-posterior projection) with “figure 3” sign showing dilated left subclavian artery and aortic arch (upper curve), site of coarctation of the aorta (middle curve), and post-stenotic dilation of the descending thoracic aorta (lower curve). (C) Echocardiogram frame of the long axis of the aortic arch (diameter 2.1 cm) and area of coarctation (diameter 1.1 cm). (D) Echocardiogram frame of the long axis of the aortic arch showing flow acceleration in the distal arch/area of coarctation by color Doppler. (E) Echocardiogram frame showing continuous wave Doppler flow in the area of coarctation with peak velocity 3.37 meters per second and peak gradient 46 mm Hg. (F) Three-dimensional reconstruction of cardiac magnetic resonance angiography (posterolateral projection) demonstrating area of coarctation.
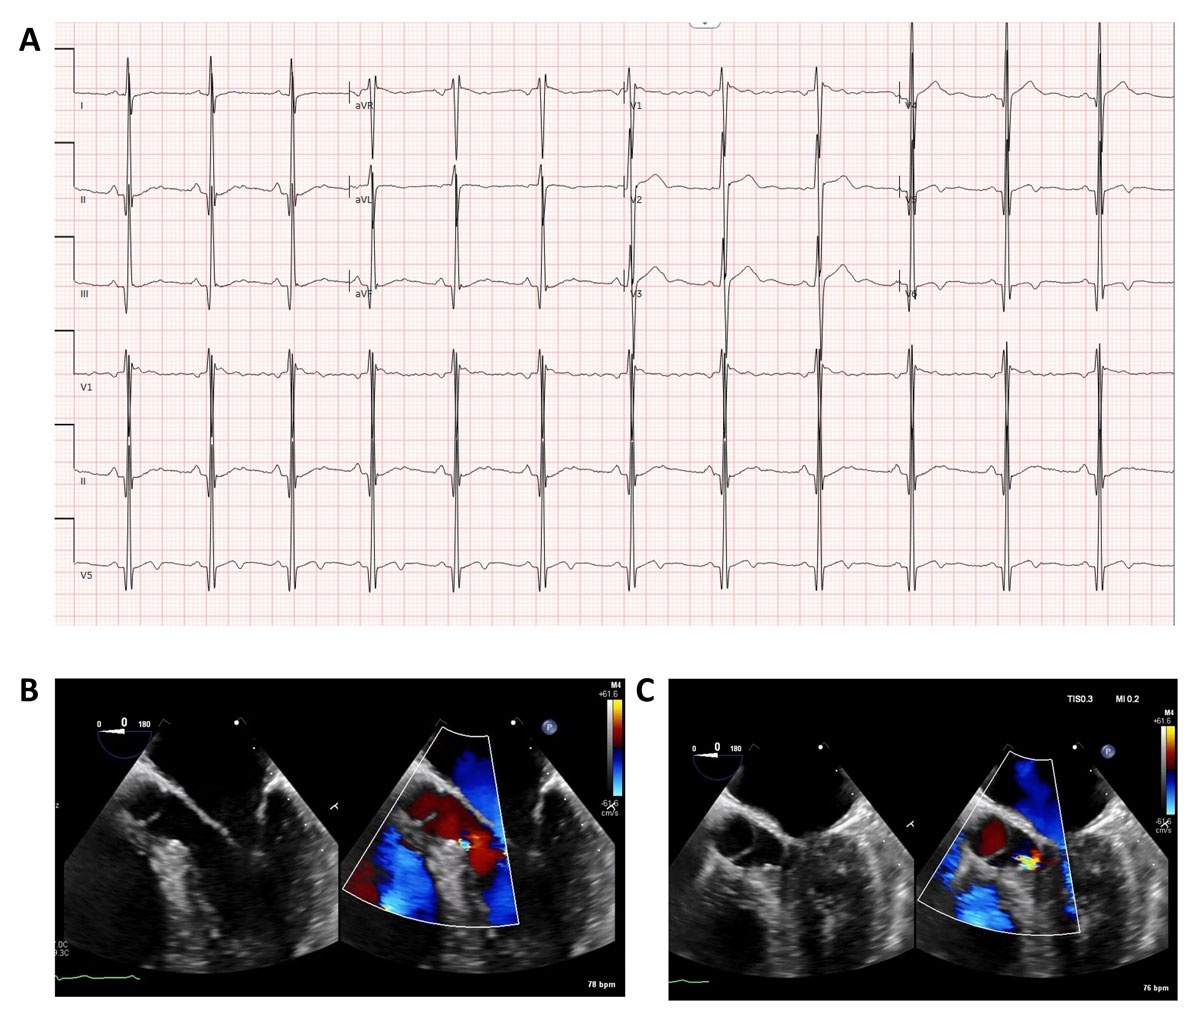
Figure 4
(A) Electrocardiogram demonstrating normal sinus rhythm, left axis deviation, and left ventricular hypertrophy with strain pattern. (B) Transesophageal echocardiogram frame from the mid-esophageal view showing flow acceleration by color Doppler within the left ventricular outflow tract in end-systole. (C) Transesophageal echocardiogram frame from the mid-esophageal view showing flow acceleration by color Doppler within the left ventricular outflow tract in early systole.