
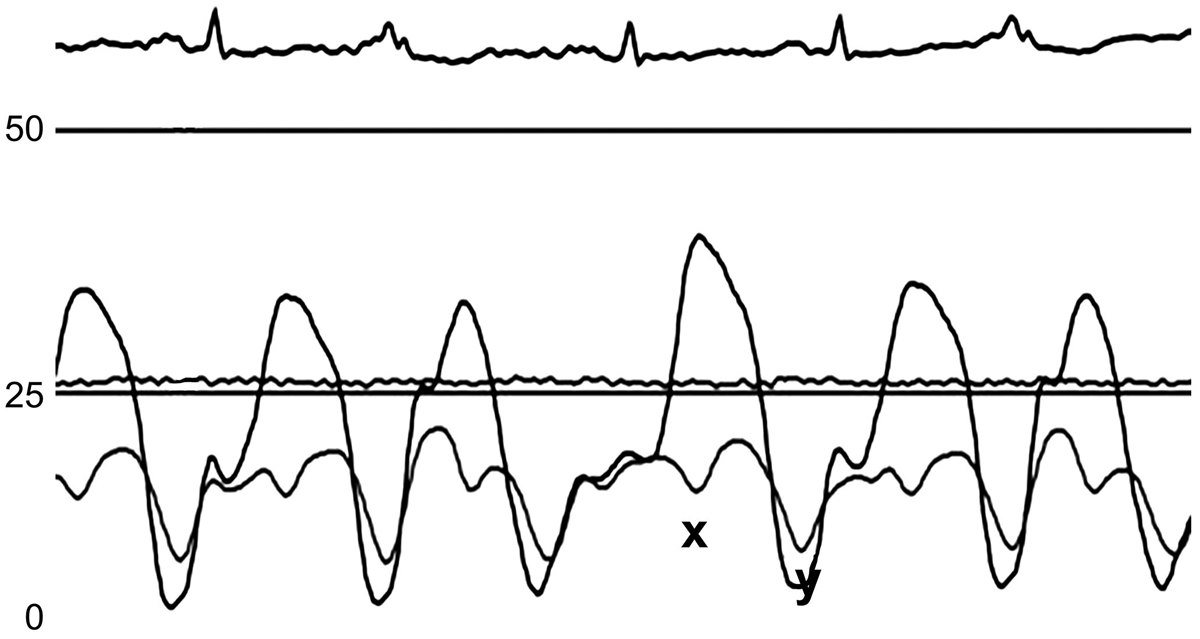
Figure 1
Right atrial and right ventricular pressure tracing of constrictive pericarditis. Right atrial pressure has prominent “x” and “y” descent with elevated right atrial and right ventricular diastolic pressure.
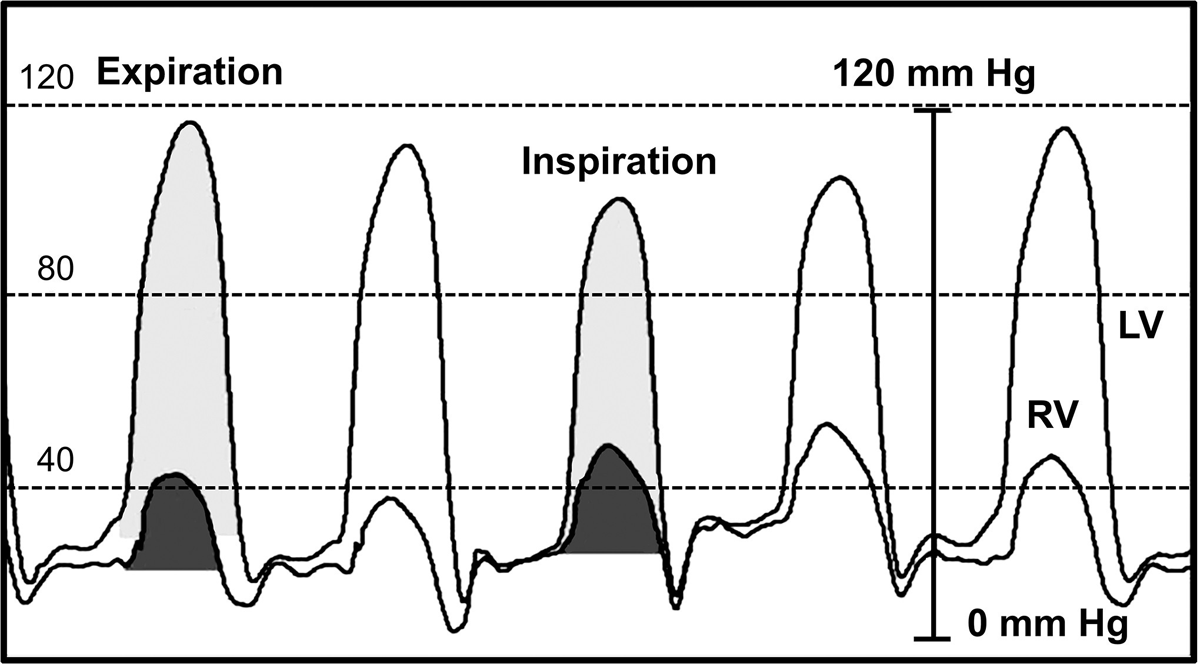
Figure 2
Simultaneous left ventricle (LV) and right ventricle (RV) pressure tracings with discordant pressure changes with respiration. Shaded area of LV and RV indicate systolic area index. Adapted from Talreja et al., JACC 2008;51(3)
Table 1
Specificity of the hemodynamic findings in constrictive pericarditis. MV: mitral valve; IVC, inferior vena cava; LV: left ventricular; RV: right ventricular; PCWP: pulmonary capillary wedge pressure; LVEDP: left ventricular end diastolic pressure
| MODALITY | MORE SPECIFIC | LESS SPECIFIC |
|---|---|---|
| Echocardiography | Hepatic vein expiratory diastolic flow reversals | MV inflow variation |
| Elevated septal e’ | Septal bounce | |
| Respirophasic septal shift | IVC plethora | |
| Annulus reversus | ||
| Hemodynamic catheterization | LV/RV Δ systolic area index during respiration | Diastolic pressure equalization |
| Aorta/pulmonary artery ejection time variation | “Square root sign” | |
| Respiratory variation in LV filling PCWP-LVEDP | Rapid x and y descent |
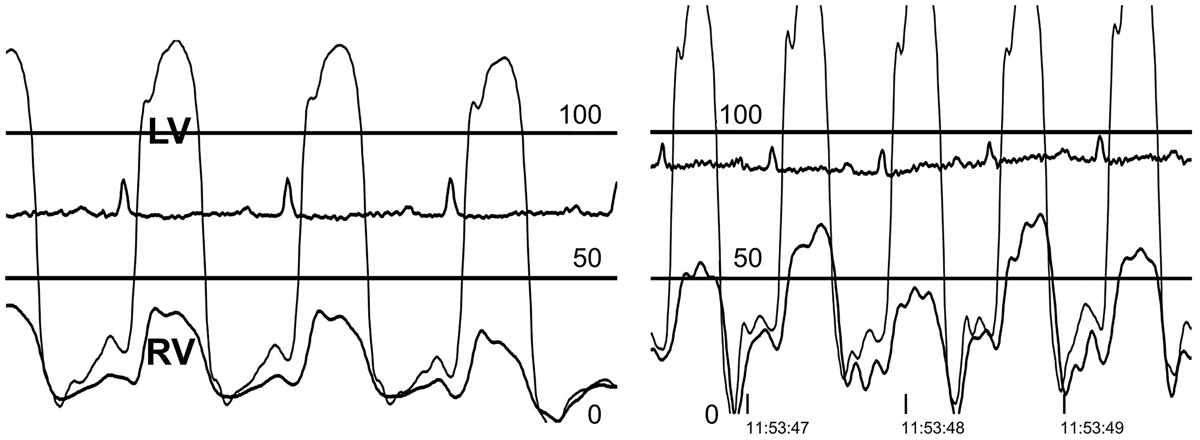
Figure 3
Resting (left) and exercise (right) simultaneous left ventricle (LV) and right ventricle (RV) pressure tracing in a 55-year-old male with constrictive pericarditis whose main symptom was exertional dyspnea. RV end-diastolic pressure is not increased nor is equalized with left ventricular end diastolic pressure (LVEDP) at rest, but with exercise (right), there is a rapid rise of both left and right diastolic pressure, although there continues to be some difference in EDP between the LV and RV. LVEDP remains higher than RVEDP due to localized left heart constrictive pericarditis.
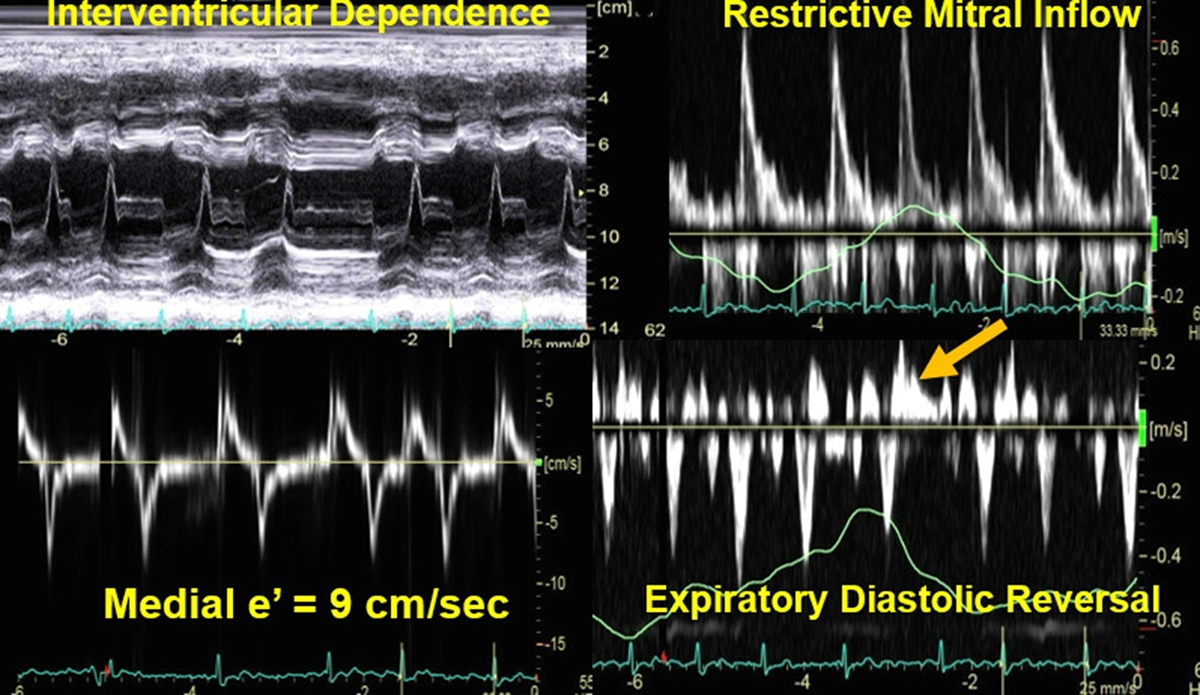
Figure 4
A composite of 2D and Doppler echocardiography parameters demonstrating “Mayo Clinic Echocardiographic Diagnostic Criteria” for constrictive pericarditis. These parameters include (1) interventricular dependence shown by ventricular septal motion change with respiration, best seen by M mode echocardiogram (upper left), (2) restrictive mitral inflow with or without respiratory variation (upper right), (3) medial mitral annulus velocity ≥ 9 cm/sec (bottom left), and (4) expiratory diastolic flow reversals in hepatic vein (bottom right). These features work in atrial fibrillation, as shown, as well as in sinus rhythm.
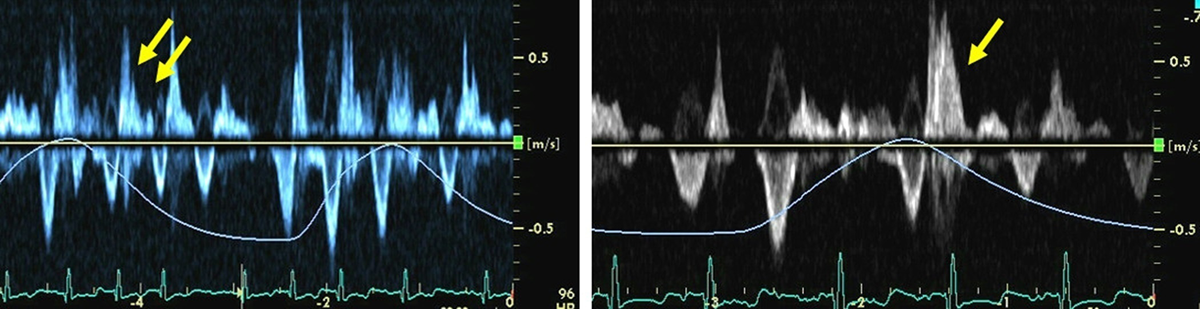
Figure 5
Hepatic vein Doppler in a patient with constrictive pericarditis and atrial fibrillation at baseline (left) and after cardioversion (right). Due to rapid heart rate, expiratory hepatic vein flow reversal happens during systole (arrows, left). Few hours later after cardioversion to sinus rhythm, repeat Doppler echocardiogram shows a prominent expiratory flow reversals during diastole (arrow, right).
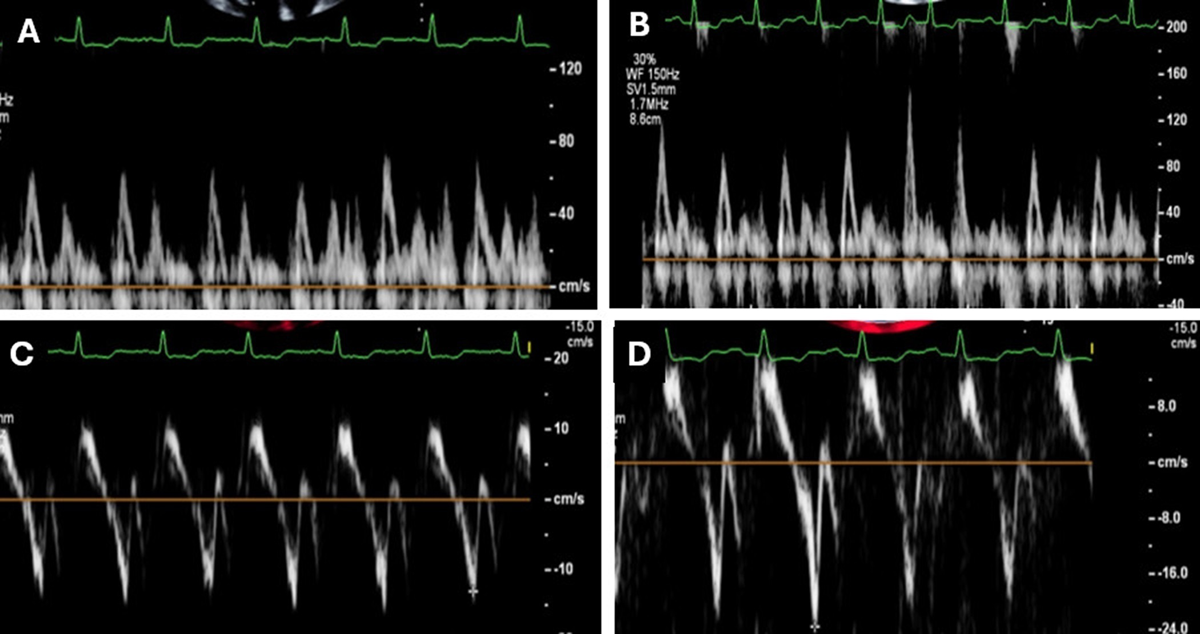
Figure 6
Exercise Doppler echocardiogram with demonstration of worsening constrictive physiology. Mitral inflow at rest with minimal respiratory variation (A) with significant inflow variation following exercise (B). Mitral septal e’ with exaggerated values at rest (C; 0.13 m/s), increasing post-exercise (D; 0.23 m/s).
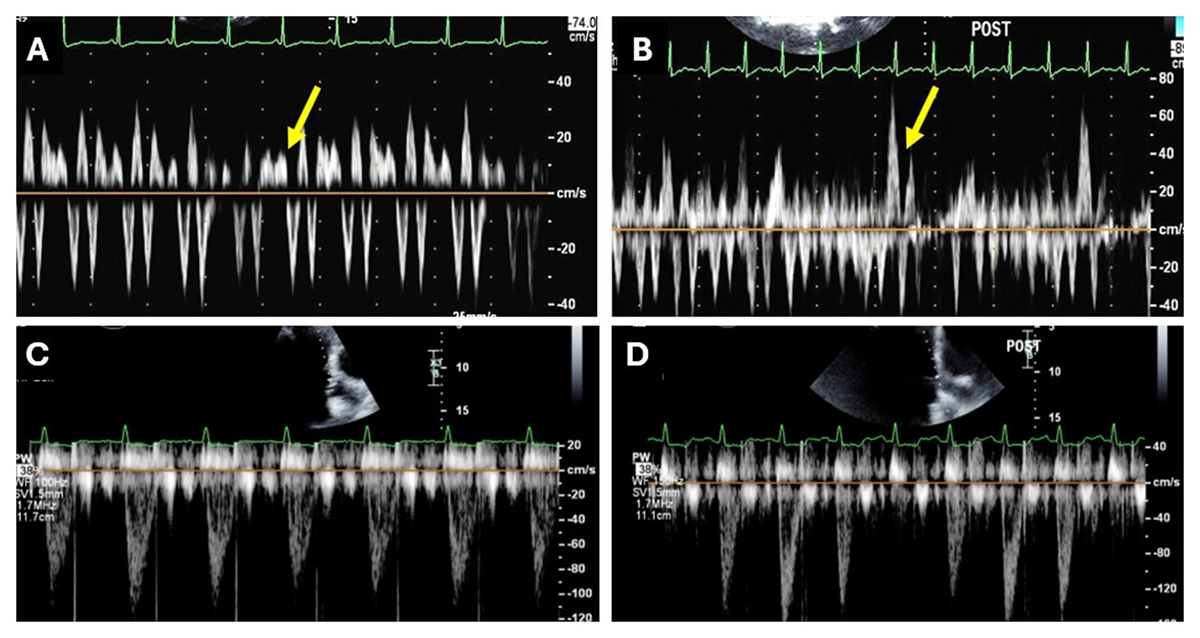
Figure 7
Hepatic vein expiratory diastolic flow reversals (arrow) at rest (A) with accentuation and elevated reversal velocity post-exercise (B). Left ventricular outflow tract pulse wave Doppler evaluation demonstrating minimal fluctuations in cardiac output at rest (C) becoming more evident following exercise (D).
Video 1
Demonstration of increased ventricular interdependence during exercise echocardiography. A respirophasic septal shift is seen at rest (A) with more dynamic motion following exercise (B). Also see Video 1A at https://vimeo.com/1162247129/2ccdf31d27 and Video 1B at https://vimeo.com/1162248382/d5cb3b7dfc.