
Introduction
Constrictive pericarditis is a condition of diastolic heart failure with significant hemodynamic consequences. This entity, which is potentially curable by pericardiectomy or anti-inflammatory medication, remains a diagnostic challenge, particularly during early manifestation of disease and when physiologically confounding comorbidities are present. As constrictive pericarditis is a “curable” type of diastolic heart failure, accurate and timely diagnosis is crucial, especially given the life-altering impacts of untreated disease. Although constrictive pericarditis is usually caused by a thick and/or calcified pericardium, some patients may have normal pericardial thickness, especially after cardiac surgery, and the diagnosis should be based on the underlying hemodynamics. In this focused review, we aim to describe the characteristic and diagnostic hemodynamics of constrictive pericarditis as well as the utility of invasive (hemodynamic cardiac catheterization) and noninvasive (echocardiography) diagnostic testing for this complex disease entity.
Hemodynamics of Constrictive Pericarditis
Normal Physiology
The pericardium is a two-layered tissue structure surrounding the heart, providing anatomic support within the mediastinal cavity.1, 2 In normal physiology, during each respiratory cycle, intrathoracic pressures decrease (5-10 mm Hg) with inspiration and increase with expiration. A compliant pericardium allows these pressure changes to be translated directly to the nearby cardiac chambers.3 As a result, right-sided intracardiac pressures in the right atrium (RA) and right ventricle (RV) decrease relative to the extrathoracic vena cava during inspiration, alongside increased abdominal pressure during inspiration, resulting in increased blood flow into these chambers. The left heart chambers, the left atrium (LA) and left ventricle (LV), do not experience a significant respirophasic alteration in blood flow during inspiration because the pulmonary veins, returning blood to the left heart from the lungs, are intrathoracic and are subject to the same intrathoracic pressure changes as the LA and LV.4 With increased RV filling compared to LV filling during inspiration, a compliant pericardium accommodates this extra blood volume by allowing the RV free wall to expand, minimizing its impact on the LV. This intrathoracic pressure coupling of the cardiac chambers is crucial to maintain consistent LV filling and cardiac output during each respiratory phase.
Constrictive Physiology
In constrictive disease, a fibrinous pericardium loses its compliance, creating a hard shell around the cardiac chambers.5 As a result, this hardened exterior has less flexibility to accommodate changes in blood volume within the cardiac chambers (particularly the RV), and does not effectively translate intrathoracic negative pressure to the cardiac chambers, decoupling/isolating the heart from the pressure changes in the surrounding thoracic cavity.6, 7 In turn, the filling pressures throughout the entire heart are subsequently equalized unless constriction is localized or superimposed by myocardial dysfunction, which may result in discrepant filling pressures between LV and RV. As a result of these exterior tissue changes, the RV fills rapidly (as a result of high RA driving pressure) and experiences an abrupt increase in pressure as the RV free wall outpouching is no longer accommodated by the stiff, fibrinous pericardium. With the increased RA pressure, blood flow from inferior vena cava enters the RA preferentially over the superior vena cava with the help of increased abdominal pressure during inspiration (Kussmaul sign).
The left ventricle, on the other hand, experiences decreased filling with inspiration. Since the extra-pericardial pulmonary veins are still subject to intrathoracic pressure changes, decreased intrathoracic pressure during inspiration is translated to the pulmonary veins, resulting in a decreased veins-to-ventricle pressure gradient. This decreased gradient, paired with increased LA/LV pressures from the shell-like pericardium, results in decreased left-sided chamber filling.6, 7 With a noncompliant pericardium opposing the RV free wall and decreased LV filling with inspiration, the interventricular septum bows into the LV. This leads to a marked decrease in systemic cardiac output during inspiration, and a paradoxical increase of pulmonary systolic pressures relative to systemic systolic pressures during inspiration, resulting in opposite changes in LV and RV systolic pressure.
The opposite is true during expiration: as the intrathoracic pressure increases, there is higher driving pressure from the extrapericardial pulmonary veins into the left heart chambers, resulting in increased blood flow. This increased filling of the LV relative to the RV leads to interventricular septal motion into the RV, resulting in decreased RV and RA filling in expiration. This also results in blood flow reversing back to the inferior vena cava and hepatic vein during diastole with expiration. This series of hemodynamic consequences from a stiff pericardium impacting biventricular filling is termed ventricular interdependence, which is a hallmark finding in pericardial disease.4
Cardiac Catheterization—Strength and Pitfalls of the Gold Standard
In the original descriptions of constrictive pericardial disease, the hemodynamic consequences of a stiffened pericardium are well documented.8, 9 However, many of the early hemodynamic findings in construction were also seen in myocardial diseases such as cardiac amyloidosis.10
Right Atrial and Right Ventricular Pressure
In diastole, with high driving pressure from the right atrium, blood rapidly enters the RV in early diastole, resulting in a steep, exaggerated y-descent on RA pressure tracings. This type of a rapid y-descent is not seen in tamponade since RV stretching is limited throughout the entire diastole. The nadir of y-descent corresponds to the timing of the pericardial knock on physical examination. RA pressure rises rapidly after the y-descent, which continues until early systole, when RA relaxation reduces RA pressure producing x-descent to a lesser extent than the prominent y-descent (Figure 1). The diseased, stiffened pericardium inhibits RV compliance (ie, free-wall outpouching to accommodate volume load) and causes a rapid increase in the right-sided RV diastolic pressures. Thus, the hallmark findings of constrictive pericarditis on RA pressure tracings (and similarly jugular venous pulsation waveforms) are rapid, steep x- and y-descents with rapid upsloping creating “W” form, as first shown in 1946 (Figure 1).8, 9 In some cases, a thickened, fibrous pericardium may adhere to the right-sided heart chambers, which may impact the classic appearance of this pressure tracing, blunting the x-descent.
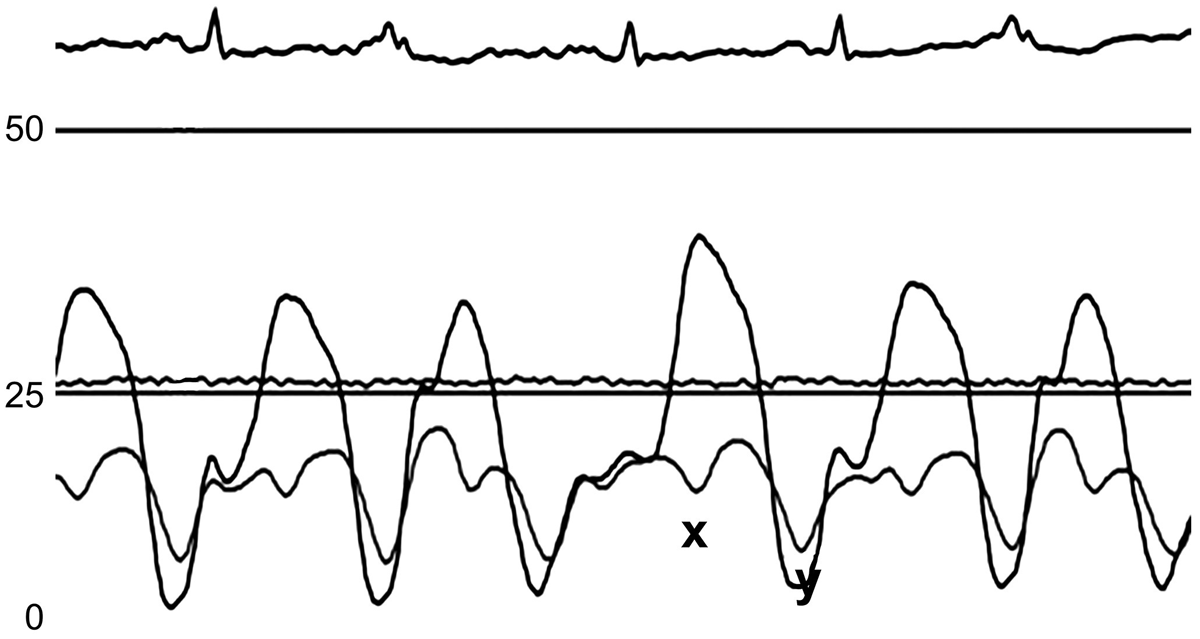
Figure 1
Right atrial and right ventricular pressure tracing of constrictive pericarditis. Right atrial pressure has prominent “x” and “y” descent with elevated right atrial and right ventricular diastolic pressure.
Right and Left Ventricular Pressure
Simultaneous RV and LV catheterization is crucial in making the diagnosis of constrictive pericarditis by identifying ventricular interdependence.11 In diastole, the RV and LV experience rapid filling with an abrupt pressure increase resulting in a “square root sign” or “dip and plateau” pressure tracing—reflecting elevated intracardiac filling pressures due to noncompliance.11 However, similar changes can be seen in a restrictive cardiomyopathic process.10 Through simultaneous RV and LV pressure recording, RV and LV output can be estimated using the systolic area index (SAI). With constrictive physiology, SAI decreases in the LV and increases in the RV during inspiration. This is due to decreased LV filling (decreased gradient between pulmonary veins and left heart chambers) and interventricular septal bowing into the LV cavity as intrathoracic pressures decrease.
In contrast, during expiration, the LV SAI increases and RV SAI decreases due to increased LV filling and bowing of the interventricular septum into the RV as a result of increased intrathoracic pressures (Figure 2).11 These changes in right- and left-sided cardiac output with respiration are a clear demonstration of ventricular interdependence with constrictive physiology. This phenomenon is also seen as the opposite change in peak systolic pressure with respiration between the LV and the RV. While these measurements are highly sensitive and specific for diagnosing constrictive disease, this type of comprehensive invasive hemodynamic study in the cardiac catheterization laboratory requires expertise in intracardiac pressure measurement.
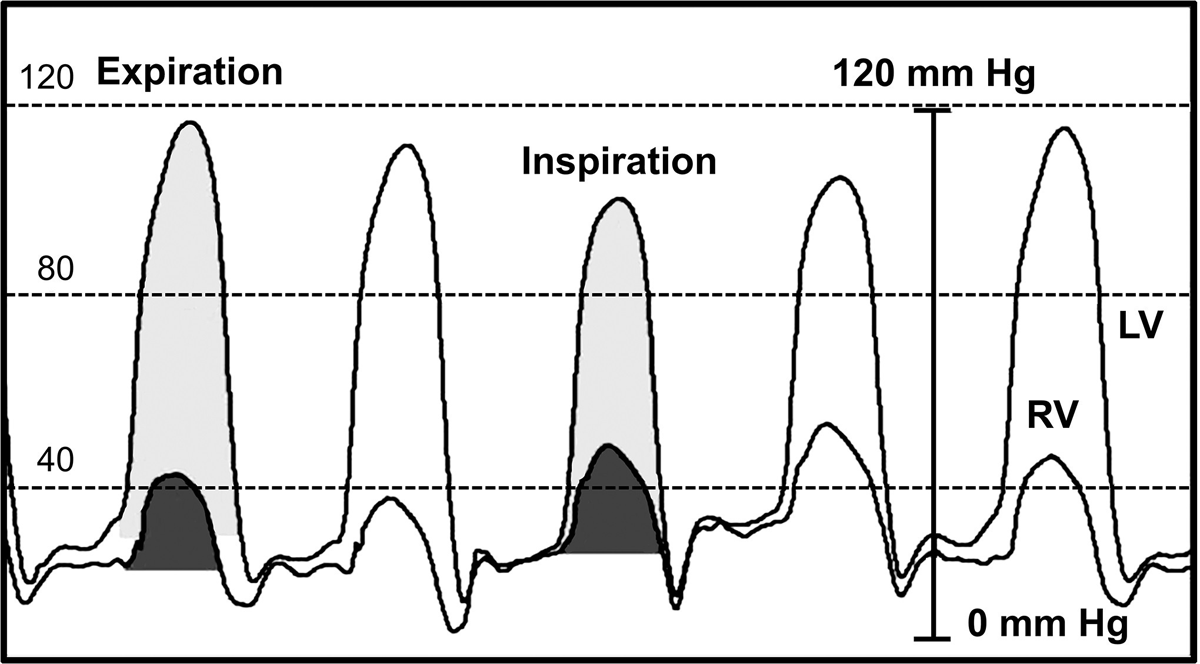
Figure 2
Simultaneous left ventricle (LV) and right ventricle (RV) pressure tracings with discordant pressure changes with respiration. Shaded area of LV and RV indicate systolic area index. Adapted from Talreja et al., JACC 2008;51(3)
Fortunately, a simplified hemodynamic evaluation may help bridge this practice gap. Jain et al. proposed a comparison of pulmonary artery (PA) and aortic (Ao) systolic ejection times (ET) as surrogates for right and left cardiac output, respectively.12 Similar to alterations in RV and LV SAI, constrictive pericarditis patients will exhibit similar variance in PA and Ao ETs throughout the respiratory cycle: PA ET will increase with inspiration and Ao ET will decrease, reflecting the relative increase of right heart output compared to left heart output during inspiration in constriction. The opposite also holds true during expiration, with increasing Ao ET and decreasing PA ET. This methodology offers a surrogate evaluation for ventricular interdependence, making this hemodynamic evaluation feasible at facilities with limited invasive practices.12
Right Atrial Pressure and Pulmonary Capillary Wedge Pressure Ratio
Since constrictive pericardial disease may not occur in isolation (primary disease originates at and involves only the pericardial tissue), it is exceptionally challenging to determine the hemodynamic impact of concurrent myocardial disease alongside constriction (or mixed constrictive pericarditis). Yang et al. investigated the hemodynamic relationship between RA pressure (a surrogate of pericardial pressure) and pulmonary capillary wedge (PCW) pressure (a surrogate of LV end diastolic pressure) to assess this pericardial-myocardial hemodynamic interplay.13 It was found that the RA/PCW pressure ratio was positively correlated with pericardial thickness, and an elevated RA/PCW ratio (≥ 0.77) correlated well with echocardiographic findings of constrictive disease (ie, elevated mitral annulus e’, decreased E/e’ ratio) and improved survival following pericardiectomy.13
Similarly, a low RA/PCW ratio (< 0.77) suggested increased hemodynamic impact from a secondary myocardial process, correlating with echocardiographic findings to support superimposed myocardial/restrictive disease (ie, decreased mitral annulus e’, increased E/e’ ratio, increased mitral inflow E velocity) on constrictive physiologic findings.13 This lower ratio group had minimal change in survival following pericardiectomy. As such, this hemodynamic evaluation can help distinguish the hemodynamic impact of these separate but closely intertwined disease states. The higher the ratio of RA/PCW pressure correlated with a greater possibility of pure or primary constriction (as opposed to mixed constrictive pericarditis). It was, therefore, found that medial mitral annulus e’ velocity is one of the best prognostic parameters after pericardiectomy—the higher, the better.14
Nonspecific Hemodynamic Findings
While many of these invasive hemodynamic criteria are very specific for constrictive disease, some hemodynamic findings may be present in other cardiac pathology (Table 1). Both restrictive cardiomyopathy and constrictive pericarditis have accentuated y-descents with “square root signs” in RA and RV pressure tracings, respectively.4, 10 The exaggerated RA x-descent in constrictive disease may not be observed if arrhythmias, such as atrial fibrillation, are present, limiting the diagnostic specificity of this finding. Similarly, diastolic equalization of pressures may be present in both constrictive pericarditis and restrictive cardiomyopathy as well as in other hemodynamically significant pathology (ie, cardiac tamponade).4 Moreover, end-diastolic pressure may not be equalized in localized constrictive pericarditis (Figure 3). Finally, in early or treated (hypovolemic) constrictive disease, these hemodynamic findings may not be reliably present.15 As such, exercise (as the first choice) or a fluid challenge may be necessary to characterize the hemodynamic impact of a noncompliant pericardium on ventricular filling.
Table 1
Specificity of the hemodynamic findings in constrictive pericarditis. MV: mitral valve; IVC, inferior vena cava; LV: left ventricular; RV: right ventricular; PCWP: pulmonary capillary wedge pressure; LVEDP: left ventricular end diastolic pressure
| MODALITY | MORE SPECIFIC | LESS SPECIFIC |
|---|---|---|
| Echocardiography | Hepatic vein expiratory diastolic flow reversals | MV inflow variation |
| Elevated septal e’ | Septal bounce | |
| Respirophasic septal shift | IVC plethora | |
| Annulus reversus | ||
| Hemodynamic catheterization | LV/RV Δ systolic area index during respiration | Diastolic pressure equalization |
| Aorta/pulmonary artery ejection time variation | “Square root sign” | |
| Respiratory variation in LV filling PCWP-LVEDP | Rapid x and y descent |
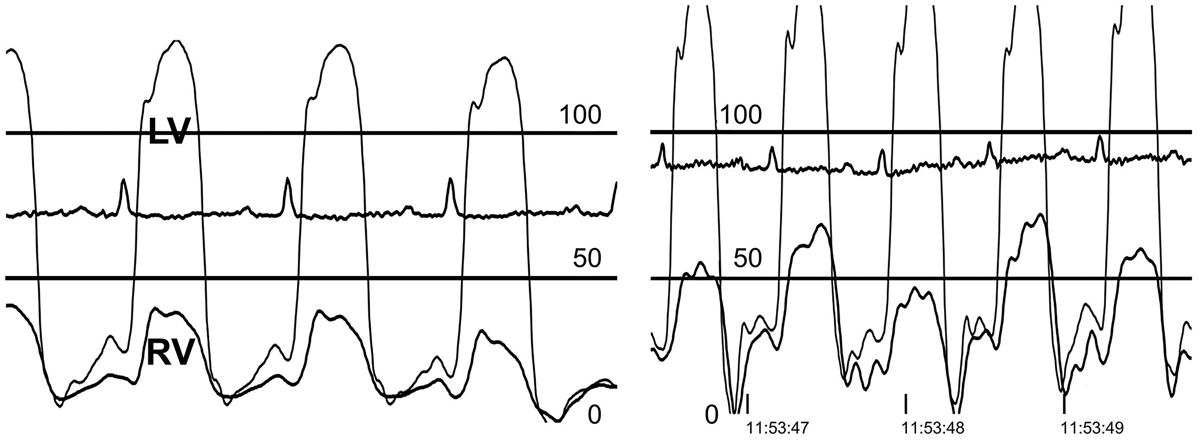
Figure 3
Resting (left) and exercise (right) simultaneous left ventricle (LV) and right ventricle (RV) pressure tracing in a 55-year-old male with constrictive pericarditis whose main symptom was exertional dyspnea. RV end-diastolic pressure is not increased nor is equalized with left ventricular end diastolic pressure (LVEDP) at rest, but with exercise (right), there is a rapid rise of both left and right diastolic pressure, although there continues to be some difference in EDP between the LV and RV. LVEDP remains higher than RVEDP due to localized left heart constrictive pericarditis.
Echocardiography and Constrictive Disease
With the advancements of 2-dimensional (2D) and Doppler transthoracic echocardiography, the physiology of constrictive pericarditis has been further characterized.16, 17,18 The unique hemodynamic characteristics of constriction provide diagnostic Doppler and echocardiographic features on which the Mayo Clinic echocardiographic criteria for constrictive pericarditis was established as discussed below (Figure 4).18
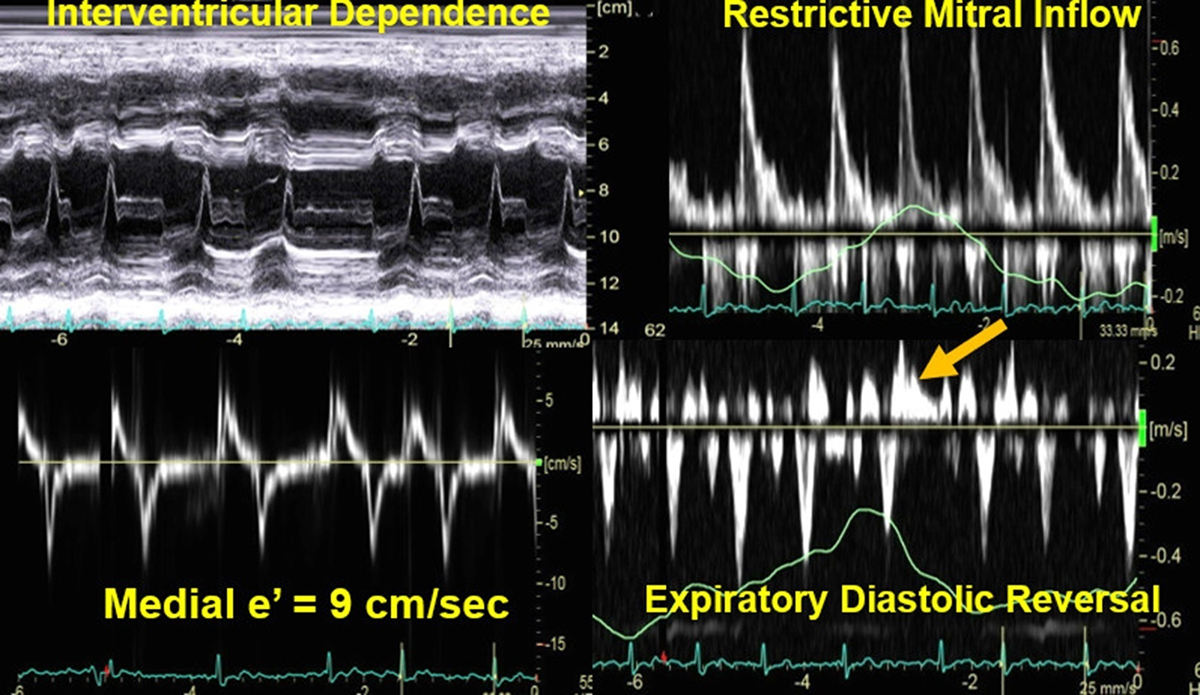
Figure 4
A composite of 2D and Doppler echocardiography parameters demonstrating “Mayo Clinic Echocardiographic Diagnostic Criteria” for constrictive pericarditis. These parameters include (1) interventricular dependence shown by ventricular septal motion change with respiration, best seen by M mode echocardiogram (upper left), (2) restrictive mitral inflow with or without respiratory variation (upper right), (3) medial mitral annulus velocity ≥ 9 cm/sec (bottom left), and (4) expiratory diastolic flow reversals in hepatic vein (bottom right). These features work in atrial fibrillation, as shown, as well as in sinus rhythm.
Ventricular Interdependence
The above-described ventricular interdependence can be nicely observed with extended (10+ heartbeat) views of the RV and LV cavity from the parasternal or apical windows. The use of a respirometer can help correlate the interventricular septal motion during inspiration (motion toward the LV) and expiration (motion toward the RV); M-mode echocardiography can similarly be helpful with its increased temporal resolution compared to 2D imaging (Figure 4, upper left). Alongside respirophasic interventricular septal motion, another phenomenon, known as a diastolic septal “bounce” or “shudder” is frequently observed in these constrictive cases, which is the result of the timing differential of early rapid filling between RV and LV with pericardial constraint.19 While not included in the Mayo Clinic echocardiographic criteria for constrictive pericarditis due to its lack of specificity, it is another sign supporting the presence of pericardial constriction in the correct clinical context.18
Right and Left Heart Filling
In constrictive pericarditis, the respirophasic impact on left and right heart filling can be directly observed by echocardiography. As left heart filling is decreased during inspiration, a corresponding decrease in mitral inflow early diastolic velocity, E, can be observed. As left heart filling subsequently increases with expiration, a mitral inflow E velocity variation of 25% or greater with respiration is seen. However, the respiratory variation can be smaller than the initial report or can even be absent, especially when LV filling pressure is markedly elevated. Under these circumstances, preload reduction by positional change or sublingual nitroglycerin can increase the respiratory variation.20
Conversely, the right-sided heart chambers experience decreased filling with expiration (when LV filling is greater) and increased filling with inspiration. This dynamic respiratory impact on RV inflow is demonstrated by a significant increase in tricuspid inflow velocity with inspiration. A tricuspid inflow velocity increase of greater than 40% during inspiration is usually seen, but this metric is not used for the diagnosis of constriction since there is always some degree of respiratory variation in tricuspid inflow velocity in normal subjects. While the respiratory variation in mitral inflow velocities can help characterize the interventricular-dependent nature of constrictive pericarditis, it can also happen in conditions with exaggerated respiratory effort as seen in severe pulmonary disease (ie, chronic obstructive pulmonary disease). This potential confounder can be distinguished since exaggerated respiratory efforts will cause a significant increase in the superior vena cava systolic flow velocity (≥ 40 cm/sec) during inspiration.21
Early Diastolic Mitral Annulus Velocity (e’)
A stiff and noncompliant pericardium in constrictive disease limits the lateral expansion of the heart, and there is increased longitudinal motion of the heart to fill the ventricle. Hence, the mitral annulus longitudinal motion is paradoxically exaggerated in this setting. Tissue Doppler assessment of the medial (septal) mitral valve annulus, e’, reflects this exaggerated motion, and a medial mitral annular tissue Doppler e’ greater than or equal to 9 cm/s is specific to this disease process in patients with heart failure or increased central venous pressure (Figure 4, bottom left).22 Furthermore, the mitral medial annulus e’ velocity increases further with higher LV filling or LA pressure, so that E/e’ decreases with higher PCW pressure, contrary to the increased E/e’ ratio observed in myocardial disease. This hemodynamic phenomenon is termed “annulus paradoxus.”23
Oftentimes, the lateral left ventricular free wall and the adjacent lateral mitral valve annulus are tethered or slightly adherent to the adjacent noncompliant pericardium and will have a correspondingly lower lateral tissue Doppler compared to the medial annular tissue Doppler. This characteristic Doppler finding is termed “annulus reversus” since the lateral mitral tissue Doppler is typically greater than the medial mitral tissue Doppler in normal physiology. Although the finding of annulus reversus is supportive of constrictive pathology, it is not always present in constrictive pericarditis, similar to mitral E velocity variation with respiration; as such, this finding is not an essential part of the Mayo Clinic Echocardiographic Diagnostic Criteria for constriction.18 Medial mitral e’ velocity decreases with superimposed myocardial disease and is a good prognostic marker for long-term clinical outcomes.14
Hepatic Diastolic Flow Reversal
The abrupt elevation in cardiac filling pressures with constrictive pericarditis is reflected by hepatic venous flow. As previously described, RV filling is rapid with a similarly rapid increase in pressure due to the elevated RA driving pressure and noncompliant, constrictive pericardium. In late diastole, this abrupt interruption in RV filling may be observed as a blood flow reversal in the hepatic veins by pulse-wave Doppler (Figure 4, bottom right). This diastolic flow reversal is accentuated during expiration as RV filling is further impeded by increased LV filling and corresponding interventricular septal bowing into the RV cavity. As such, diastolic expiratory flow reversals are highly specific to constrictive pathology.
Simultaneous use of a respirometer with a low sweep speed may help delineate this timing, particularly with elevated heart rates. Hepatic flow reversals may be seen in other processes, but with different timing (ie, diastolic reversal during inspiration = restrictive cardiomyopathy; systolic flow reversal = tricuspid regurgitation or pulmonary hypertension).4, 5 To better optimize the significance of the diastolic flow reversal in expiration, a ratio of ≥ 0.79 (diastolic flow reversal velocity/preceding diastolic forward flow velocity) has been validated.18 In patients with tachycardia, expiratory reversal in hepatic vein Doppler may happen during systole (Figure 5); this must be differentiated from inspiratory systolic flow reversals seen in tricuspid regurgitation, which is not uncommon in patients with constrictive pericarditis.24
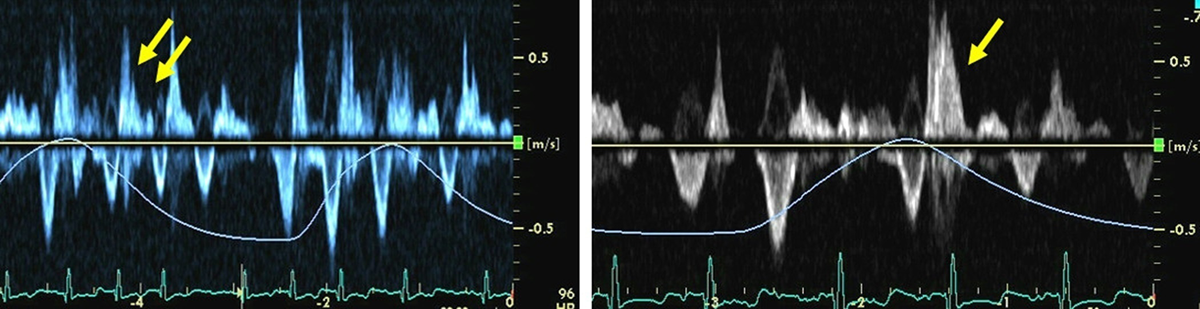
Figure 5
Hepatic vein Doppler in a patient with constrictive pericarditis and atrial fibrillation at baseline (left) and after cardioversion (right). Due to rapid heart rate, expiratory hepatic vein flow reversal happens during systole (arrows, left). Few hours later after cardioversion to sinus rhythm, repeat Doppler echocardiogram shows a prominent expiratory flow reversals during diastole (arrow, right).
Echocardiographic Summary
While hemodynamic catheterization has remained the gold standard for the diagnosis of constrictive pericarditis since the original descriptions, the original cardiac catheterization hemodynamic criteria demonstrate significant overlap with that of restrictive cardiomyopathy.25 More distinct hemodynamic features as described above are necessary to diagnose constriction with increased specificity, whether using cardiac catheterization or echocardiography. The advent of 2D and Doppler echocardiography has dramatically improved noninvasive diagnostic capability and accuracy.
Echocardiography is usually the first diagnostic study used to evaluate this complex and often curable pathology (which is frequently not clinically suspected), and a comprehensive echocardiographic evaluation is often sufficient to proceed with pericardiectomy without additional hemodynamic evaluation. At Mayo Clinic, the number of patients with constrictive pericarditis and subsequent pericardiectomy sky-rocketed from 10 to between 60 and 100 cases a year after echocardiography was used to make the diagnosis.
Exercise Hemodynamics and Constrictive Disease
While constrictive pericardial disease is known to impact exertional capacity, the hemodynamics of this pathology during exercise are not well characterized.
Invasive Exercise Hemodynamics
In the years following the first description of constrictive hemodynamics, a small number of patients with surgically confirmed constrictive pericarditis underwent invasive hemodynamic catheterization with rest and exercise measurements.26 In a series by Kloster et al. that evaluated preoperative rest and stress hemodynamics in limited individual cases, a patient had elevated RA (16 mm Hg) pressures at rest with mild elevation of RV (systolic pressure 30 mm Hg) and pulmonary artery (mean pressure 25 mm Hg) pressures at rest. With exercise, the RA pressure became markedly elevated (22 mm Hg) with corresponding significant elevation in the RV (systolic pressure 48 mm Hg) and pulmonary artery (mean 38 mm Hg) with reduction of cardiac output in both states.27 These findings paralleled an earlier case description by Murphey et al. that demonstrated elevated right-sided pressures and pulmonary capillary wedge pressures with exercise after constrictive disease had progressed in one of their patients.28
It has been posited that heart failure with preserved ejection fraction (HFpEF)/restrictive cardiomyopathies and constrictive pericarditis share a significant overlap in clinical manifestation with exertional dyspnea and circulatory overload. In the modern era of invasive catheterization, exercise hemodynamic studies have become increasingly useful to diagnose HFpEF, particularly when the diagnosis remains elusive after noninvasive testing.29 However, not until recently have the hemodynamics of HFpEF and constrictive pericardial disease been directly compared. Miranda et al. made this salient comparison identifying a cohort of constrictive pericarditis patients who underwent hemodynamic catheterization. Compared to patients with HFpEF, those with constrictive pericarditis had higher resting RA and PCW pressures with marked increase in each during exercise. The filling pressures were inversely correlated with significantly decreased cardiac output response to exercise in these patients with an already reduced cardiac index at rest. This series demonstrated how elevations in filling pressures and reduction in cardiac output were much more extensive in the constrictive pericarditis population when compared with the HFpEF cohort, bringing further clarification about each respective pathology.30 Figure 3 demonstrates the resting and exercise cardiac catheterization hemodynamics of constrictive pericarditis.
Exercise Echocardiography in Constriction
Similar to the exercise hemodynamics during invasive catheterization, the echocardiographic findings for constrictive pericarditis are accentuated during exercise. At peak exercise, respirophasic septal motion, medial annular e’, mitral inflow (E) variations, and expiratory diastolic flow reversals in the hepatic vein are all exaggerated due to worsening constrictive physiology and increased filling pressures (Figures 6, 7; Video 1). Alongside these hemodynamic phenomena, cardiac output response during exercise and stroke volume will have limited augmentation, similar to what has been described invasively (Figure 7). These findings of constriction may not be universally apparent, particularly if treatment (ie, diuretics/anti-inflammatories) has been initiated or arrhythmias (ie, atrial fibrillation) are present. However, as the severity of disease increases, one may expect these findings to be present during exercise as well as at rest.
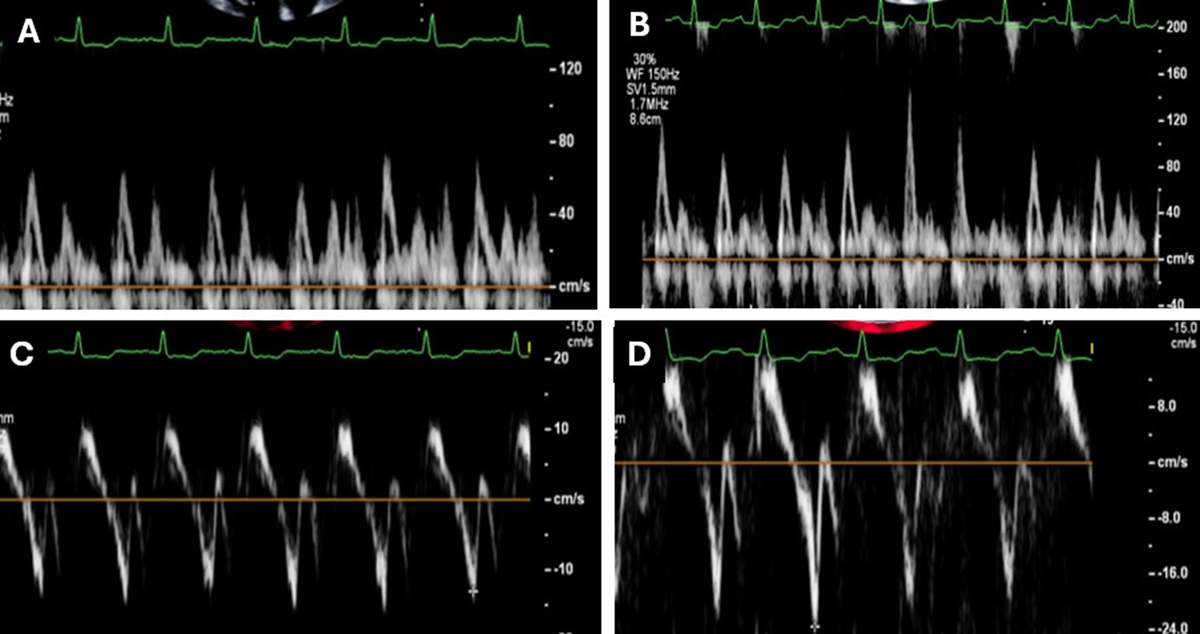
Figure 6
Exercise Doppler echocardiogram with demonstration of worsening constrictive physiology. Mitral inflow at rest with minimal respiratory variation (A) with significant inflow variation following exercise (B). Mitral septal e’ with exaggerated values at rest (C; 0.13 m/s), increasing post-exercise (D; 0.23 m/s).
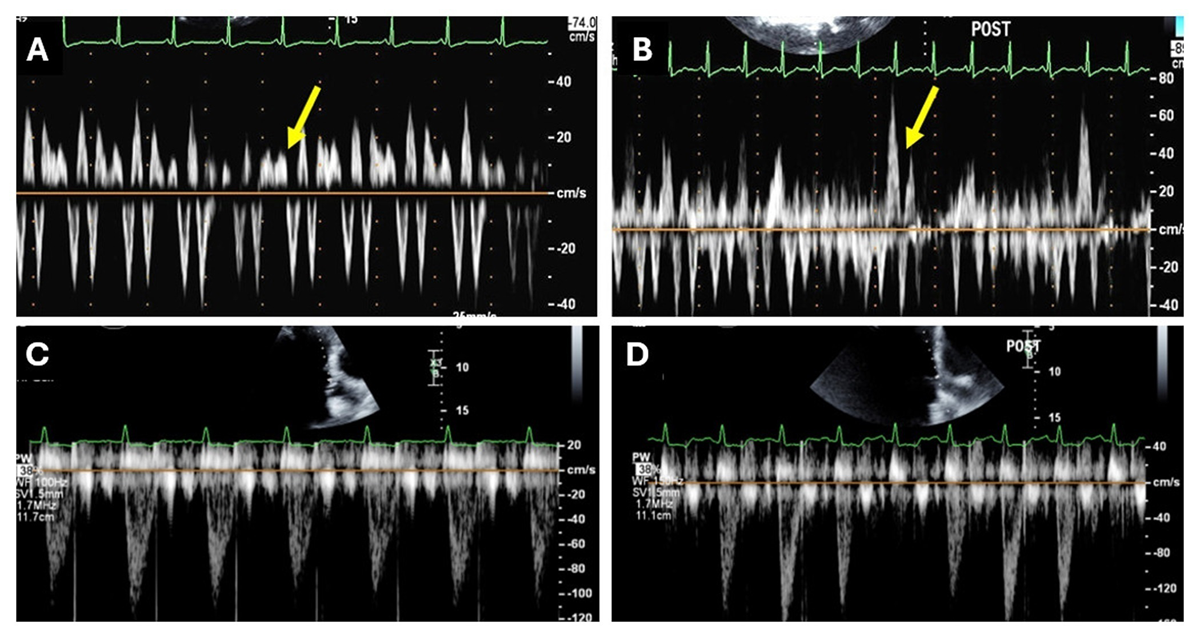
Figure 7
Hepatic vein expiratory diastolic flow reversals (arrow) at rest (A) with accentuation and elevated reversal velocity post-exercise (B). Left ventricular outflow tract pulse wave Doppler evaluation demonstrating minimal fluctuations in cardiac output at rest (C) becoming more evident following exercise (D).
Video 1
Demonstration of increased ventricular interdependence during exercise echocardiography. A respirophasic septal shift is seen at rest (A) with more dynamic motion following exercise (B). Also see Video 1A at https://vimeo.com/1162247129/2ccdf31d27 and Video 1B at https://vimeo.com/1162248382/d5cb3b7dfc.
Conclusions
Constrictive pericarditis remains a complex diagnosis even for the most skilled of clinicians. When constrictive disease is suspected, transthoracic echocardiography has largely replaced hemodynamic catheterization as a definitive diagnostic investigation. Even in patients without clinical suspicion for the condition, characteristic findings in the echocardiography laboratory may uncover this pathology since echocardiography is usually performed to evaluate symptoms related to underlying constrictive pericarditis. The culmination of respirophasic interventricular septal motion, accentuated medial mitral annular movement, and expiratory hepatic venous flow reversals in diastole, along with restrictive mitral inflow, provide a very high positive predictive value for disease in the absence of other possible confounding diagnoses.18
When diagnosis remains uncertain or there is superimposed myocardial disease, a comprehensive hemodynamic cardiac catheterization should be performed to demonstrate ventricular interdependence and discordant ventricular systolic pressure change with respiration along with rapid increase of diastolic filling pressures in both ventricles. If this complex hemodynamic study is not readily feasible or inconclusive, simplified invasive measurements (ie, PA and Ao ET) or exercise hemodynamic testing may provide further evidence of constrictive disease. A fluid challenge or exercise may be necessary in treated (ie, diuresis) or early disease states.
There remains a paucity of data regarding the specific variables and cutoffs that may be valuable in exercise hemodynamics, both invasively and noninvasively. We hope this focused review of invasive and noninvasive hemodynamic assessments demonstrates the recent advances that enable an expedient diagnosis of constrictive pericarditis while encouraging future study of this complex hemodynamic phenomenon so that this often curable heart failure condition does not progress without being recognized.
Key Points
Constrictive pericarditis has characteristic hemodynamics of ventricular interdependence and elevated cardiac filling pressures that are respiration dependent.
Although simultaneous right and left heart catheterization has been the historical gold standard for diagnostic evaluation, Doppler echocardiography has become a definitive diagnostic method for constrictive pericarditis.
Exercise hemodynamics during catheterization or echocardiography can help make the diagnosis when resting evaluation is unclear.
Competing Interests
Dr. Jae K. Oh is the section editor for Pericarditis in UpToDate. Dr. David Harmon has no competing interests to declare.