
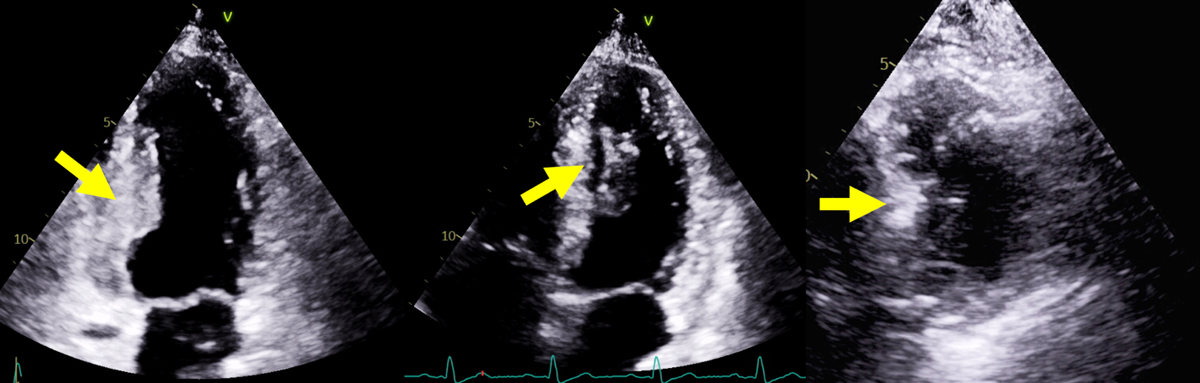
Figure 1
Transthoracic echocardiography (TTE) images. 2- and 4-chamber TTE images with significant thickening (1.4 cm) within the mid inferior and inferoseptal walls (yellow arrows). Short axis imaging on echocardiography was technically limited, however there was no visible mass. Contrast echocardiography was not performed.
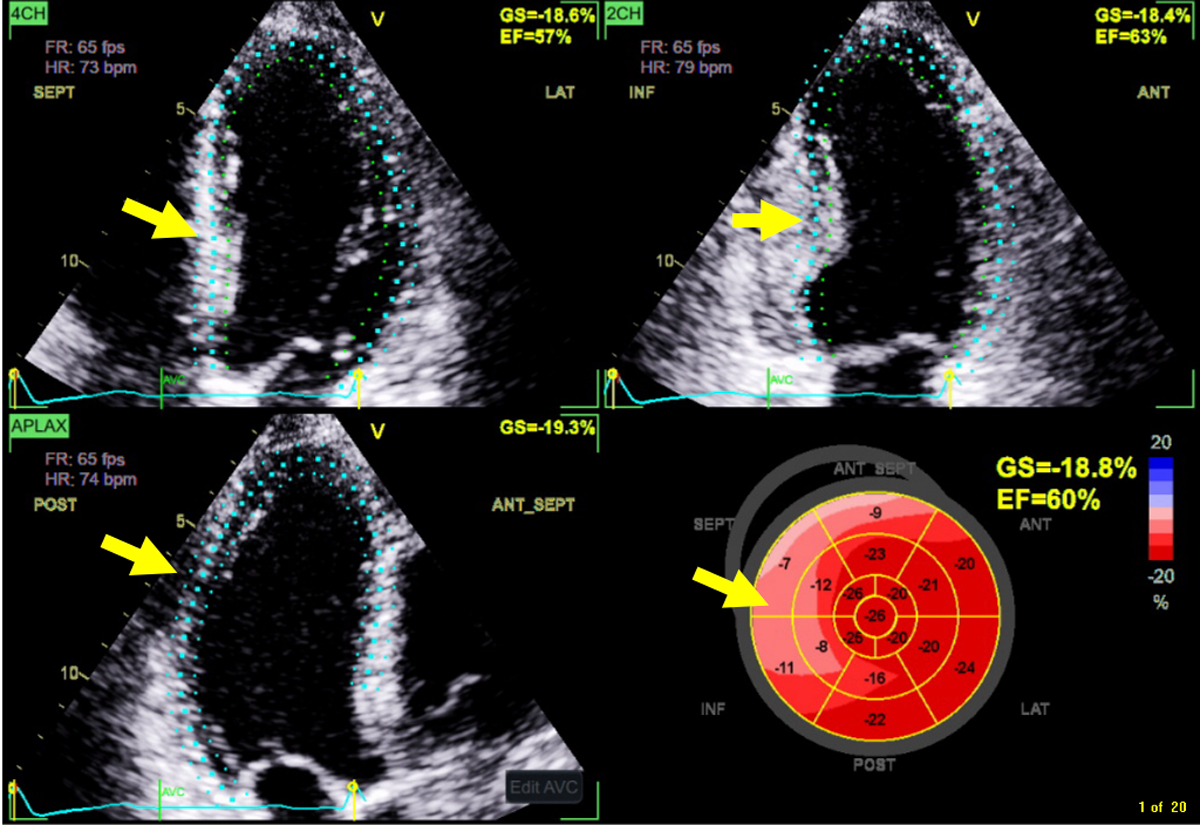
Figure 2
Despite overall preservation of GLS, the inferior and inferoseptal segments had significant reduction in regional GLS. Yellow arrows refer to location of mass. GLS: global longitudinal strain
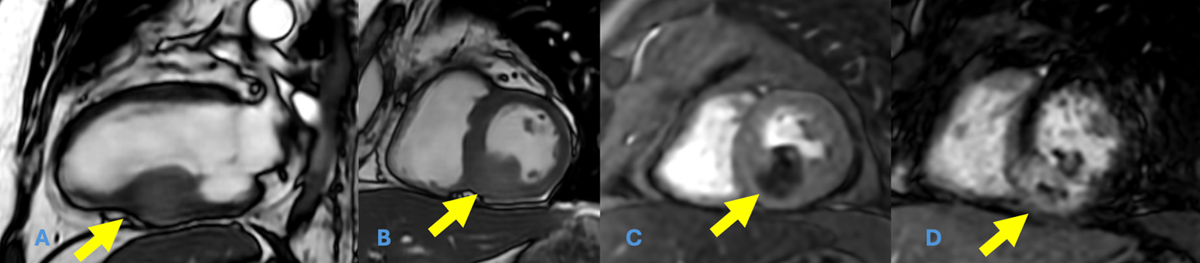
Figure 3
(A, B) Steady state free precession cine images reveal a 2.7 × 2.3 cm mass within the mid inferior and inferoseptal wall (yellow arrows). (C) Perfusion imaging with mild contrast uptake. (D) Diffuse late gadolinium enhancement throughout the mass.