
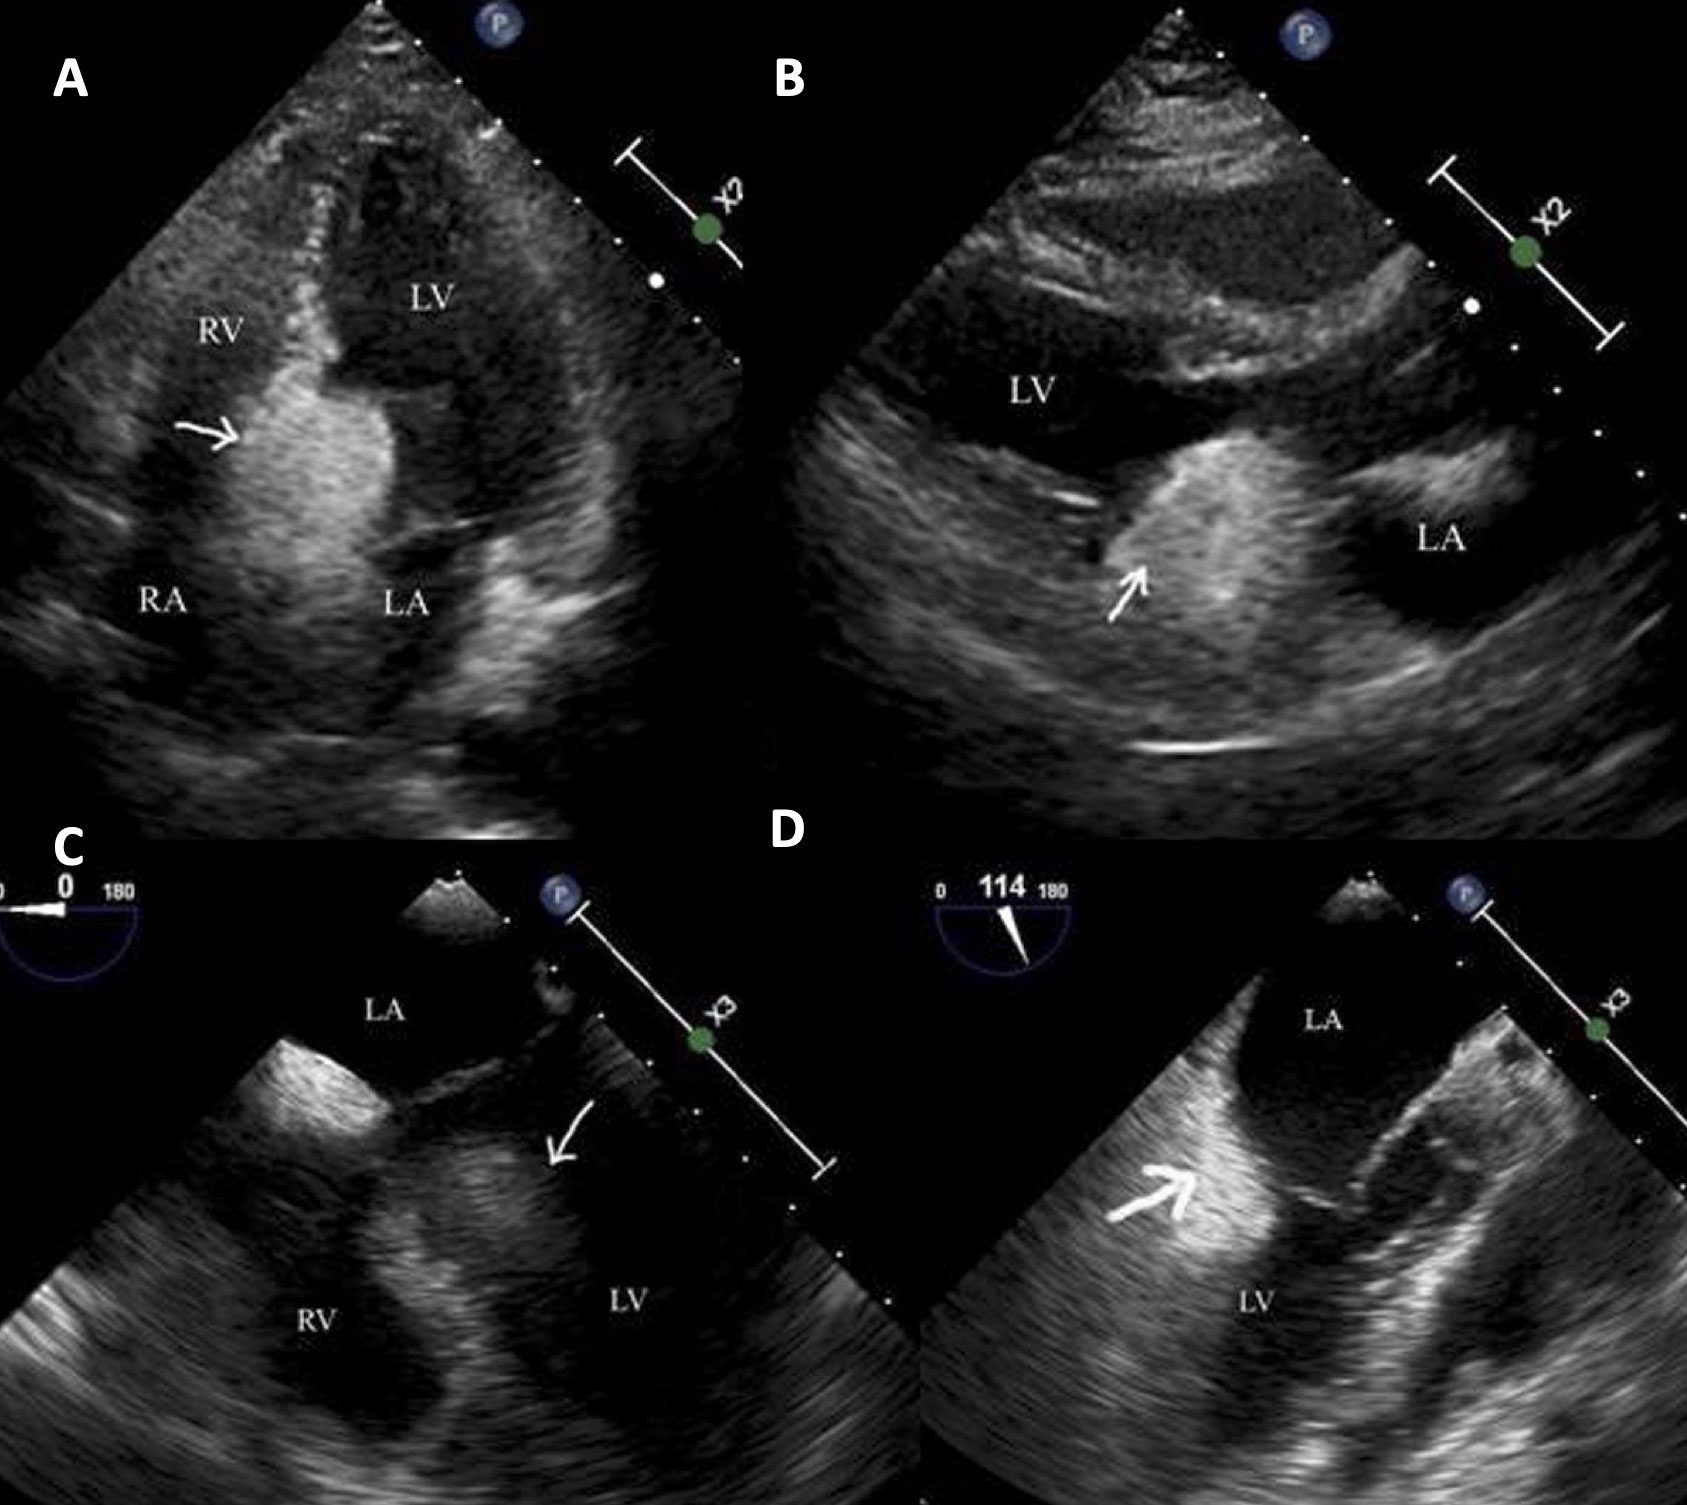
Figure 1
(A) Transthoracic echocardiogram in apical four-chamber view and (B) parasternal long-axis view showing a large echogenic mass in the region of the basal interventricular septum (depicted by white arrow) transesophageal echocardiogram in (C) four-chamber and (D) three-chamber views demonstrate the echodense mass. RV: right ventricle; LV: left ventricle; RA: right atrial; LA: left atrial
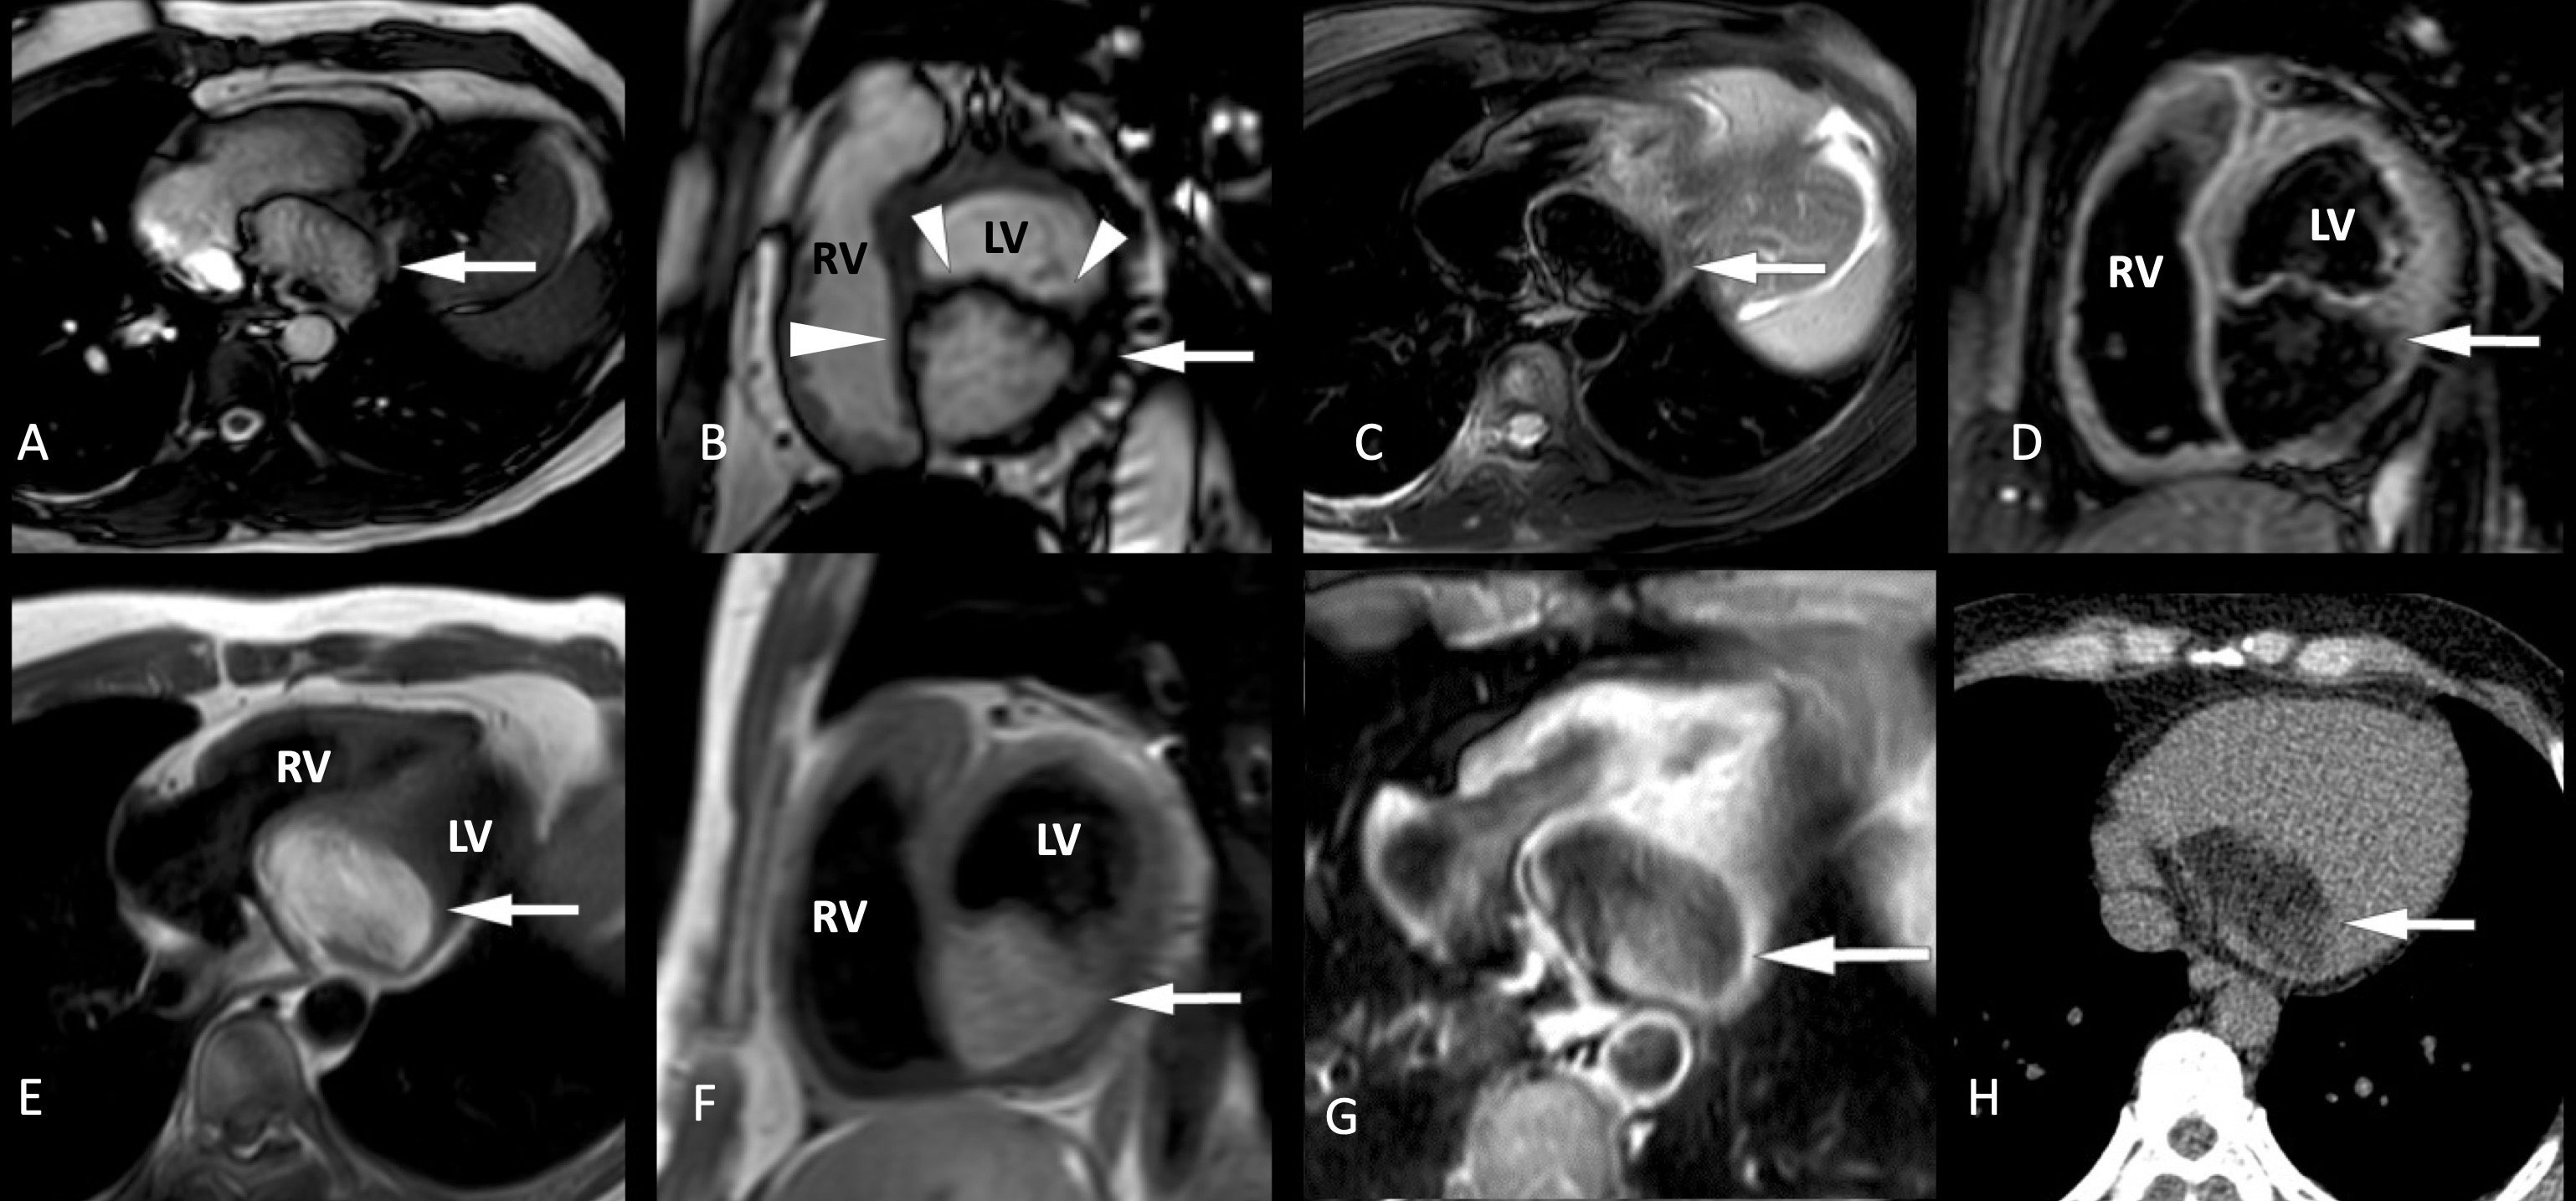
Figure 2
(A) Steady state free precession sequence in horizontal long-axis (HLA) and (B) short-axis (SA) view demonstrating a hyperintense lesion (depicted by white arrow) arising in the intramyocardial location from the basal inferior, inferoseptum, and inferolateral left ventricular wall. The lesion is (C) hypointense on T2 fat saturated (FS) HLA and (D) SA images and hyperintense on (E) T1 non-fat saturated HLA and (F) SA images. (G) Post-contrast T1 FS HLA shows no contrast enhancement. (H) Non-contrast-ECG gated CT scan of the chest confirmed the diffuse fatty attenuation of the lesion, with no intralesional calcification. ECG: electrocardiography; CT: computed tomography; RV: right ventricle; LV: left ventricle