
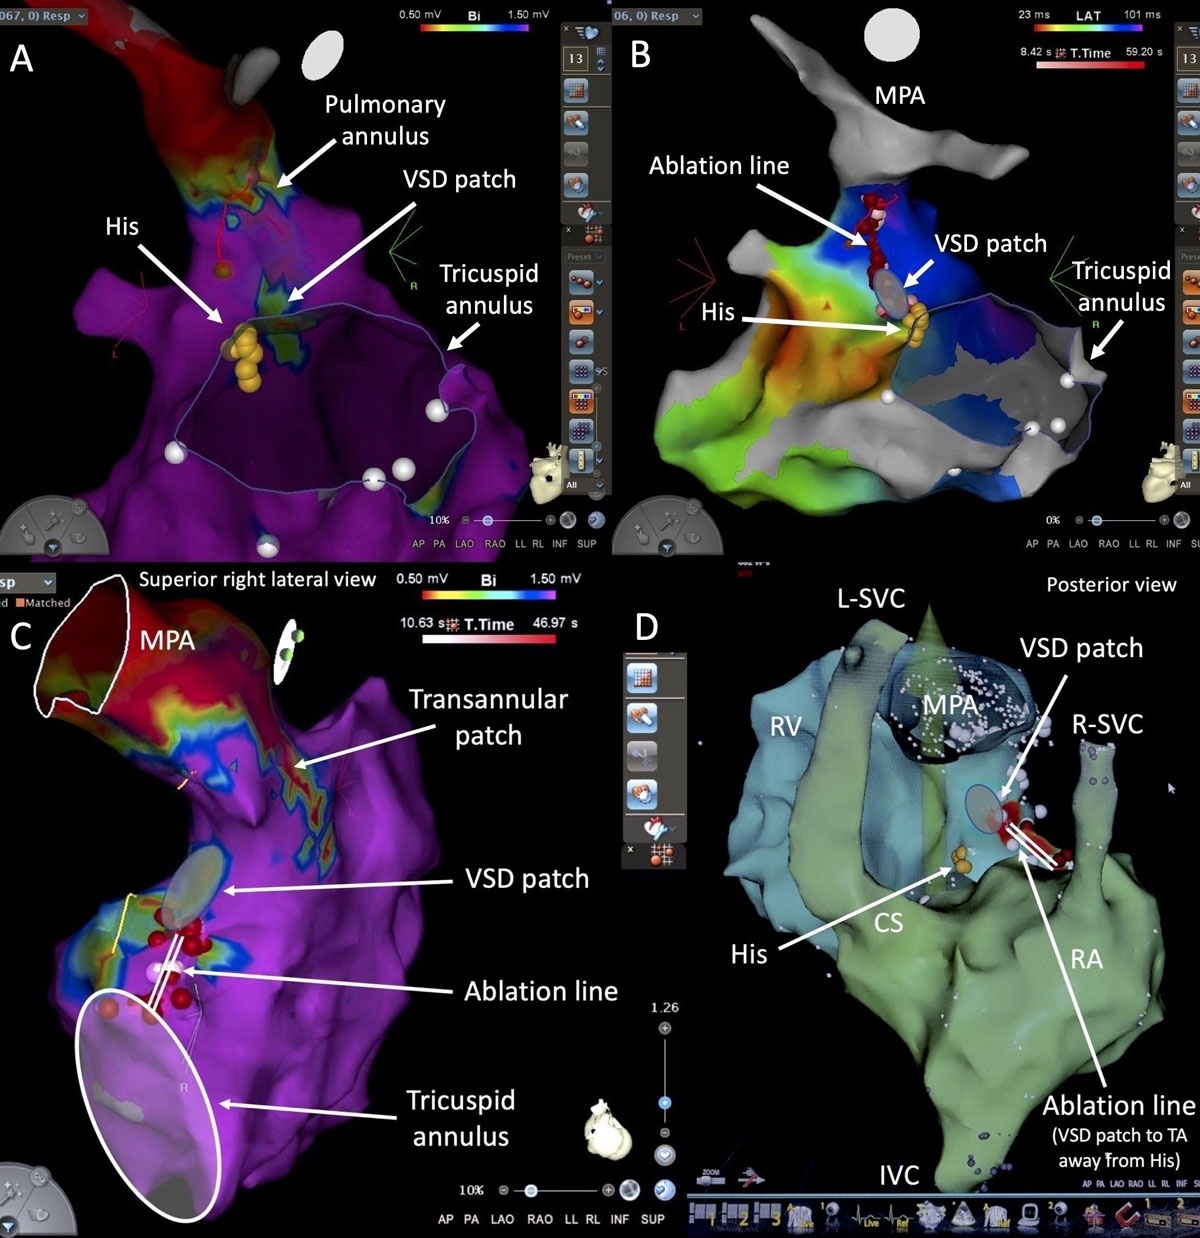
Figure 1
Ventricular tachycardia (VT) ablation in tetralogy of Fallot (TOF). (A) Patient 1 with repaired TOF and VT in which the critical isthmus targeted for ablation was between the ventricular septal defect (VSD) patch and pulmonary annulus, identified by voltage mapping. (B) The ablation line connected the two electrically inert structures (VSD patch and pulmonary annulus). (C) Patient 2 with repaired TOF and VT in which the critical isthmus was between the VSD patch and tricuspid annulus (TA), as identified by voltage mapping. The ablation line connected these two electrically inert structures (VSD patch and TA). (D) The ablation line was anchored on the VSD patch and directed away from the His bundle. Note that this patient had bilateral superior vena cavae (SVC), with a left SVC (L-SVC) draining into the coronary sinus (CS). Reprinted with permission from Wolters Kluwer Health, Inc. IVC: inferior vena cava; MPA: main pulmonary artery; RA: right atrium; R-SVC: right SVC; RV: right ventricle
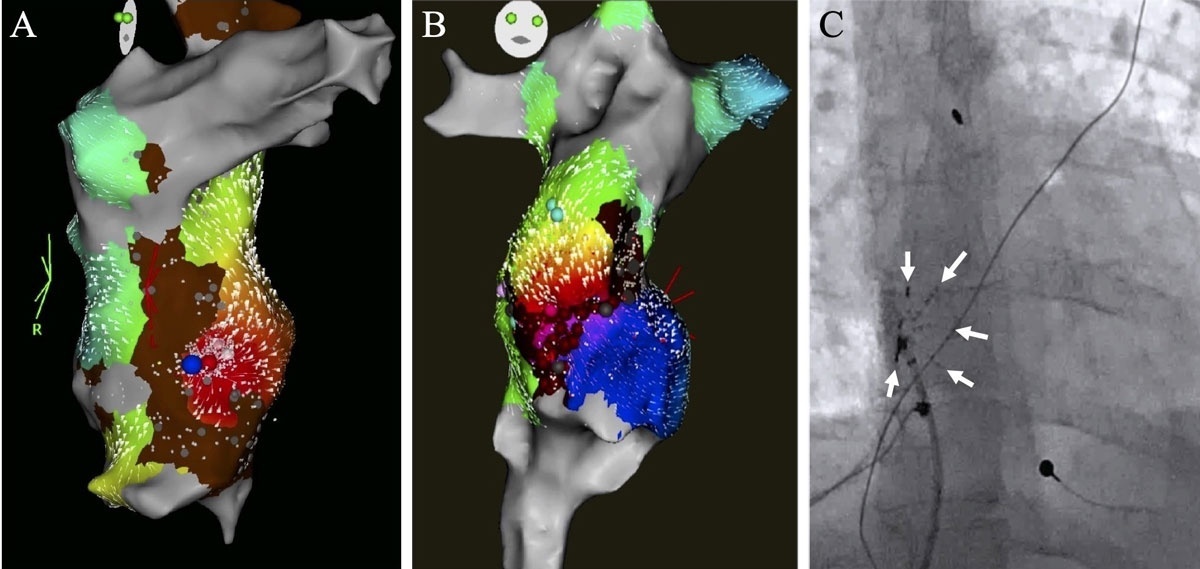
Figure 2
High-density mapping of atrial arrhythmias in patients with Fontan surgery. (A) A high-density electroanatomic map of a nonautomatic focal atrial tachyardia along a scar border in a 41-year-old patient with an intracardiac lateral tunnel Fontan. Earliest electrical activation (red) is along the inferomedial aspect of the Fontan baffle. (B) A high-density map of an intra-atrial re-entrant tachycardia in a 28-year-old patient with a lateral tunnel Fontan. Earliest electrical activation is denoted in red with arrows depicting the wavefront propagating clockwise around dense scar (brown and grey areas) to the latest points in purple. (C) A fluoroscopic view of a multielectrode mapping catheter (PentaRay, Biosense Webster,) used to create these high-density maps. A total of 20 electrodes are distributed among five soft radiating splines indicated by the white arrows. Reprinted with permission from Elsevier.
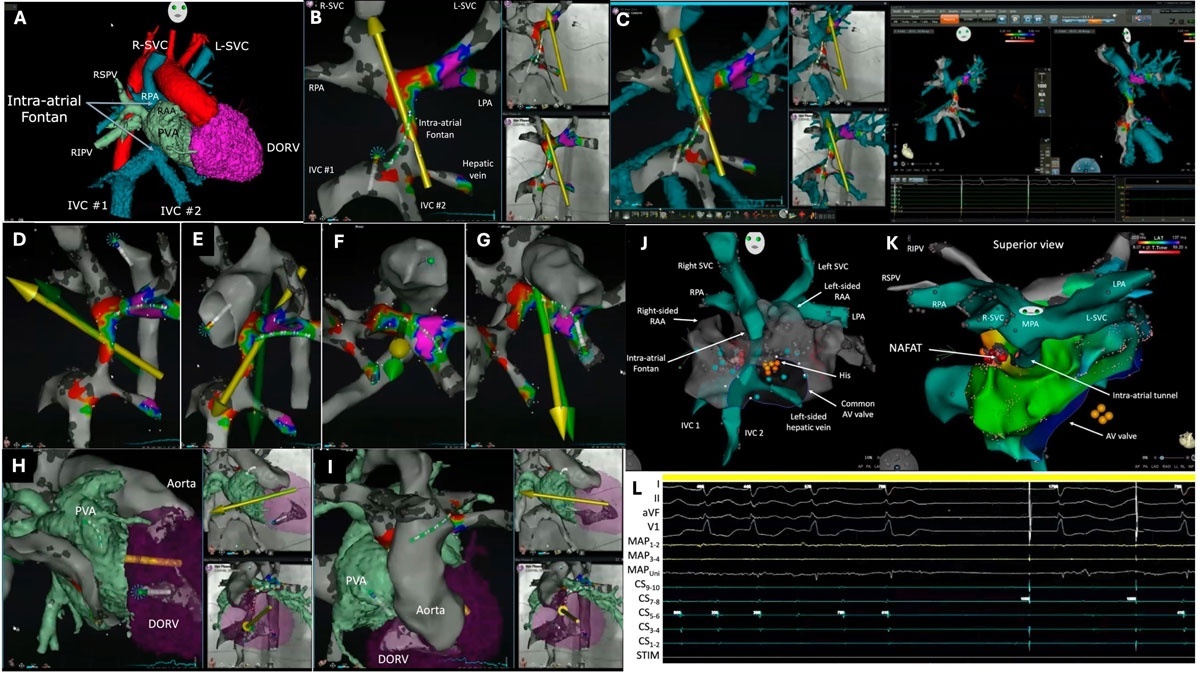
Figure 3
Robotic magnetic nativation-guided ablation in a patient with intracardiac tunnel Fontan. (A) CT scan images segmented and imported into a 3D-electroanatomic mapping system. (B) Electroanatomic mapping of the systemic venous atrium. The yellow arrow designates the direction of the magnetic field and the starburst at the tip of the ablation catheter indicates good tissue contact. (C) Merging of electroanatomic mapping and CT scan images of the systemic venous atrium in multiple views. Shown is the operator view of CT scan and 3D mapping images (left) during the merging process, overlaying of these images on orthogonal fluoroscopic views (middle), and views from the 3D electroanatomic mapping system. The yellow arrows indicate the direction of the magnetic field. (D-G) Robotic magnetic navigation-guided retrograde aortic access. (H-I) Crossing of the common AV valve of the double-outlet right ventricle (DORV) to enter the pulmonanry venous atrium (PVA). The green arrows represent the direction of the magnetic field set by the operator whereas the yellow arrows indicate the actual direction of the magnetic field, with a brief lag time between the two. (J-K) 3D view of electroanatomic maps of nonautomatic focal atrial tachycardia (NAFAT). (L) Surface ECG leads I, II, aVF, and V2; intracardiac recordings from the distal (MAP1-2) to proximal (MAP3-4) and unipolar (MAPUni) mapping catheter. Reprinted with permission from Elsevier.27 STIM: stimulation channel; R-SVC: right superior vena cava; L-SVC: left superior vena cavae; RSVP: right superior pulmonary vein; RPA: right pulmonary artery; RAA: right atrial appendage; RIPV: right inferior pulmonary vein; PVA: pulmonary venous atrium; DORV: double-outlet right ventricle; IVC: inferior vena cava; LPA: pulmonary artery; AV: denotes atrioventricular
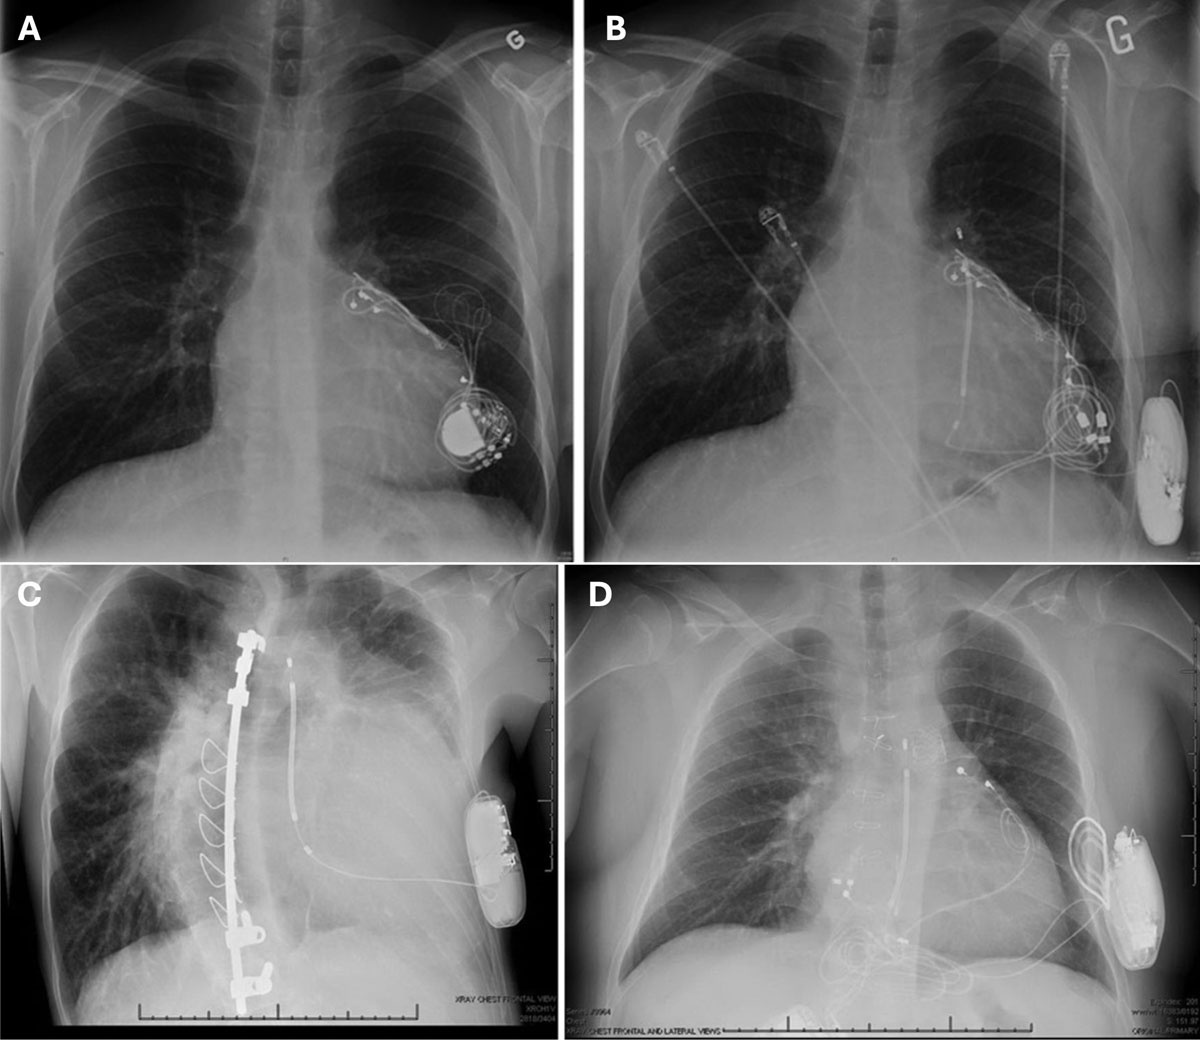
Figure 4
Subcutaneous implantable cardioverter defibrillator in congenital heart disease. (A) A 26-year-old male after lateral tunnel fontan had undergone epicardial pacemaker for symptomatic sinus node dysfunction. (B) The patient underwent generator replacement with a dedicated bipolar device to avoid future interdevice interaction as well as relocation to the right upper abdomen to exclude the device from the future subcutaneous implantable cardioverter debrillator (S-ICD) shock vector. (C) A 41-year-old male with tricuspid atresia and pulmonary stenosis previously palliated by Waterson shunt in childhood underwent S-ICD placement for a left ventricular ejection fraction of 35%. (D) A 22-year male with hypoplastic left heart syndrome palliated by extracardiac fontan operation who had a previously failed epicardial ICD system that had been placed for nonsustained ventricular tachycardia in the setting of unexplained syncope and systemic right ventricular ejection fraction of ≈ 10%. Reprinted with permission from Wolters Kluwer Health, Inc.49
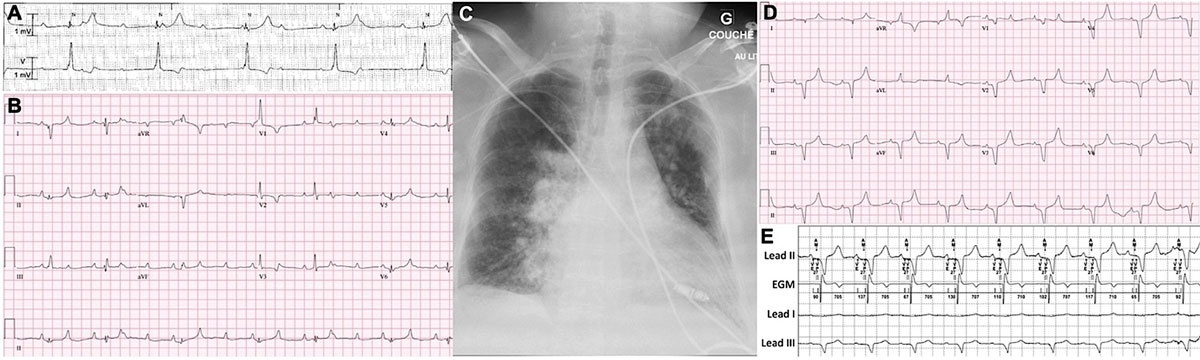
Figure 5
Leadless pacemaker in Eisenmenger syndrome. Atrioventricular synchronous pacing with Micra AV leadless pacemaker (Medtronic Inc) in an adult with Eisenmenger syndrome and complete atrioventricular (AV) block. (A) Rhythm strip (leads II and V) on presentation shows complete AV block with a junctional escape rhythm at 37 beats/min. (B) 12-lead electrocardiogram (ECG) after initiation of an isoproterenol infusion shows high-grade AV block with a narrow QRS (106 ms) rate of approximately 45 bpm. (C) Posteroanterior chest radiograph following implantation of the leadless pacemaker. The leadless pacemaker is positioned in the right ventricular apex. (D) 12-lead ECG shows left bundle branch block morphology with leadless ventricular pacing and 2:1 undersensing of atrial activity that prompted reprograming of the A4 threshold. (E) Intrinsic electrocardiographic tracings (lead II, intracardiac electrogram [EGM], and leads I and III) obtained upon device interrogation at the 3-month follow-up visit. As seen on the marker channel, the ventricular end period and atrial mechanical (AM) period are appropriately sensed following the P wave. The pacemaker spike (VP) follows after the programmed 20 ms AM-VP delay, with appropriate ventricular capture. Reprinted with permission from Ellsevier.57
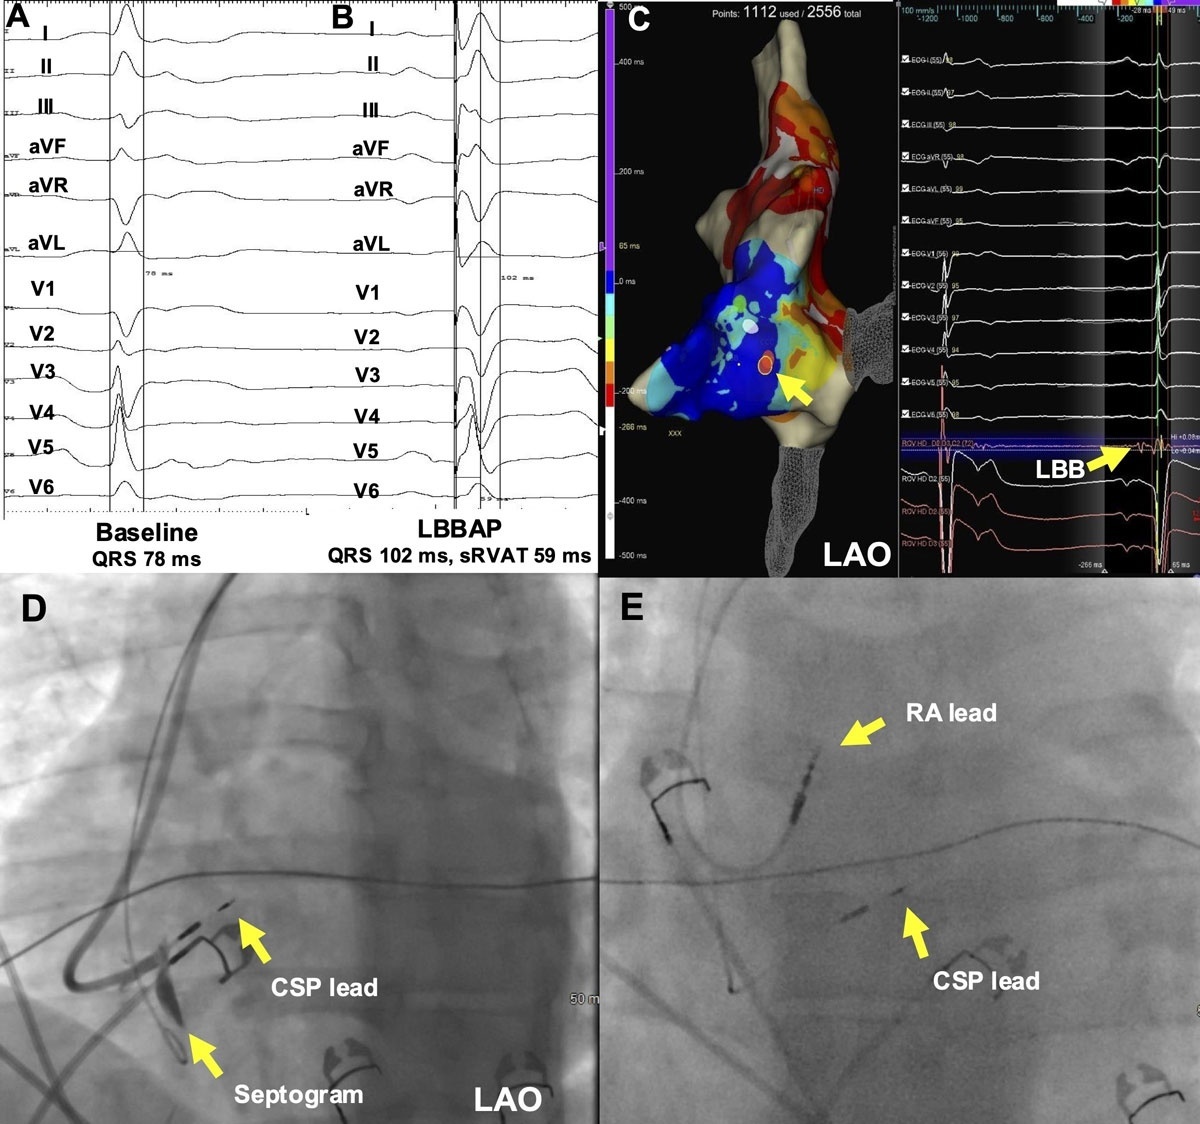
Figure 6
Conduction system pacing (CSP) in congenitally corrected transposition of the great arteries (ccTGA), A 43-year-old patient with ccTGA and intermittent complete heart block underwent electroanatomic mapping-guided pacemaker implantation with a CSP lead. (A) Baseline electrocardiogram (ECG) with a QRS duration of 78 ms. (B) ECG following left bundle branch area pacing (LBBAP) with a QRS duration of 102 ms and systemic right ventricular activation time (sRVAT) of 59 ms. (C) Electroanatomic map showing location and signal of LBB in a left anterior oblique (LAO) orientation. (D) Fluoroscopy image of septogram showing CSP lead 13 mm into the septum. (E) Fluoroscopy image showing final right atrium (RA) and CSP lead position. Reprinted with permission from Elsevier.
Table 1
Summary of key sudden cardiac death risk stratification tools by lesion type. Reprinted with permission from Wolters Kluwer Health, Inc. CHD: congenital heart disease; ASD: atrial septal defect; PREVENTION-ACHD: Prospective study on implantable cardioverter-defibrillator therapy and sudden cardiac death in adults with congenital heart disease; TOF: tetralogy of Fallot; VT: ventricular tachycardia; LV: left ventricle; CMR: cardiac magnetic resonance; RVESVi: indexed right ventricular end-systolic volume; ICD: implantable cardioverter-defibrillator; INDICATOR: International Multicenter Tetralogy of Fallot Registry; SCD: sudden cardiac death; TGA: transposition of the great arteries; ccTGA: congenitally corrected TGA; sRV: systemic right ventricle; LVOT: left ventricular outflow tract; MARE: major adverse ventricular arrhythmias and related events; EF: ejection fraction
| LESION TYPE | KEY PREDICTORS | TOOLS/SCORES | LIMITATIONS |
|---|---|---|---|
Mixed cohorts with CHD
|
|
| Models were not devised to tease out predictors unique to specific defects |
| Repaired TOF |
|
|
|
| TGA with Mustard or Senning baffle |
|
| Model lacks competing-risk analyses and integration of advanced imaging and neurohormonal markers |
| Congenitally corrected TGA (ccTGA) |
| MARE risk prediction model | Model is less robust in ccTGA compared to TGA post atrial switch, which may reflect differences in arrhythmic substrates and triggers among the two groups |
| Single ventricle Fontan |
| None | Identification of risk factors have been limited by small sample sizes and low event rates |