
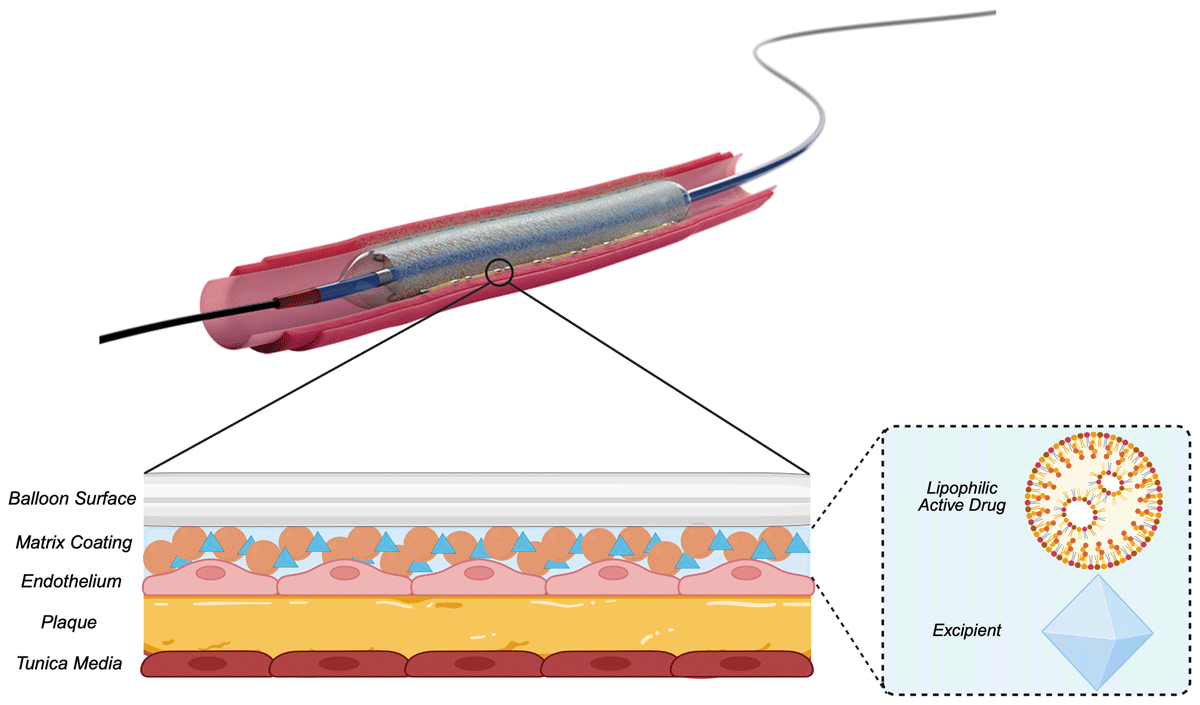
Figure 1
Drug-coated balloon mechanism of action. Reproduced with permission from Boston Scientific.
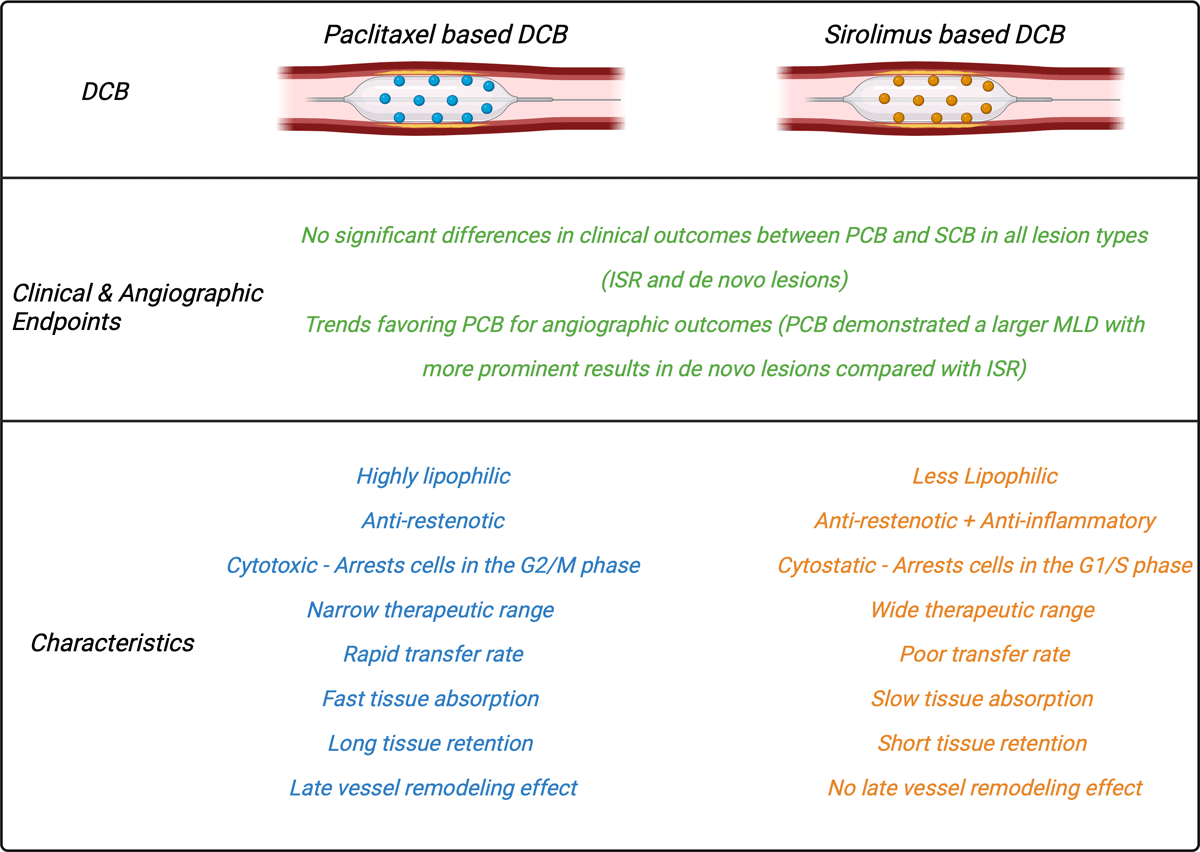
Figure 2
Main characteristics and differences between paclitaxel and sirolimus drug-coated balloons. DCB: drug-coated balloon; PCB: paclitaxel-coated balloon; SCB: sirolimus-coated balloon; ISR: in-stent restenosis; MLD: mean lumen diameter
Table 1
Summary of the main randomized clinical trials of the use of DCB in coronary ISR. BMS: bare metal stent; DCB: drug-coated balloon; DES: drug-coated stent; EES: everolimus-eluting stent; LLL: late lumen loss; MACE: major adverse clinical events; MLD: mean lumen diameter; ISR: in-stent restenosis; OCT: optical coherence tomography; PCB: paclitaxel-coated balloon; PES: paclitaxel-eluting stent; POBA: plain old balloon angioplasty; SCB: sirolimus-coated balloon; SES: sirolimus-eluting stent; TLF: target lesion failure; TVR: target vessel revascularization *P-value was not calculated for PES-PCB head-to-head comparison in late lumen loss.
| STUDY NAME | YEAR | ARMS | n | MAIN FINDINGS | MAIN CONCLUSION |
|---|---|---|---|---|---|
| BMS ISR | |||||
| PACOCATH ISR I & II24 | 2012 | POBA vs PCB | 108 | Angiography (6 months):
| Treatment of ISR with PCB is safe and consistently reduces repeat revascularization during long-term follow-up. |
| AGENT IDE25 | 2025 | POBA vs PCB | 600 | TLF (2 years): 34 % vs 27% (P = .04) | Consistent results were observed at 2-year follow-up, with a significantly reduced instance of TLF. |
| PEPCAD II26 | 2015 | PES vs PCB | 131 | Angiography (6 months):
| PCB consistently reduced LLL and restenosis compared to PES, indicating stability of the lesions treated. |
| RIBS V27 | 2016 | EES vs PCB | 189 | Angiography (6 months):
| EES was associated with superior angiographic effectiveness and reduces the need for target lesion revascularization compared to PCB. |
| SEDUCE28 | 2014 | EES vs PCB | 50 | Angiography (9 months):
| PCB was associated with better healing characteristics but appeared to be slightly less effective compared to EES. |
| TIS29 | 2016 | EES vs PCB | 136 | Angiography (12 months):
| Treatment of BMS ISR using PEB was associated with non-inferior angiographic results compared with the implantation of second-generation EES. |
| DES ISR | |||||
| PEPCAD-DES30 | 2012 | POBA vs PCB | 110 | Angiography (6 months):
| Angioplasty with PCB is superior to POBA in DES-ISR. |
| PEPCAD CHINA ISR31 | 2014 | PES vs PCB | 220 | Angiography (9 months):
| Angioplasty with DCB was noninferior to DES implantation in terms of angiographic effectiveness. |
| ISAR DESIRE 332 | 2013 | PES vs PCB | 268a | Angiography (6-8 months):
| Angioplasty with DCB was associated with noninferior effectiveness compared with DES implantation. |
| RIBS IV33 | 2015 | EES vs PCB | 309 | Angiography (6-9 months):
| In DES-ISR, EES provided superior long-term clinical and angiographic results compared with DEB. |
| RESTORE34 | 2018 | EES vs PCB | 172 | Angiography (9 months):
| In DES-ISR, both DCB and DES strategies were safe and effective up to 1-year post-procedure, with DES showing superior angiographic results. |
| Mixed ISR | |||||
| BIOLUX35 | 2018 | SES vs PCB | 229 | Angiography (6 months):
| In DES or BMS ISR, Angiographic results at 6 months and clinical outcomes up to 18 months post procedure are comparable between DCB and repeat DES groups. |
| DARE36 | 2018 | EES vs PCB | 278 | Angiography (6 months):
| In DES or BMS ISR, treatment with DCB is non-inferior to DES in terms of angiographic and clinical end points. |
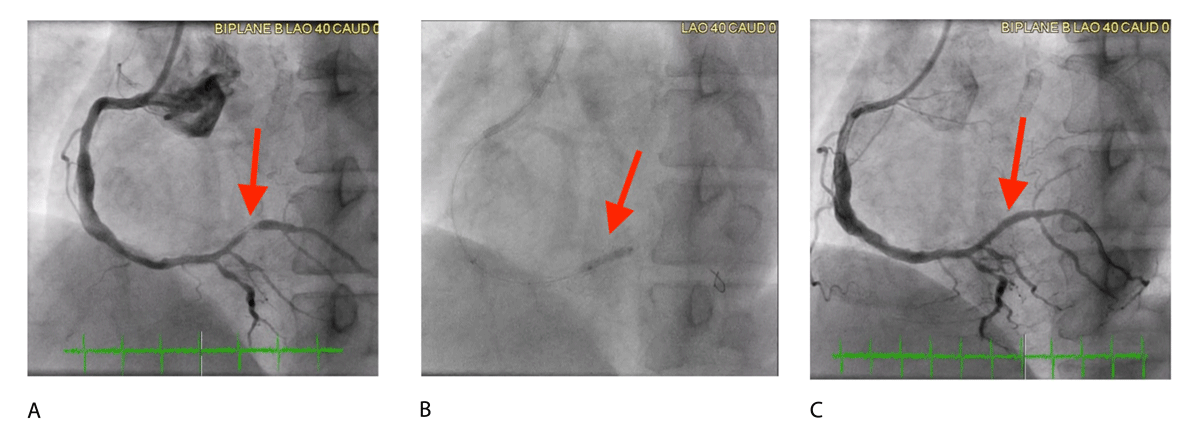
Figure 3
Coronary angiogram images demonstrating treatment of in-stent restenosis (ISR) using a drug-coated balloon (DCB). (A) Pre-treatment image showing 90% ISR in the affected artery. (B) Deployment of a 2.5 × 15 mm AGENT drug-coated balloon, inflated to 6 atm for 60 seconds. (C) Post-treatment image showing complete resolution of ISR with 0% stenosis after DCB intervention.
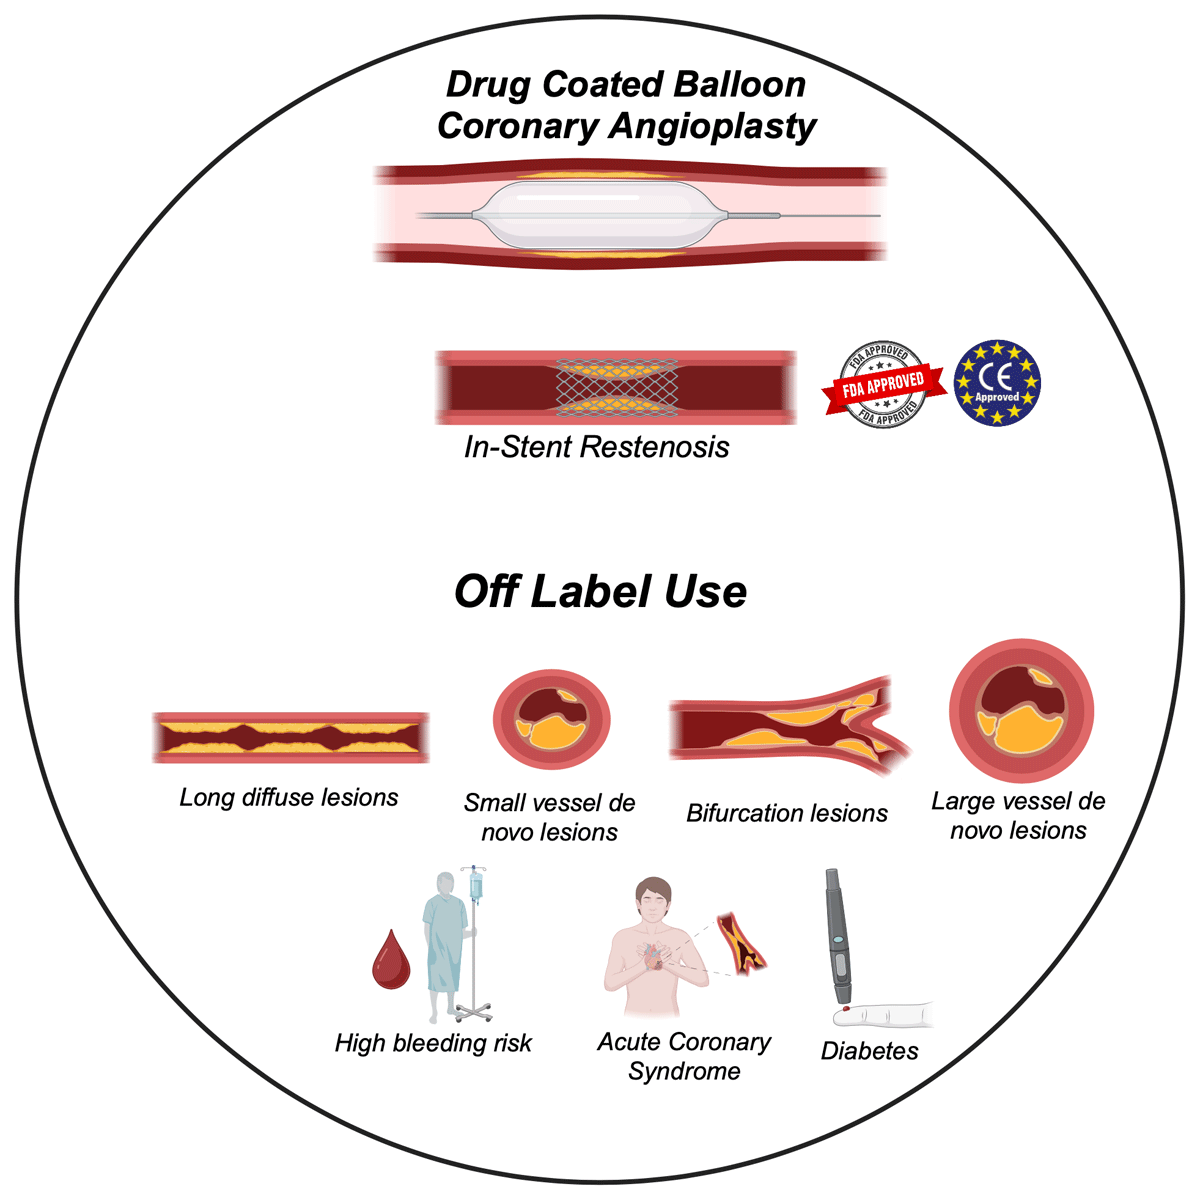
Figure 4
Drug-coated balloon coronary angioplasty indications.
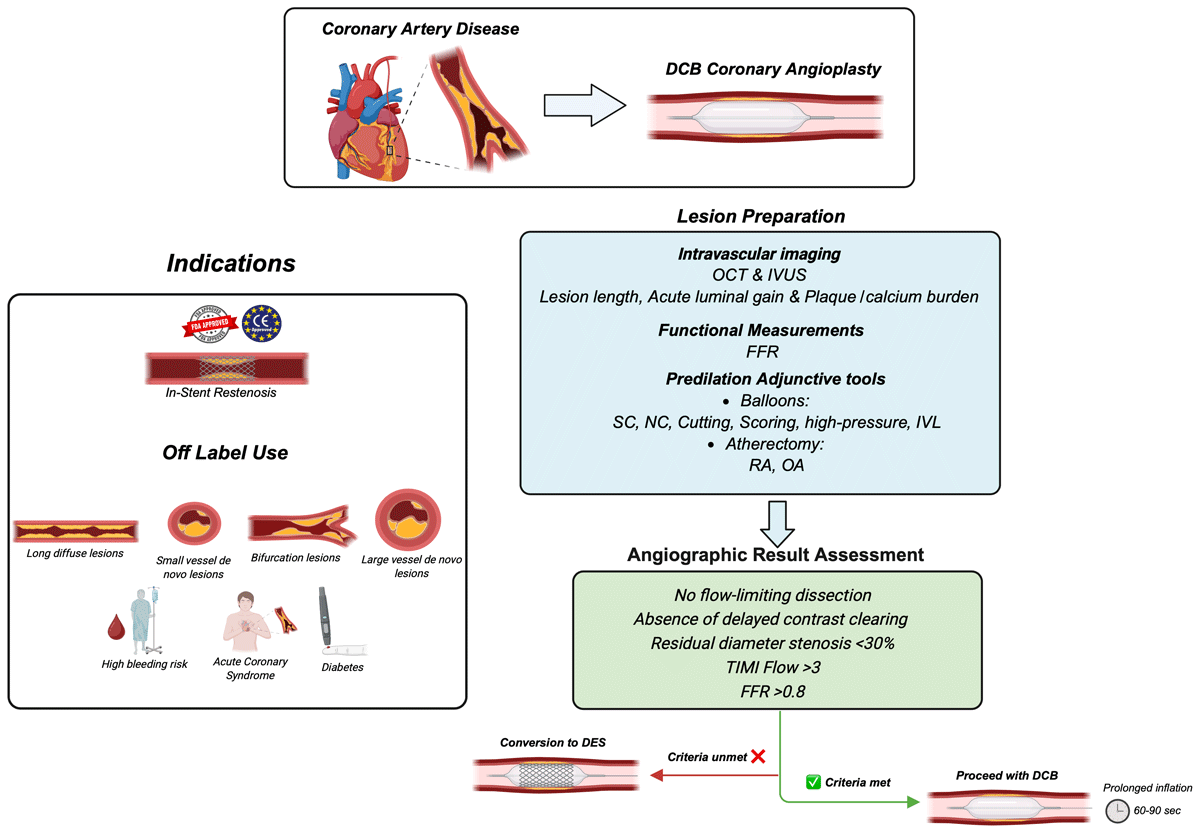
Figure 5
Central illustration: Drug-coated balloon indication and treatment strategy in coronary artery disease. Adopted from the international DCB consensus group. DCB: drug-coated balloon; DES: drug-eluting stent; FFR: fractional flow reserve; ISR: in-stent restenosis; IVL: Intravascular lithotripsy; IVUS: intravascular ultrasound; NC: non-compliant; OCT: optical coherence tomography; OA: orbital atherectomy; PCI: percutaneous coronary intervention; RA: rotational atherectomy; SC: semi compliant
Table 2
Summary of the main clinical trials of the use of DCB in de novo small vessel coronary artery disease. PCB: paclitaxel-coated balloon; DES: drug coated stent; MACE: major adverse clinical events; DCB: drug coated balloon; LLL: late lumen loss; TLR: target lesion revascularization; BMS: bare metal stent
| STUDY NAME | YEAR | ARMS | n | MAIN FINDINGS | MAIN CONCLUSION |
|---|---|---|---|---|---|
| PICCOLETO58 | 2010 | PCB vs DES | 57 | Angiography (6 months):
| DCB angioplasty exhibited inferior antirestenotic efficacy compared to DES implantation. |
| BELLO59 | 2012 | PCB vs DES | 182 | Angiography (6 months)
MACE (6 months): 10% vs 16.3% (P = .021) | PCB shows lower angiographic late loss with comparable rates of restenosis and revascularization to DES. |
| BASKET-SMALL 265 | 2018 | PCB vs DES | 758 | Follow-up (12 months): Lesion-related MACE (12 months): 7.3% vs 7.5 % (P = .918) | PCB demonstrated non-inferiority to DES for MACE up to 12 months and similar event rates among both groups. |
| RESTORE SVD61 | 2018 | PCB vs DES | 230 | Angiography (9 months):
| PCB shows comparable clinical effectiveness and safety to DES implantation at 1 year. |
| PICCOLETO II64 | 2020 | PCB vs DES | 232 | Angiography (6 months):
| PCB showed noninferior angiographic effectiveness at 6 months and similar event rates at 1 year. |
| PEPCAD66 | 2013 | PCB vs BMS | 120 | Angiography (6 months)
MACE (12 & 36 months) 6.1% vs 37.5% (P < .001) | PCB demonstrated similar angiographic outcomes to BMS at 6 months with positive clinical outcomes of MACE and TLR at 1 and 3 years. |
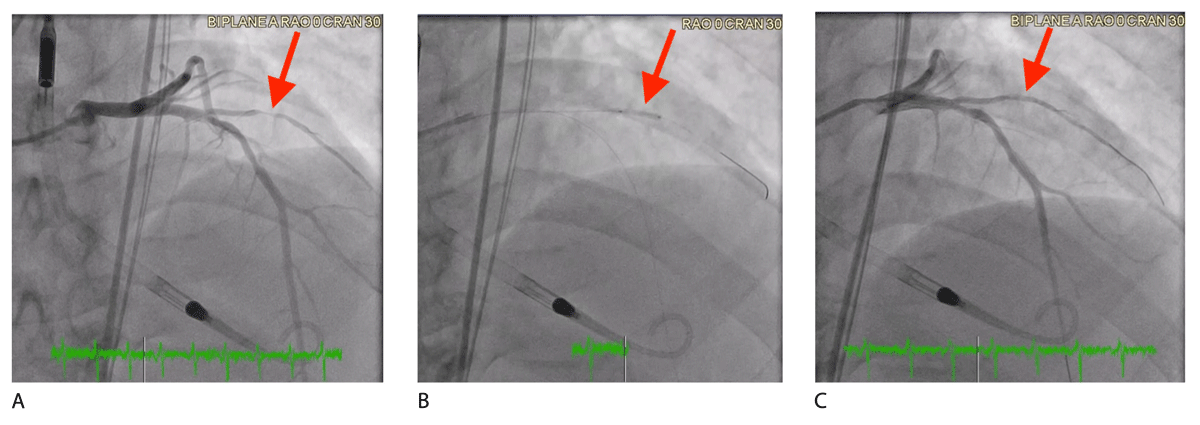
Figure 6
Coronary angiogram images illustrating treatment of de novo small vessel disease using a drug-coated balloon (DCB). (A) Pre-treatment image showing 90% stenosis proximal segment of the 1st diagonal branch. (B) Deployment of a 2.5 × 15 mm AGENT drug-coated balloon, inflated to 8 atm for 60 seconds. (C) Post-treatment image showing a significant reduction in stenosis to 20% following DCB intervention.
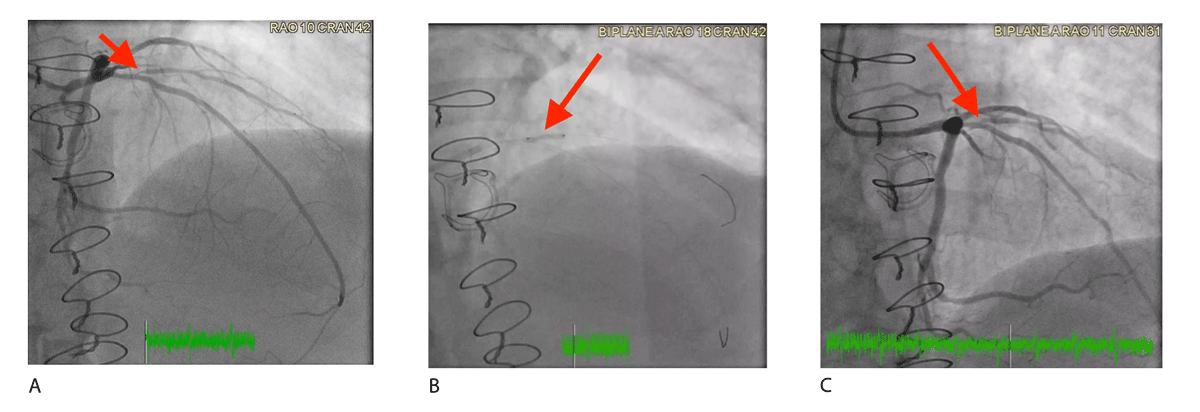
Figure 7
Coronary angiogram images demonstrating treatment of a de novo small vessel disease involving the ostial first diagonal branch with 90% stenosis using a drug-coated balloon (DCB). (A) Pre-treatment image showing 90% stenosis at the ostium of the first diagonal branch. (B) Deployment of a 2.5 × 12 mm AGENT DCB, inflated to 4 atm for 60 seconds. (C) Post-treatment image showing a reduction in stenosis to 30% and improved vessel patency following DCB intervention.
Table 3
Summary of the main clinical trials of the use of DCB in coronary bifurcation lesions. BMS: bare metal stent; MB: main branch; DCB: drug coated balloon; SB: side branch; POBA: plain old balloon angioplasty; DES: drug coated stent; LLL: late lumen loss; MACE: major adverse clinical events; PCB: paclitaxel-coated balloon; TLR: target lesion revascularization
| STUDY NAME | YEAR | ARMS | n | MAIN FINDINGS | MAIN CONCLUSION |
|---|---|---|---|---|---|
| DEBIUT76 | 2012 | (A) BMS MB/DCB SB (B) BMS MB/POBA SB (C) DES MB/POBA SB | 117 | Angiography (6 & 12 months): LLL proximal MB, distal MB, distal SB (P = .001) LLL (A): 0.58 ± 0.65, 0.41 ± 0.60, and 0.19 ± 0.66 mm LLL (B): 0.60 ± 0.65, 0.49 ± 0.85, and 0.21 ± 0.57 mm LLL (C): 0.13 ± 0.45, 0.19 ± 0.64, and 0.11 ± 0.43 mm MACE (12 months)- A/B/C: 24.2%, 28.6%, 15% (P = .45) | Pretreatment of both MB and SB with PCB did not demonstrate any angiographic or clinical advantages over conventional BMS when using a provisional T-stenting approach. Additionally, DES showed better angiographic outcomes compared to both PCB and BMS. |
| PEPCAD-V70 | 2011 | BMS to MB & PCB to SB | 28 | Angiography (9 months): LLL: MB 0.38 ± 0.46, SB 0.21 ± 0.48 | Percutaneous treatment of bifurcation lesions with PCB to the SB was 100% successful and showed similar angiographic results to DES at 9 months. |
| PEPCAD-BIF71 | 2016 | PCB vs POBA of SB | 64 | Angiography (9 months): LLL: 0.13 mm 0.51 mm (P = .013) | PCB is a superior strategy to POBA of side branch vessels in bifurcation lesions. |
| BIOLUX-172 | 2015 | DES to MB & PCB to SB | 35 | Angiography (9 months): LLL of SB: 0.10 ± 0.43 | DES to the main branch and PCB to the side branch is a safe and effective strategy to treat bifurcation lesions. |
| BABILON75 | 2014 | (PCB) BMS MB & PCB SB vs (DES) DES MB & POBA SB* | 108 | Angiography (9 months): LLL (MB): PCB 0.31 ± 0.48 mm DES 0.16 ± 0.38 mm (P = .15) LLL (SB): PCB -0.04 ± 0.76 mm DES -0.03 ± 0.51 mm (P = .983) MACE (2 years): PCB 17.3% vs DES 7.1% (P = .045) | PCB bifurcation pretreatment with BMS in the MB resulted in higher LLL and more MACE events than everolimus DES, while both strategies had similar outcomes in the SB. |
| EASTBOURNE-BIF74 | 2024 | DES MB & PCB to SB vs de novo non-bifurcation lesions | 194 | Angiography (12 months): TLR: 4.2% vs 2% (P = .28) MACE 8.8% vs 5.2% (P = .081) | The use of this DCB, either alone or in combination with drug-eluting stents, could offer a safe and effective alternative to stents for treating bifurcations. |
[i] *NOTE: MB pre-dilation with PCB in the BMS MB group