
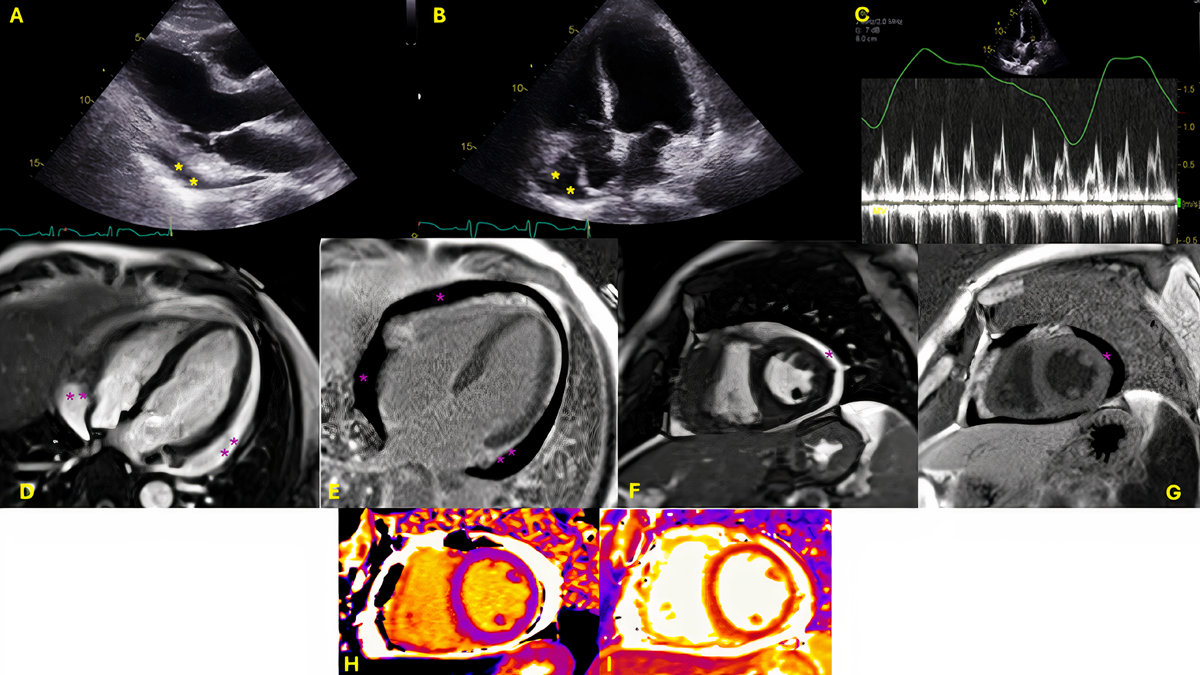
Figure 1
(A) Transthoracic echocardiogram, parasternal long-axis image with small posterior pericardial effusion (asterisk), (B) transthoracic echocardiogram, apical 4-chamber view with anterior pericardial effusion (asterisk). (C) Pulsed wave Doppler across the mitral inflow showing respiratory variation > 25% consistent with increased intrapericardial pressures. (D, F) Cardiovascular magnetic resonance imaging, balanced steady-state free precession sequence in apical 4-chamber (D) and short-axis view (F) showing circumferential pericardial effusion (moderate, asterisk). (E, G) Late gadolinium enhancement imaging suggests nulled myocardium with no evidence of ischemic damage or myocarditis. (H, I) T1 and T2 parametric mapping.
Video 1
Cine steady-state free precession cardiac MRI sequence (real-time imaging) in short axis stacks across the LV, 4-chamber view, 2-chamber view, and 3-chamber view. There is circumferential pericardial effusion but no evidence of chamber collapse. The left ventricular function is borderline reduced; also view at https://youtube.com/shorts/mFHytiYCu5k.
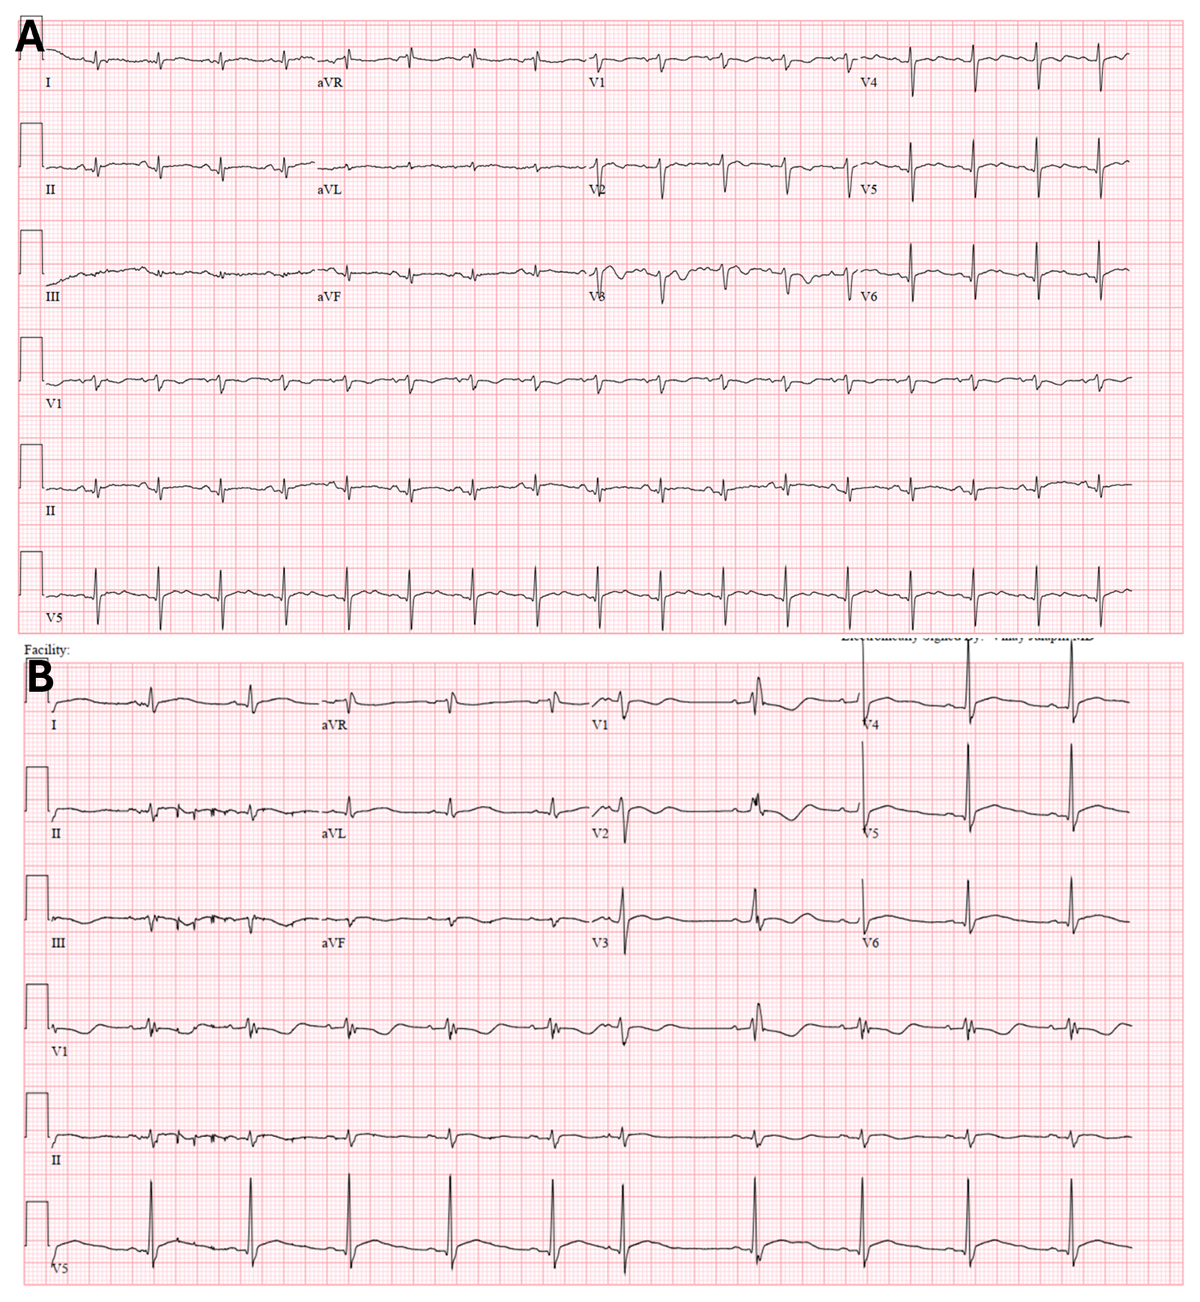
Figure 2
(A) 12-lead electrocardiography showing sinus tachycardia but no acute ST-T wave changes. (B) Subsequent electrocardiogram showing interval development of right bundle branch block.
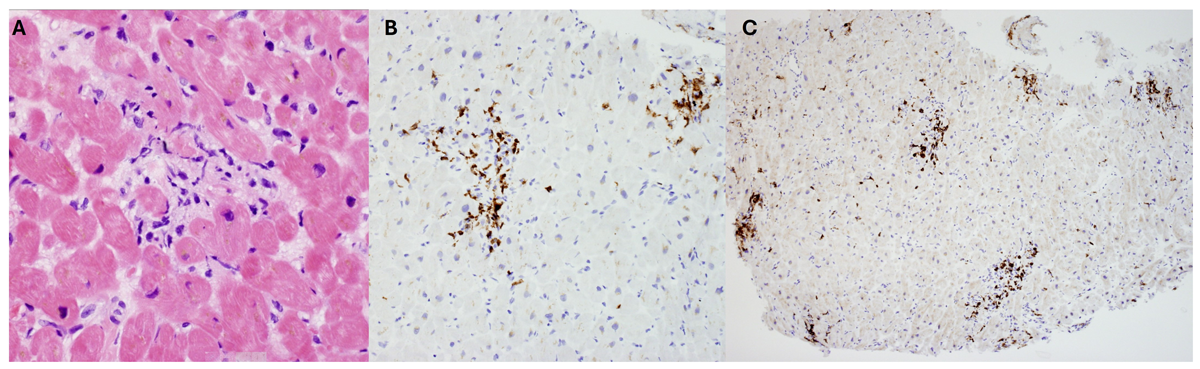
Figure 3
(A) Hematoxylin and eosin stain showing increase perivascular and interstitial CD3 positive (B) and CD8 (C) T-cells, findings compatible with immune checkpoint inhibitor-associated myocarditis.