
Figure 1
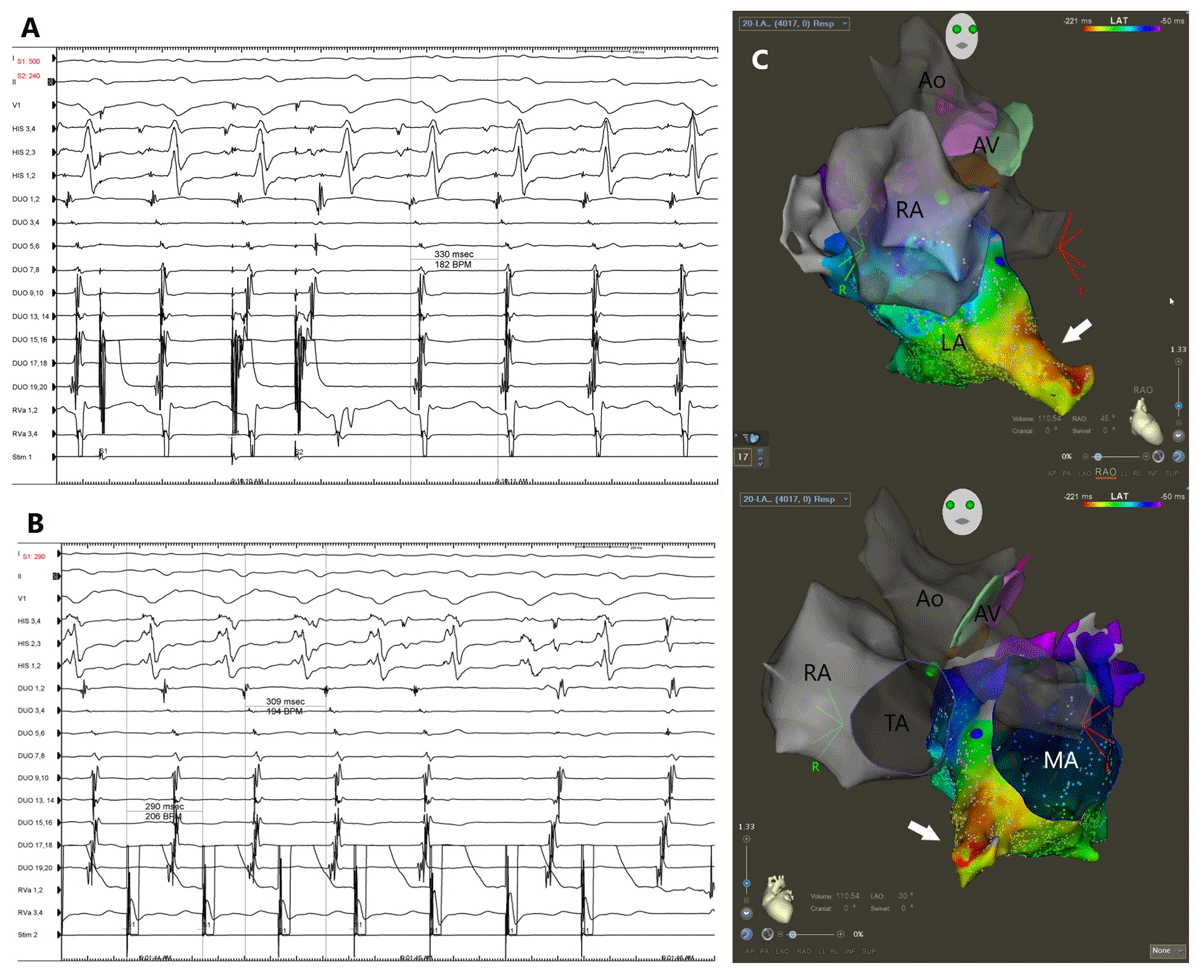
(A) Supraventricular tachycardia (SVT) with variable tachycardia cycle length (TCL) from 310–340 ms was induced by atrial pacing. There was a 1:1 atrioventricular relationship with long RP intervals. Septal atrial activation was high to low. (B) Ventricular overdrive pacing resulted in atrioventricular dissociation without affecting the tachycardia (SVT spontaneously terminated during pacing). (C) Three-dimensional electroanatomic activation mapping during atrial tachycardia in the right anterior (top) and left anterior (bottom) oblique views. The earliest site of atrial activation was located in a diverticulum located on the anterior-inferior aspect of the left atrium (white arrows). Panels A and B depict electrocardiographic leads I, II, and V1; electrograms of a quadripolar catheter in the His position (HIS 1,2 through 3,4); electrograms of a PENTARAY diagnostic catheter (labeled as DUO 1,2 through DUO 19,20); and electrograms of right ventricular apex (RVa 1,2 and 3,4). The PENTARAY diagnostic catheter was positioned in the high right atrium. Ao: ascending aorta; AV: aortic valve; LA: left atrium; MA: mitral annulus; RA: right atrium; TA: tricuspid annulus
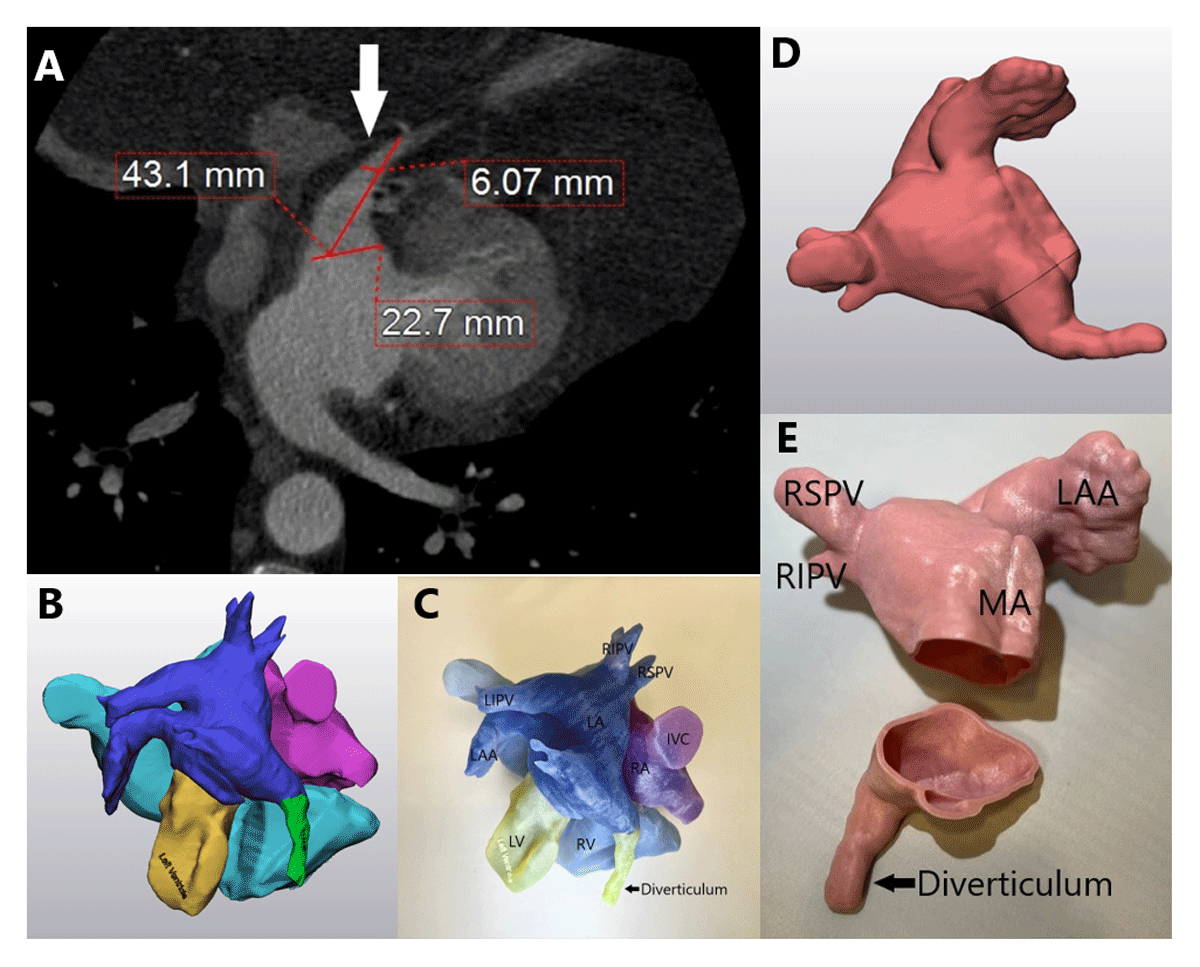
Figure 2
(A) Cardiac computed tomography showed a large left atrial diverticulum (4 cm by 2 cm at the ostium) located on the anterior-inferior aspect of the left atrium that tapered and terminated into the perihepatic fat tissue (white arrow). (B, C) Digital and 3-dimensional (3D) printed models show the left atrium diverticulum in relationship with other cardiac structures. (D, E) Digital and 3D printed models of the left atrium with the inferior portion transected to show left atrium diverticulum in relationship with other left atrial structures. IVC: inferior vena cava; LA: left atrium; LAA: left atrial appendage; LIPV: left inferior pulmonary vein; LV: left ventricle; MA: mitral annulus; RA: right atrium; RIPV: right inferior pulmonary vein; RSPV: right superior pulmonary vein; RV: right ventricle
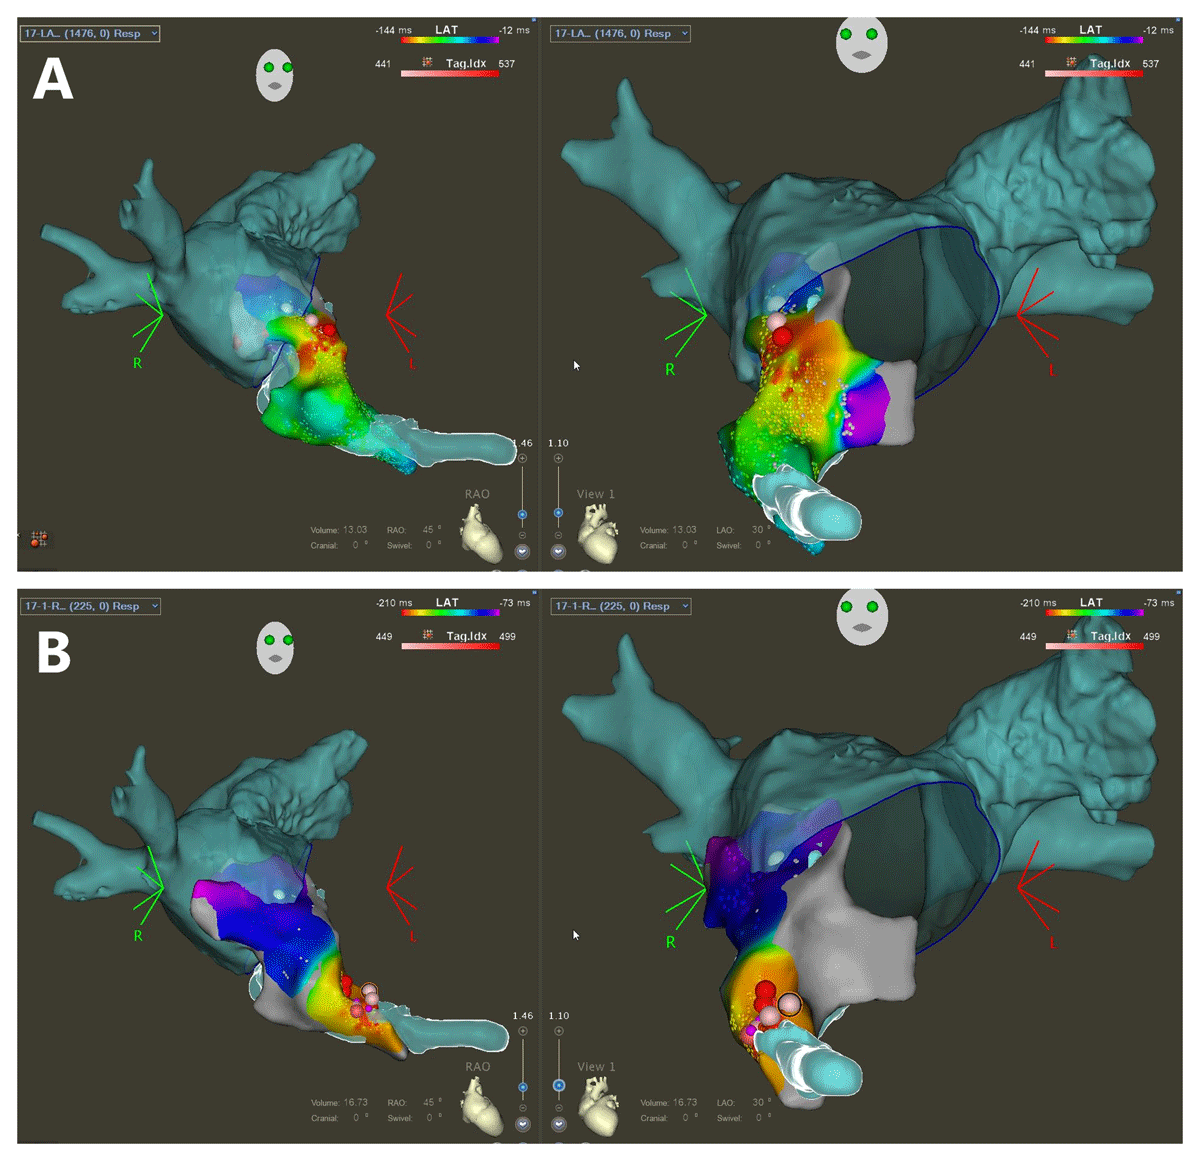
Figure 3
Three-dimensional electroanatomic activation mapping overlaying CT reconstructed images of the left atrium during atrial tachycardia (AT). (A) During the first AT with tachycardia cycle length (TCL) 370 ms, AT was mapped to the earliest site near the ostium of the left atrial diverticulum. Ablation resulted in termination of the first AT and initiation of the second AT. (B) During the second AT with TCL 315 ms, AT was mapped to the earliest site inside the diverticulum. Ablation at the site resulted in termination of the second AT. Left panels: right anterior oblique view; right panels: left anterior oblique view
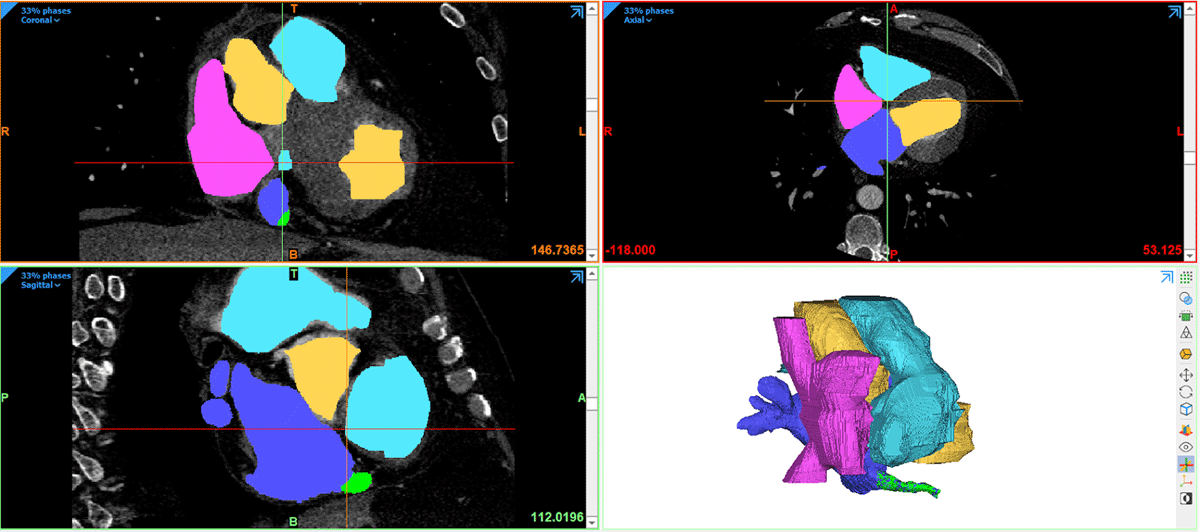
Figure 4
Initial raw 3-dimensional computer-aided design model of the patient’s heart, with each chamber of the heart modeled as a separate part.
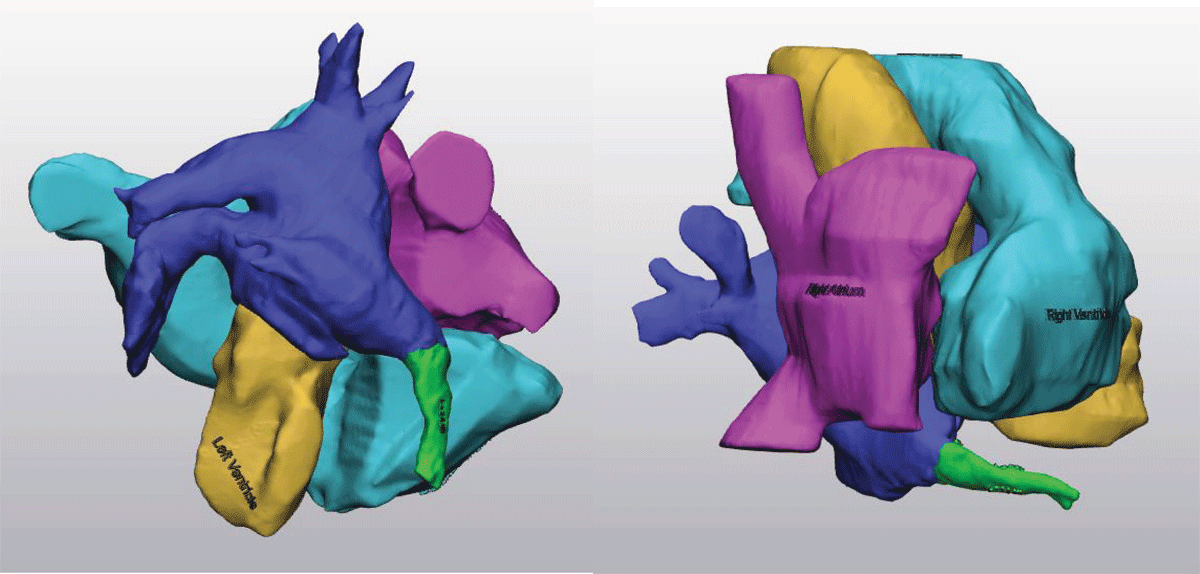
Figure 5
The first model portrays each chamber of the heart with the diverticulum colored differently, semitranslucent, and labeled. The measurements of the diverticulum are added to the 3-dimensional printed model as a text label.
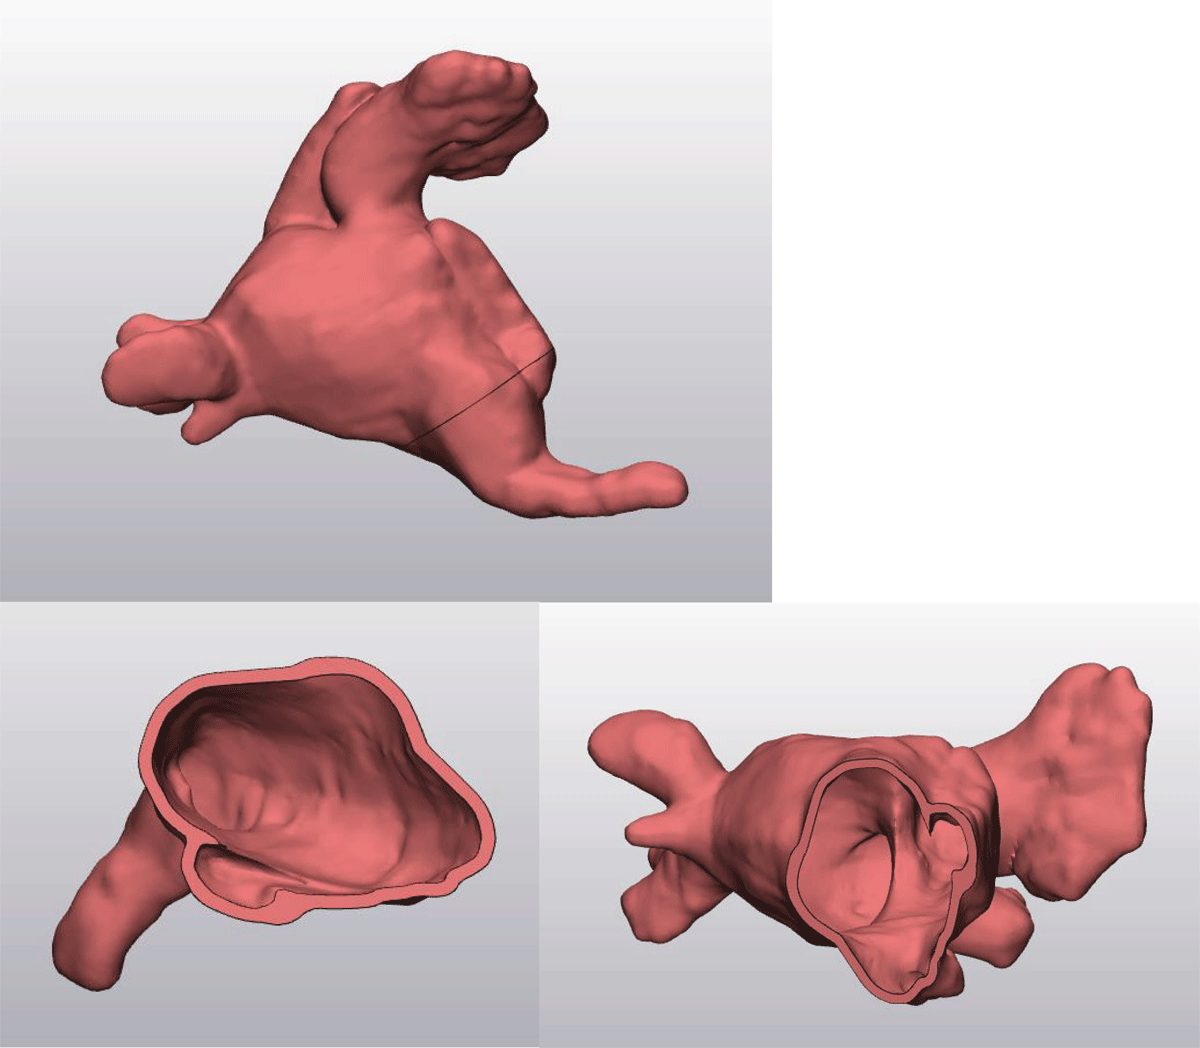
Figure 6
The second model is hollow and opaque with a digitally created cut down the middle, so that the cardiac team can visualize the opening of the diverticulum from the inside of the heart.