
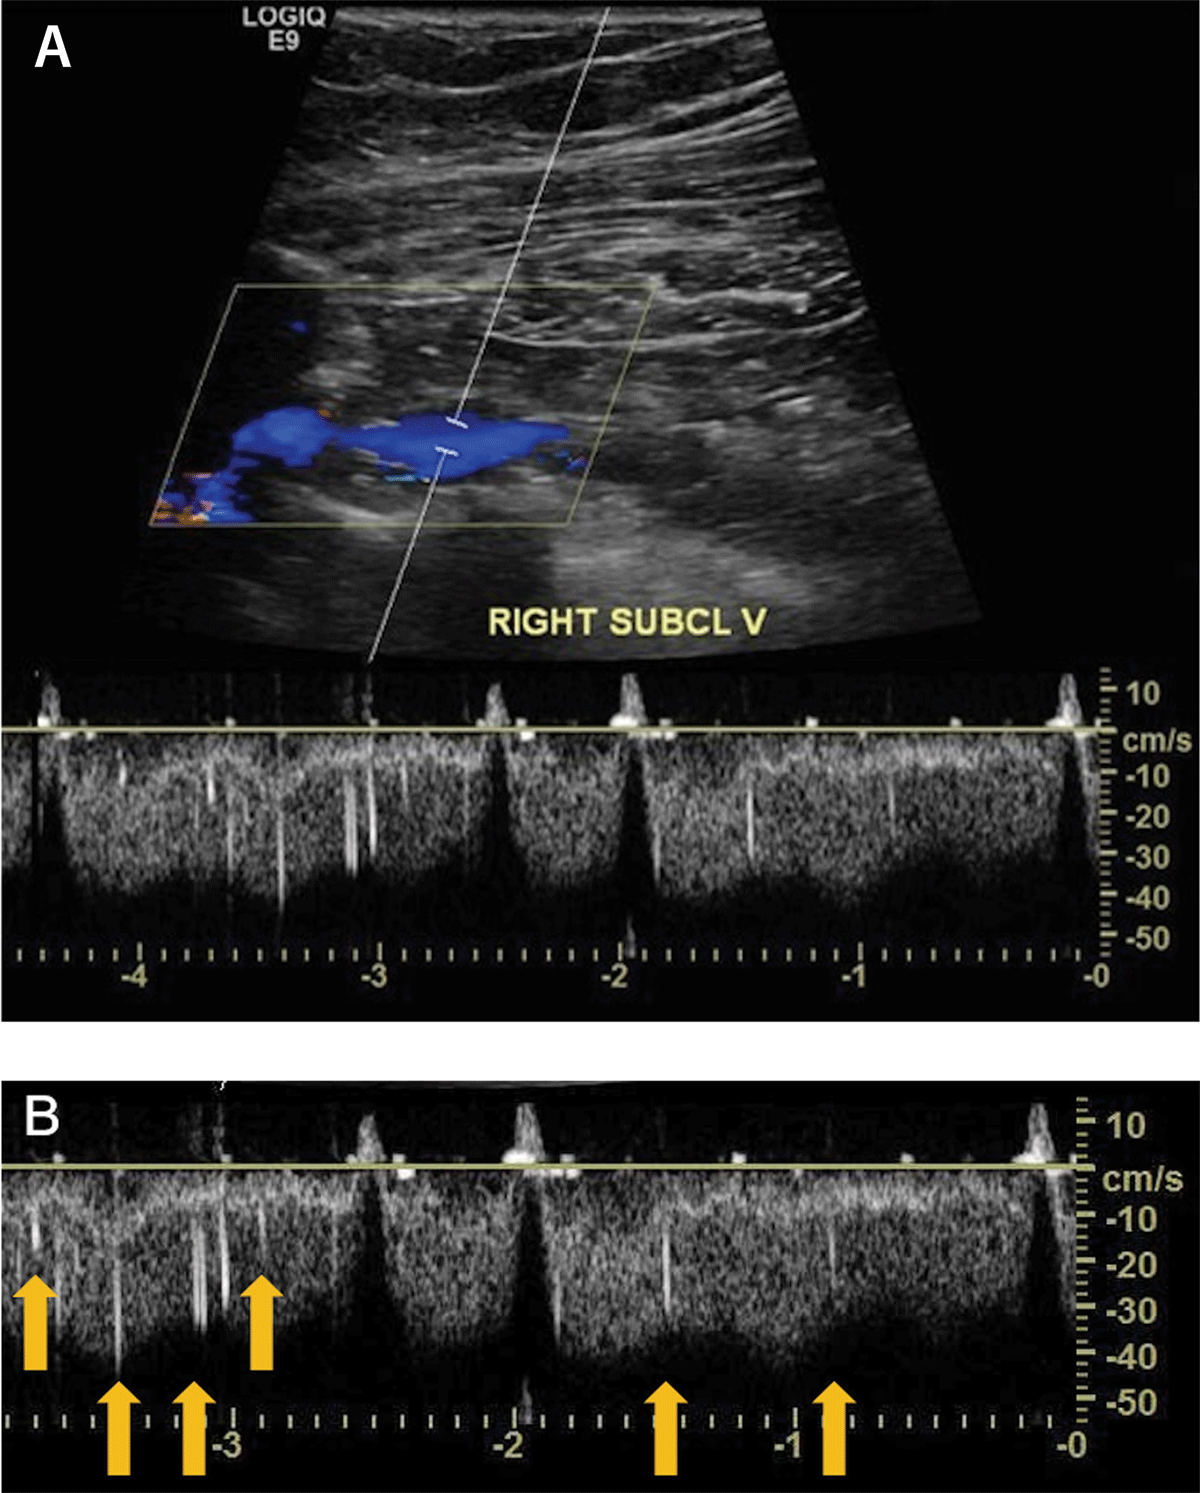
Figure 1
Venous duplex ultrasound of the right subclavian vein. (A) The rhomboid box illustrates the color Doppler showing blue blood flow without any visible clot. (B) Spectral Doppler (Zoom) shows multiple high intensity transient signals representing fat microemboli (denoted by yellow arrows).
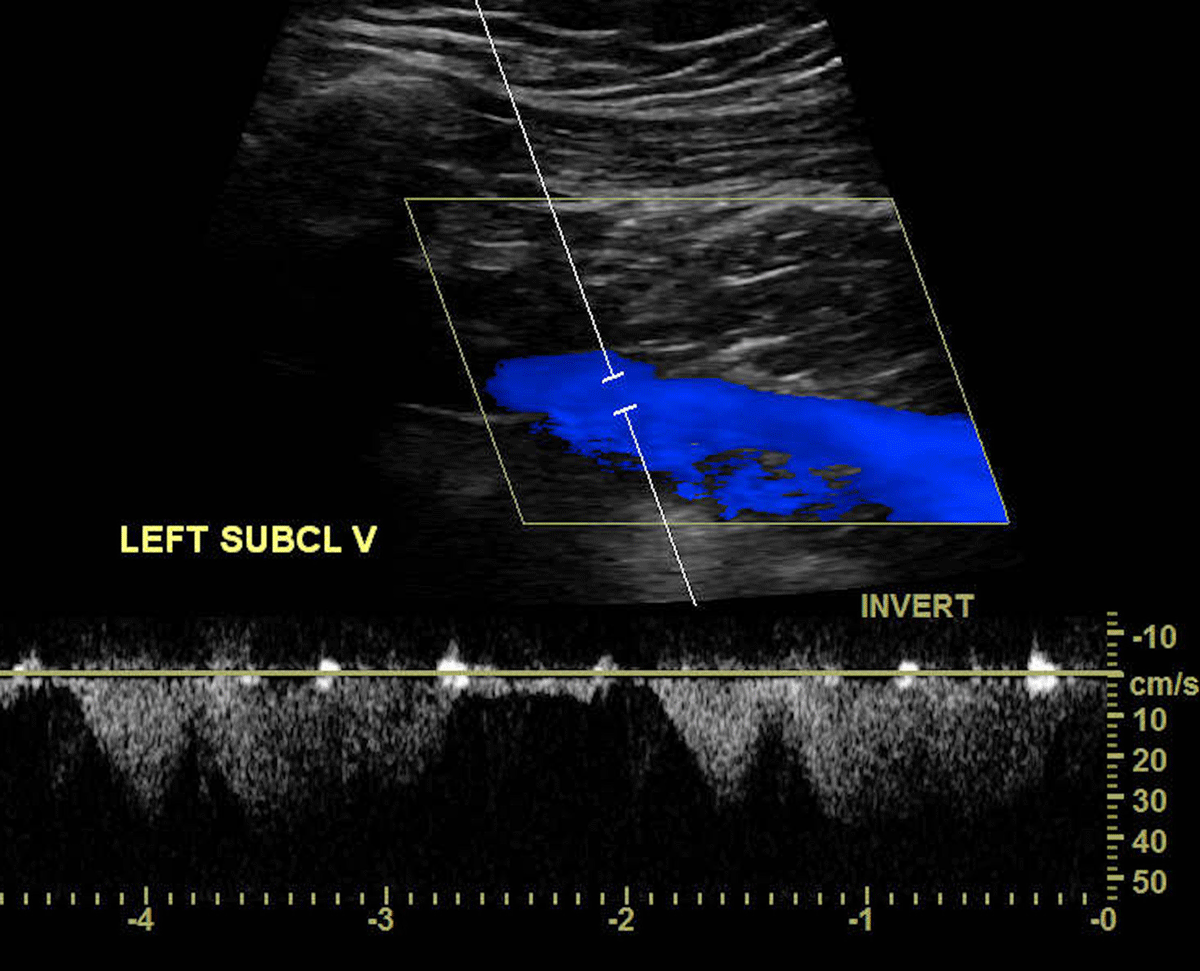
Figure 2
Venous duplex ultrasound of the left subclavian vein. Doppler image demonstrates normal blood flow and no detection of high intensity transient signals in the spectral Doppler.