
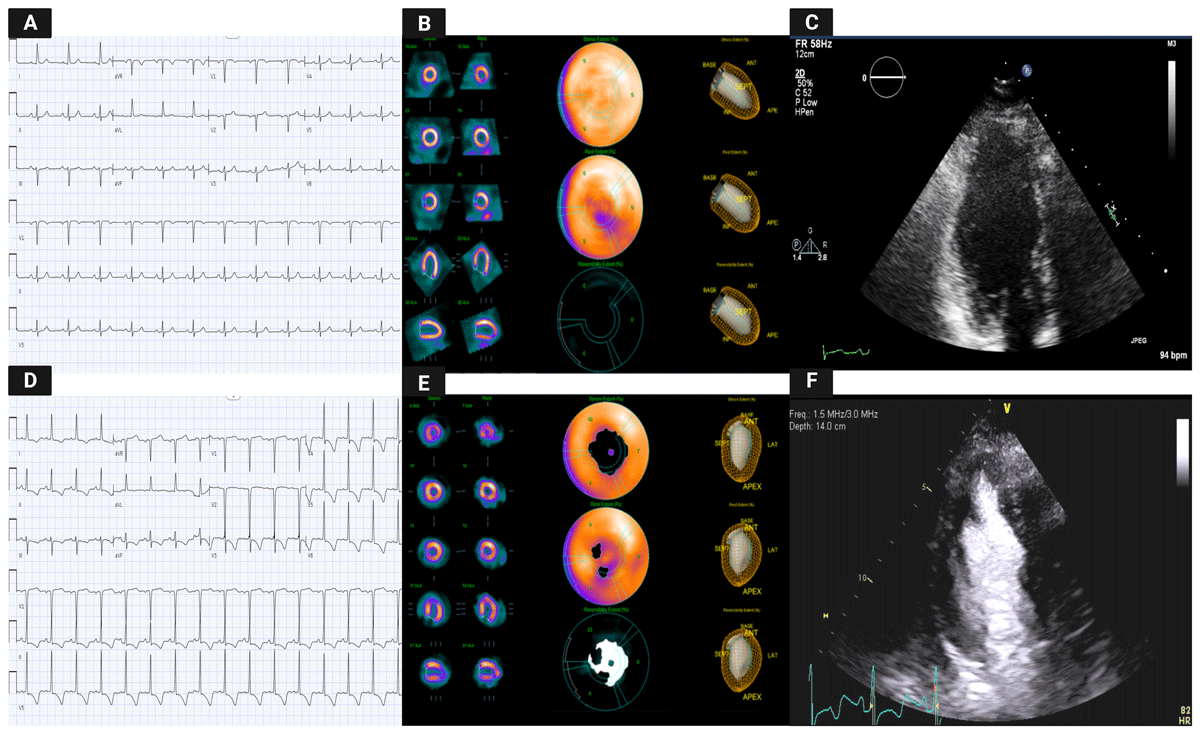
Figure 1
Illustration of the comparison between multi-imaging modalities in a 1-year follow-up period. (A) Previous electrocardiogram (ECG) showed no abnormalities compared to the ECG at current presentation (D), which showed diffuse T wave inversion. (B, E) Myocardial perfusion studies demonstrate side-by-side comparison of new ischemia involving the distal inferior and apical segments. (F) Transthoracic echocardiography show new apical hypertrophy in parasternal short axis with enhancing agent compared to the previous study (C).
Video 1
Apical four-chamber echocardiography view before diagnosis showing no significant abnormalities; see also at https://youtu.be/NAWtaBxa1lw.
Video 2
Apical four-chamber echocardiography view after diagnosis showing the apical hypertrophy; see also at https://youtu.be/nC0sTpOcq9c.
Video 3
Apical two-chamber echocardiography view with contrast after diagnosis showing the apical hypertrophy; see also at https://youtu.be/x6nKidbm-us.
Video 4
Cardiac magnetic resonance study demonstrates apical hypertrophic cardiomyopathy; see also at https://youtube.com/shorts/nSbHeF8F2Wg.
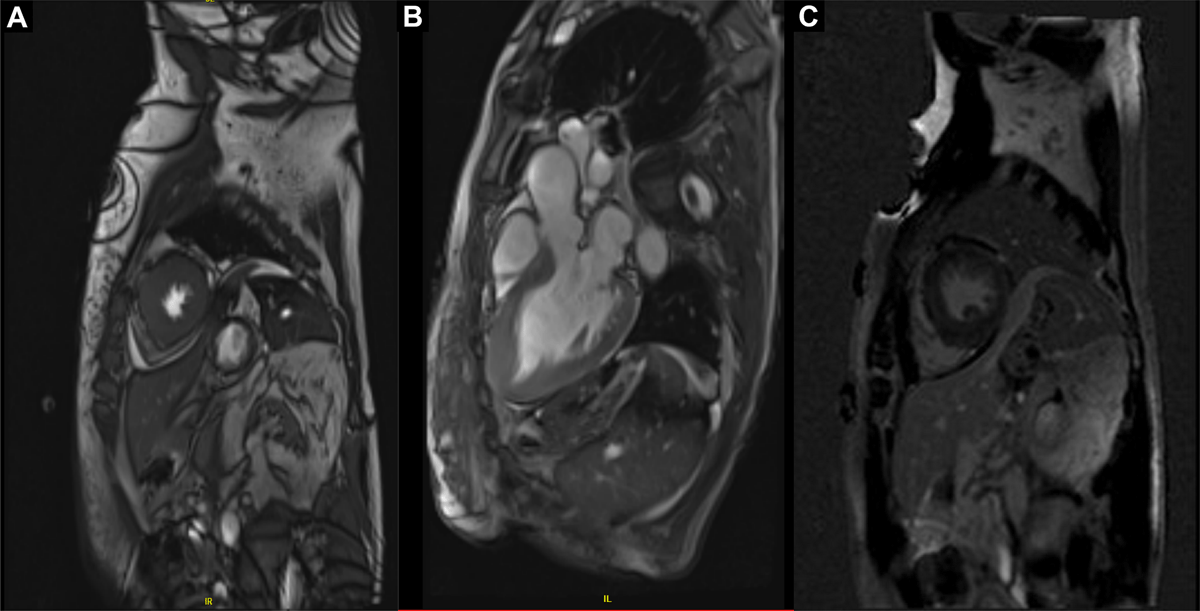
Figure 2
Cardiac magnetic resonance study demonstrates apical hypertrophic cardiomyopathy with the presence of fibrosis in the apical region. (A) Short axis image 3-chamber view at the left ventricular apical level (B) and within the apical interventricular septum and inferior wall. (C) Roughly 5% patchy mid-myocardial areas of minimal late gadolinium enhancement can be identified.