
Figure 1
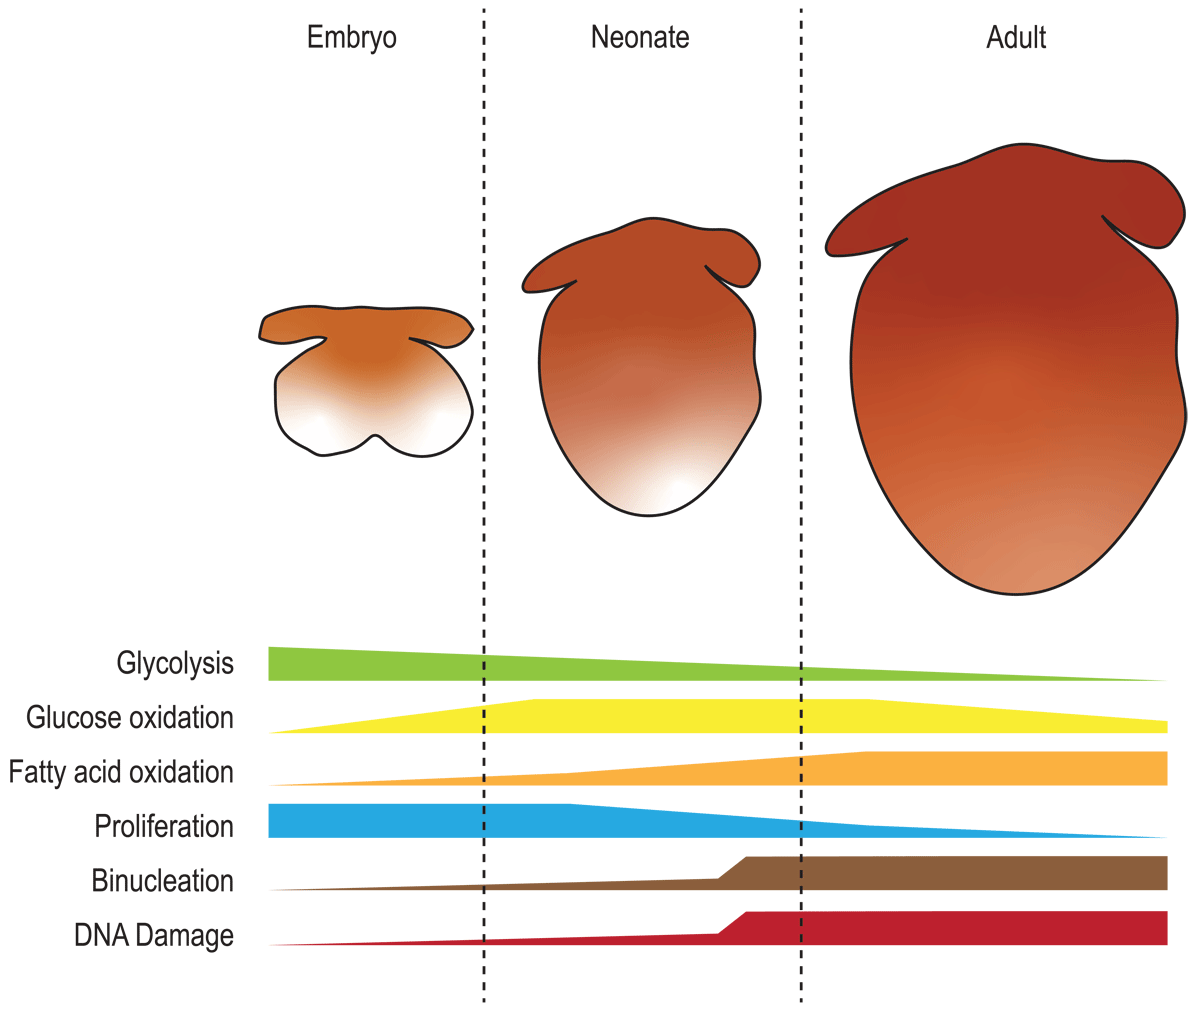
Cardiac metabolism from embryo to adult. Schematic representation of glycolysis, glucose oxidation, and fatty acid oxidation during embryonic, neonatal, and adult stages. The graph also includes the temporal dynamic of cardiac key processes (proliferation, binucleation, and DNA damage) in relation to the metabolic changes.
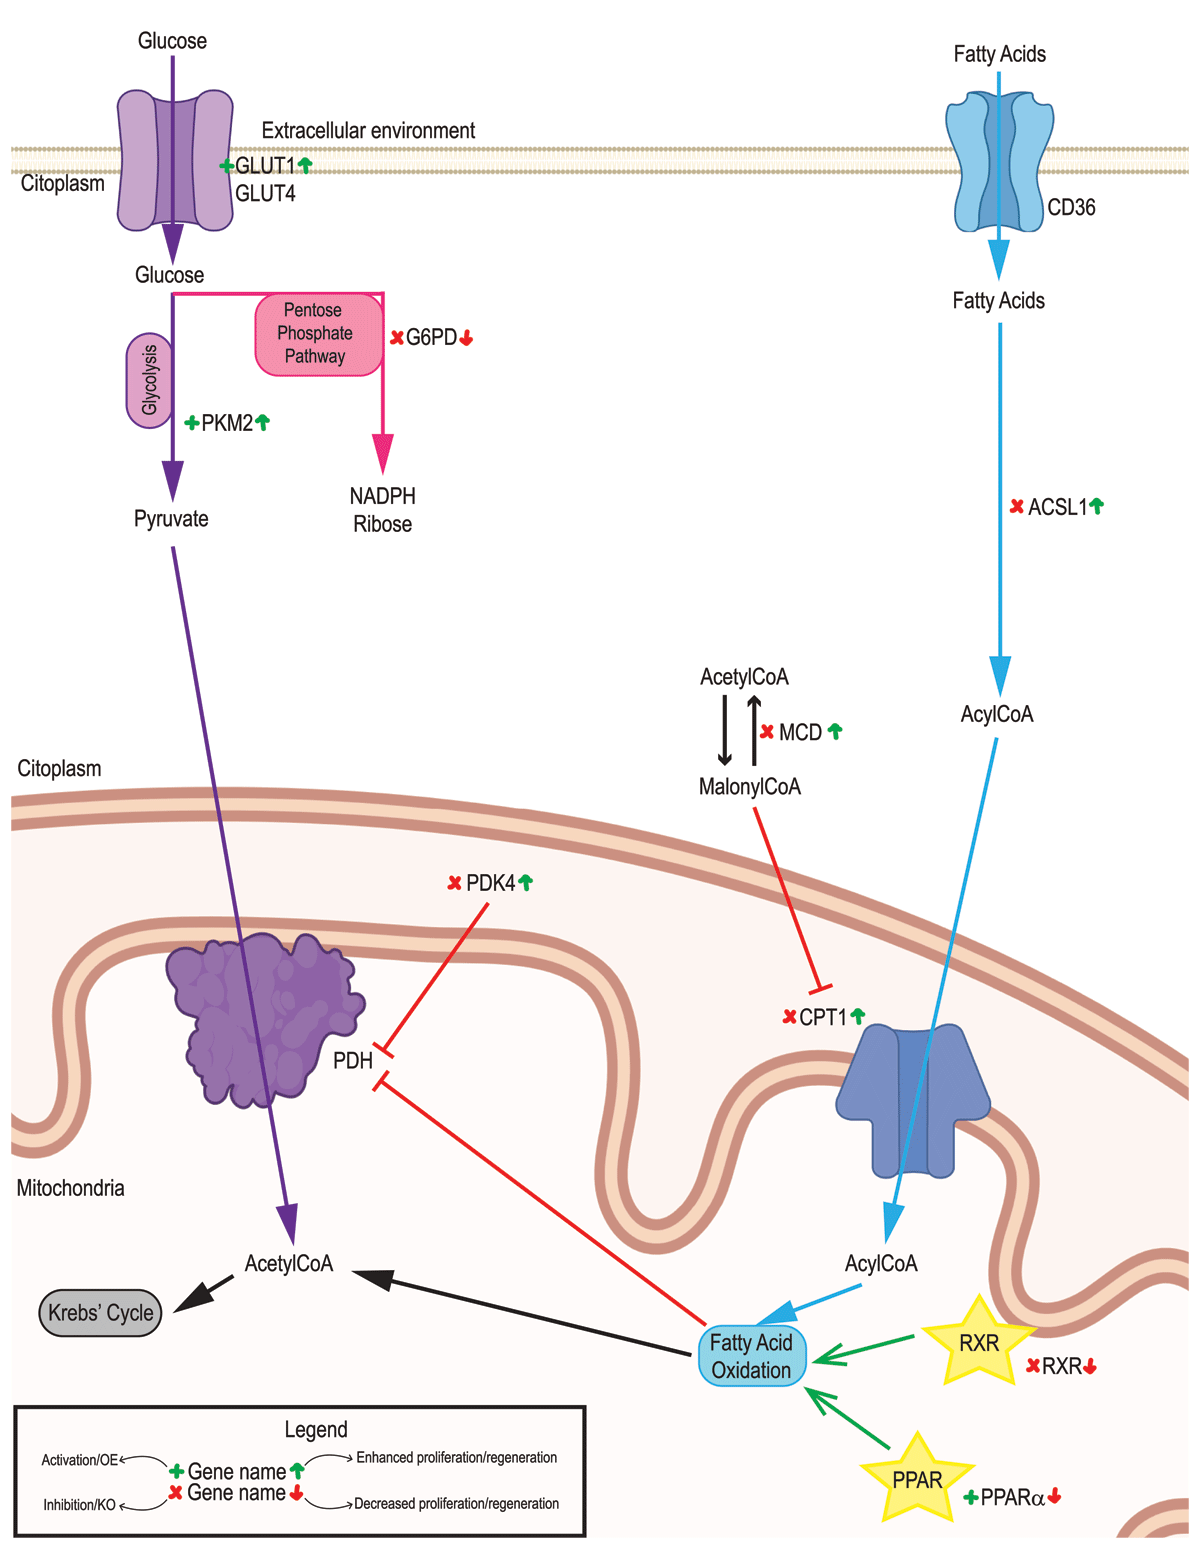
Figure 2
Glucose and fatty acids metabolism in the adult heart. Glucose oxidation (purple), fatty acids metabolism (blue), and Pentose Phosphate Pathway (pink) representation. Genetic/pharmacological models are indicated for activation/overexpression (green + symbol) or inhibition/deletion (red cross). Their outcomes are indicated on the right side of the name for increased (green up arrow) or decreased (red down arrow) proliferation/regeneration. Signaling pathways are indicated with a yellow star.
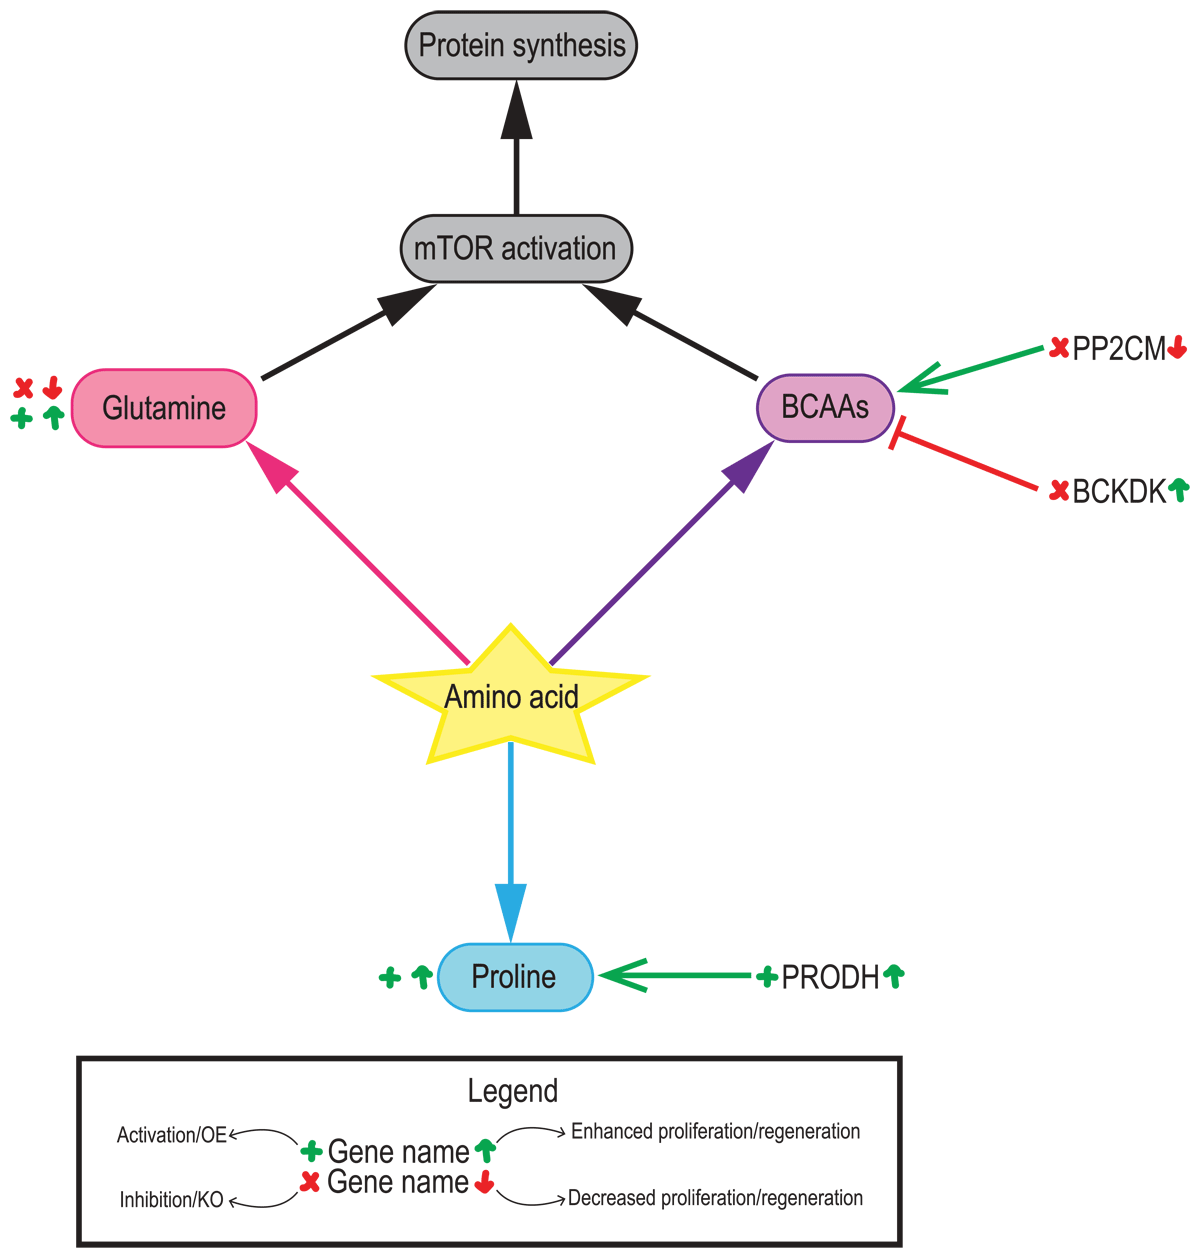
Figure 3
Contributions of amino acid metabolism in the adult heart. Contributions of glutamine (pink), branched-chain amino acids (BCAAs, purple) and proline (blue) to cardiac regeneration. Genetic/pharmacological models are indicated for activation/overexpression (green + symbol) or inhibition/deletion (red cross). Their outcomes are indicated on the right side of the name for increased (green up arrow) or decreased (red down arrow) proliferation/regeneration.