
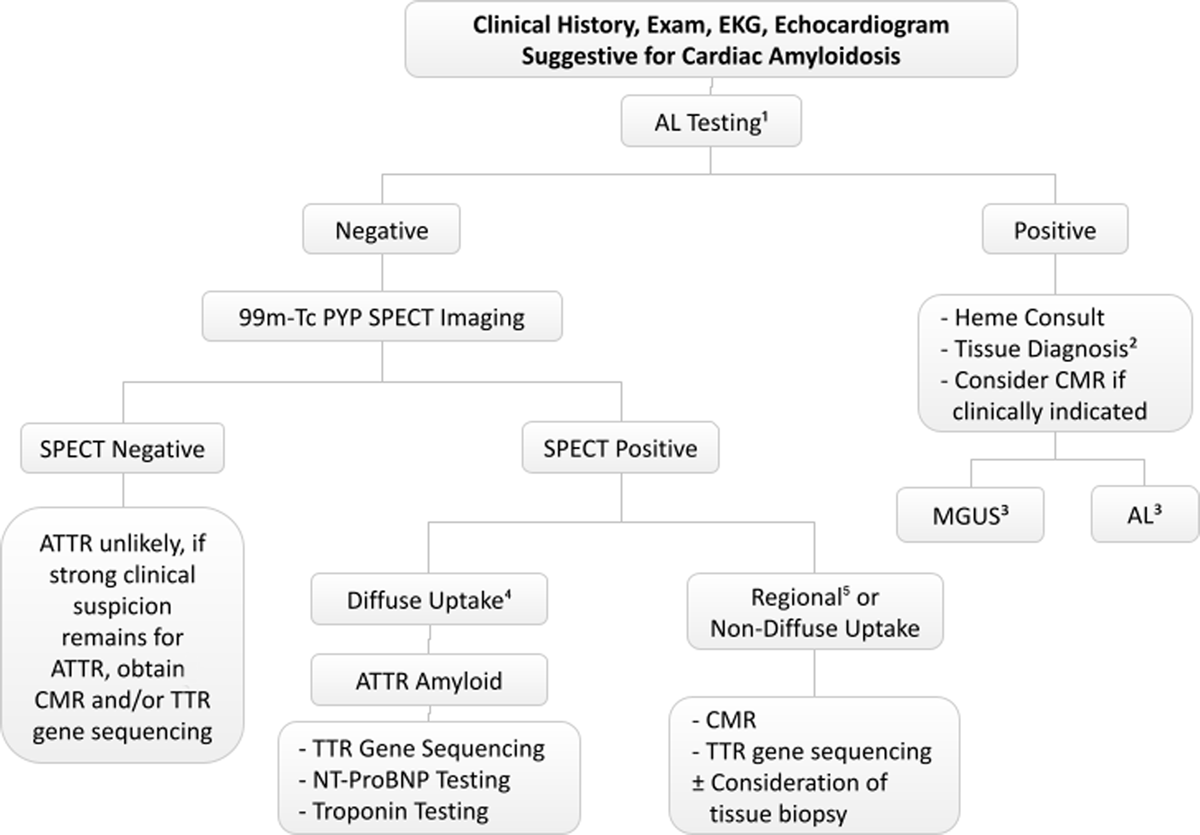
Figure 1
Simplified diagnostic algorithm for suspected cardiac amyloidosis. EKG: electrocardiogram; AL: immunoglobulin light chain; Heme: hematology; CMR: cardiac magnetic resonance imaging; Tc-99m PYP: technetium-99m pyrophosphate; SPECT: single-photon emission computed tomography; MGUS: monoclonal gammopathy of undetermined significance; ATTR/TTR: transthyretin; NT-proBNP: N-terminal prohormone of brain natriuretic peptide
Table 1
Extracardiac findings in amyloidosis that should prompt workup in patients presenting with heart failure.19,20,21
| PRESENTATION | AL AMYLOID | ATTR AMYLOID |
|---|---|---|
| Foamy urine | ✔ | — |
| Hepatosplenomegaly | ✔ | — |
| Macroglossia | ✔ | — |
| Purpura (periorbital, neckline) | ✔ | — |
| Arthropathy | ✔ | — |
| Skin bruising | ✔ | — |
| Autonomic dysfunction (intestinal motility/orthostatic hypotension) | ✔ | ✔* |
| Dysesthesia | ✔ | — |
| Carpal tunnel syndrome (often bilateral) | — | ✔ |
| Biceps tendon rupture | — | ✔ |
| Lumbar spinal stenosis | — | ✔ |
| Trigger finger | — | ✔ |
| Vitreous deposits | — | ✔ |
| Constipation/diarrhea | ✔ | ✔ |
| Unexplained weight loss (dysphagia, malabsorption) | ✔ | ✔ |
| Polyneuropathy | ✔ | ✔* |
[i] * More common in this subtype
Table 2
Clinical, echocardiographic, and EKG clues to cardiac amyloidosis.17,19,20,26,27,28,29,30,31,32 AL: amyloid light chain; BB: beta blocker; ACEi: angiotensin converting enzyme inhibitor; ARB: angiotensin receptor blocker; ARNI: angiotensin receptor neprilysin inhibitor; LVEF: left ventricular ejection fraction; GLS: global longitudinal strain; EKG: electrocardiogram; LV: left ventricle; MI: myocardial infarction
| CLINICAL FINDINGS |
|---|
| Proteinuria (AL) |
| Hepatosplenomegaly (AL) |
| Syncope |
| Unexplained weight loss, fatigue, cachexia |
| Orthostatic hypotension |
| Progressive decline of blood pressure, or the need for less anti-hypertensive medications over time |
| Inability to tolerate standard heart failure therapies (BB, ACEi/ARB, ARNI) or rate control strategy in atrial fibrillation |
| ECHOCARDIOGRAPHIC FINDINGS |
| Left ventricular hypertrophy particularly when associated with relative apical sparing pattern on global longitudinal strain analysis |
| Restrictive diastolic filling pattern |
| Left ventricular ejection fraction to global longitudinal strain ratio (LVEF/GLS) > 4.1 |
| Aortic stenosis |
| Mitral annular tissue Doppler S’ < 6 cm/s |
| Left ventricular ejection fraction 50% ± 5% |
| Low QRS voltage to LV mass ratio |
| Thickening of aortic and mitral valves and intra-atrial septum |
| Pericardial effusions |
| Average apical/basal longitudinal strain ratio > 2 |
| Atrial enlargement |
| Normal/small LV cavity size |
| EKG FINDINGS |
| Low voltage (QRS < 1 mV in precordial and < 0.5 mV in extremity leads) |
| Pseudoinfarct patterns without known prior MI (QS waves in any two consecutive leads) |
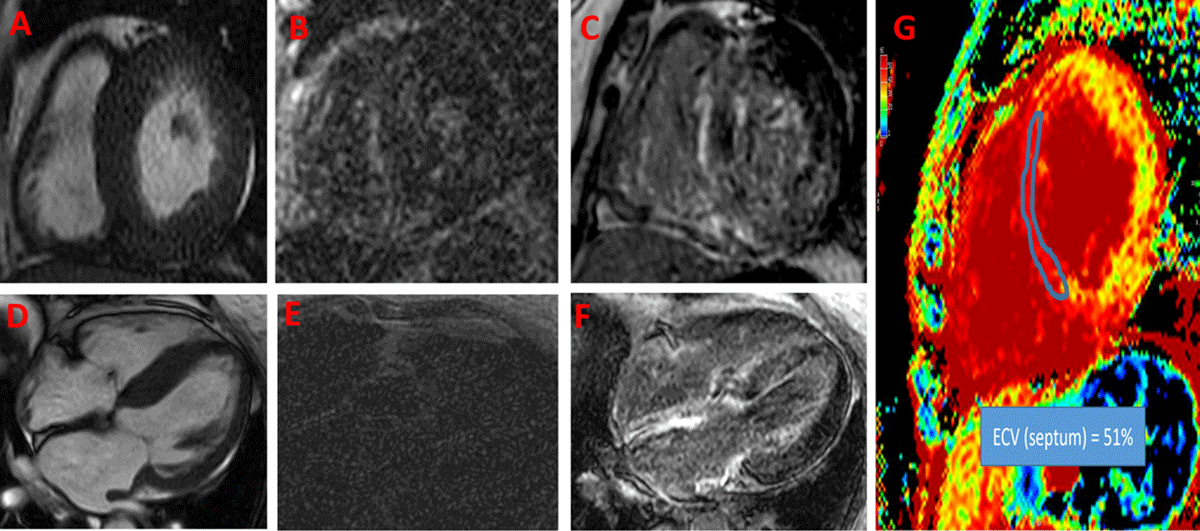
Figure 2
Cardiac magnetic resonance imaging (CMR) of a patient presenting with dyspnea and found to have left ventricular hypertrophy. First set of images (A, B and E) were obtained prior to presenting to our practice. Image A shows concentric left ventricular hypertrophy. Due to abnormal gadolinium kinetics and selecting an inappropriately low inversion time, late gadolinium enhancement (B) short axis and (E) 4-chamber views were not interpretable. (D) Repeat CMR shows severe asymmetrical septal hypertrophy on 4-chamber view; with choosing an appropriate inversion time for late gadolinium enhancement imaging, there was global enhancement of the left ventricle (sparing anterior and anterolateral segments), right ventricle, and both atria (C, F). Image G shows significant expansion of the extracellular volume (ECV) fraction (51% in the septum), which can be reliably obtained even if late gadolinium imaging sequences are suboptimal.
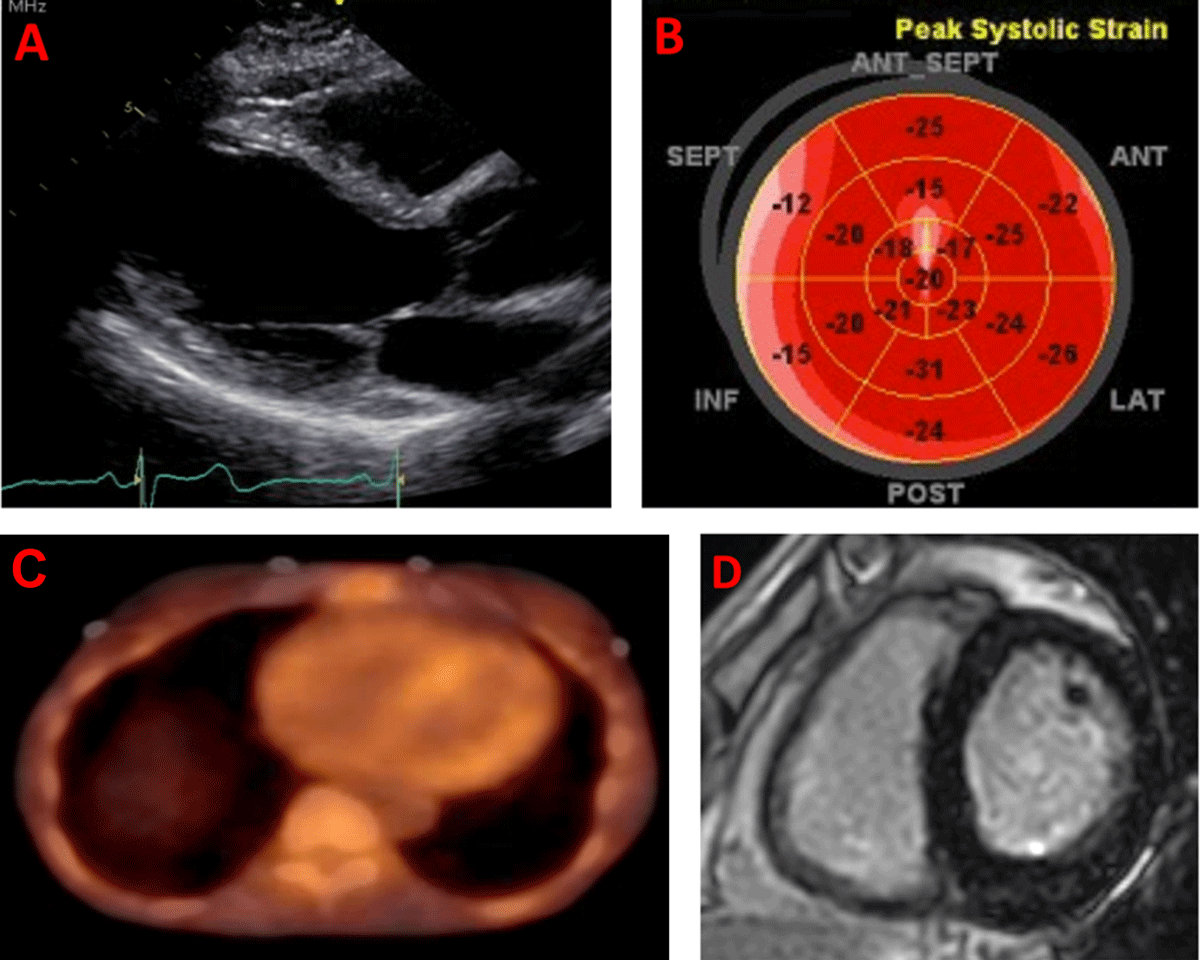
Figure 3
Multimodality imaging in the workup of a 70-year-old patient who is a carrier for the p.V50M variant and who presented with exertional shortness of breath and palpitations. (A) Echocardiogram parasternal long-axis window showing normal left ventricular wall thickness. (B) Depressed longitudinal strain, particularly in the basal septal segments (absence of apical sparing pattern). (C) 99m-technetium pyrophosphate single photo emission computed tomography showing diffuse uptake of the tracer in the myocardium. (D) Cardiac magnetic resonance imaging with phase-sensitive inversion recovery sequences obtained 15 minutes post gadolinium show minimal late gadolinium enhancement, but dedicated sequences showed elevated native T1 (1130 millisecond, 1.5 Tesla) and extracellular volume fraction (39%).